 🏗️ New Construction
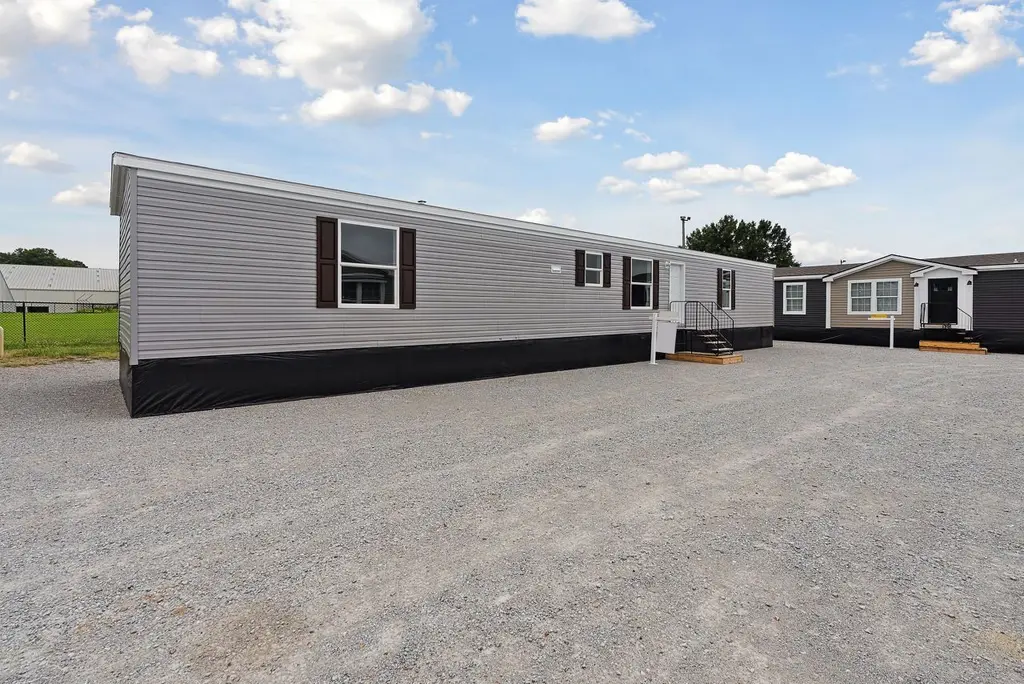
Belmont (Indian Oaks) Plan · Sellersburg, IN
Flood risk No data
- FEMA flood zone
- —
- Chance of flooding over 30 yrs
- —
- Est. flood insurance / yr
- —
Fire risk No data
- Est. fire insurance / yr
- —
Heat risk No data
- Hot days now (above threshold)
- —
- Hot days in 30 yrs
- —
Wind risk No data
- Chance of severe wind over 30 yrs
- —
Air-quality risk No data
- Unhealthy air days now
- —
- Unhealthy air days in 30 yrs
- —
Risk factors via First Street. Map © Google.
Why this score? — see what drove the C+ grade
The composite is a weighted blend of 9 inputs, each scored 0–100. Each bar is that input's sub-score; the figure is the points it added to the 100-point composite (weight × sub-score).
- Cash flow +20.7/30.0
- 1% rule +10.0/10.0
- ARV discount +7.5/15.0
- DSCR +6.6/10.0
- Schools +5.0/10.0
- Condition / age +5.0/5.0
- Livability +3.7/5.0
- Rent growth +2.5/5.0
- Appreciation +0.0/10.0
$75,995
🖨 Deal sheet 📄 Offer letter ✓ Due diligence
Listing remarks MLS
The Belmont offers a smart, spacious layout designed for comfortable everyday living. This thoughtfully designed home features 3 bedrooms and 2 full baths, providing plenty of room for family and guests. At the heart of the home, you'll find a beautiful, well-appointed kitchen that flows seamlessly into an expansive living area with extended length-perfect for entertaining, relaxing, or creating flexible spaces to fit your lifestyle. With its open design and generous proportions, the Belmont delivers both functionality and style in a home that truly feels inviting.
Key facts
- Listed 122 days
Neighborhood map
What this means for you Summary
Snapshot
- This is a 3-bed/2.0-bath manufactured listed at $76k. Condition is rated excellent.
Deal economics
- At list price, monthly cash flow is $103 ($1k/yr) — positive.
- The deal already cash-flows at list — no discount required.
- Meets the 1% rule at list price ($2k rent vs $76k).
- Recommended offer: $67k (12.0% below list) — sets the bar for market timing.
- Cap rate 7.9% vs local median 4.0% in Sellersburg — top-decile yield for the area; either an underpriced asset or a hidden risk that comps aren't pricing in. Stress-test before assuming the spread holds.
Location & tenants
- Location reads 73/100 on livability (#85 in IN) — a middle-class / working-renter tenant base. Strengths: cost of living A+, housing A+, crime A-; Watch: schools D+, commute D+, health & safety D+.
- Market conditions: 146 active listings in the ZIP; 6 comparable units currently listed for rent nearby; rentals leasing fast (median 2d on market — plan ~1-2 weeks tenant-placement turnaround); solid renter incomes; 911 units permitted in Clark County in 2024 (133 in 5+ unit buildings).
Forward outlook
- Local home prices are declining (-3.0%/yr); year-one equity from $525 of loan paydown is wiped out by about $2k of value loss. Plan a longer hold.
- Clark County population projected at +17% by 2050 — long-run rental-demand tailwind backs the buy-and-hold thesis.
Negotiation context
- It's been on market 123 days — a 12% lower offer ($67k) is reasonable based on typical stale-listing flexibility.
Risks & watch-outs
- Watch-outs: HOA is 37% of rent.
Questions for the listing agent
- It's been on market 123 days. Have you received any prior offers? Is the seller open to a 12% concession, seller financing, or rate buy-down credit?
- What does the HOA fee cover, when was the last increase, and are there any pending special assessments or reserve-fund shortfalls?
- Why hasn't it sold? Are there any deal-killer items the seller is aware of (foundation, flood, title, zoning, code violations)?
- Is there a deadline driving the sale (1031 exchange, divorce, estate, relocation)? That informs how much negotiation room exists.
- Schools are D-rated, which usually means shorter tenancies and higher turnover. Who's the typical renter profile here, and what's been the actual vacancy rate?
- What's the average days-on-market for RENTAL listings here right now (not sales)? A rising rental-DOM trend means longer vacancies and softer asking-rent achievability than the comps imply.
- What's the recent tenant-quality profile in this submarket — average credit score on applications, eviction rate, late-payment / NSF rate, and stable-employment percentage? A property-management company in the area should have these aggregated.
- How much new for-sale + rental construction is in the pipeline within 1–3 miles? Heavy new supply typically softens prices + rents 12–24 months out; constrained supply supports both.
Investment metrics
- 1% rule
- 1.98% ✓
- Cap rate
- 7.92%
- Cash-on-cash
- 5.82%
- DSCR
- 1.26
- GRM
- 4.2
CMA / ARV
No comps found within radius.
Projected returns pro-forma
-3.0% appreciation · 3.0% rent growth · sell at horizon
- IRR
- -6.8%
- Equity multiple
- 0.75×
- Total profit
- $-5,371
- Equity at exit
- $11,331
- IRR
- 3.4%
- Equity multiple
- 1.25×
- Total profit
- $5,282
- Equity at exit
- $6,571
Cash invested: $21,279 (down + closing). Projections, not guarantees.
Landlord ↔ Tenant lean methodology
- Overall (STATE)
- 90 Strongly Landlord-Friendly
- State Indiana
- 90 Strongly Landlord-Friendly · R+11
- County
- — inherits STATE
- City
- — inherits STATE
ZIP-level market 47172
- Active inventory
- 146
- Price-to-rent
- 4.2×
Monthly cashflow live
- Estimated rent
- $1,504 high interval (Pro) →
- Mortgage (P&I)
- −$399
- Tax est. 1.5%
- −$95 /mo · $1,140/yr
- Insurance
- −$32
- HOA
- −$560
- Vacancy / Maint / Mgmt
- −$316
- Net cashflow
- $103
Break-even live
UW: 25.0% down · 7.5% · 30yr · 1.5% tax · 5.0% vac · 8.0% maint · 8.0% mgmt
Financing live
Cash to close
- Down payment
- $18,999
- Closing costs
- $2,280
- Reserves months
- —
- Total cash needed
- —
Loan-product check · same deal, 3 products live
Conventional
25% down · 7.5% · 30yr
- Down + closing
- —
- Monthly P&I
- —
- Monthly cashflow
- —
- DSCR
- —
- Eligible?
- —
Personal DTI + credit; lowest rate.
DSCR
20% down · 8.5% · 30yr
- Down + closing
- —
- Monthly P&I
- —
- Monthly cashflow
- —
- DSCR
- —
- Eligible?
- —
No personal income docs; deal must DSCR.
Hard money
10% down · 12.0% · 12mo
- Down + closing
- —
- Monthly P&I
- —
- Monthly cashflow
- —
- DSCR
- —
- Eligible?
- —
Short-term bridge; refi at stabilization.
Rent comps 6 comps
| Address | Beds | Baths | Sqft | Rent | $/sqft | DOM | Units | Dist |
|---|---|---|---|---|---|---|---|---|
| 7000 Lake Dr Sellersburg, IN | 1.0–3.0 | 1.0–2.0 | 1004 | $1,369 | $1.36 | 1d | 1 | 0.57mi |
| 7722 Sellersburg, IN | 1.0–2.0 | 1.0–2.0 | 933 | $1,143 | $1.23 | 1d | 12 | 0.59mi |
| 7608 Julia Dr Sellersburg, IN | 3.0 | 2.0 | 1500 | $2,000 | $1.33 | 1d | 1 | 0.73mi |
| 1026 Sweet Amy Way Sellersburg, IN | 3.0 | 2.5 | 1288 | $1,850 | $1.44 | 43d | 1 | 1.02mi |
| 702 Somerset Ct Sellersburg, IN | 2.0 | 2.0 | 1192 | $1,095 | $0.92 | 1d | 1 | 1.11mi |
| 8500 Westmont Dr Sellersburg, IN | 2.0 | 2.0 | 1140 | $1,275 | $1.12 | 1d | 5 | 1.17mi |
HOA detail
- Monthly dues
- $560 · $6,720/yr
Listing history 14 events
-
2026-06-18days on market $75,995 Active 123 DOM
-
2026-06-17days on market $75,995 Active 122 DOM
-
2026-06-16days on market $75,995 Active 121 DOM
-
2026-06-15days on market $75,995 Active 120 DOM
-
2026-06-13days on market $75,995 Active 118 DOM
-
2026-06-10days on market $75,995 Active 115 DOM
-
2026-06-09days on market $75,995 Active 114 DOM
-
2026-06-08days on market $75,995 Active 113 DOM
-
2026-06-07days on market $75,995 Active 112 DOM
-
2026-06-03days on market $75,995 Active 108 DOM
-
2026-06-02days on market $75,995 Active 107 DOM
-
2026-06-01days on market $75,995 Active 106 DOM
-
2026-05-31days on market $75,995 Active 105 DOM
-
2026-02-16$75,995 Active 571-char remark
Show marketing remark (571 chars)
The Belmont offers a smart, spacious layout designed for comfortable everyday living. This thoughtfully designed home features 3 bedrooms and 2 full baths, providing plenty of room for family and guests. At the heart of the home, you'll find a beautiful, well-appointed kitchen that flows seamlessly into an expansive living area with extended length-perfect for entertaining, relaxing, or creating flexible spaces to fit your lifestyle. With its open design and generous proportions, the Belmont delivers both functionality and style in a home that truly feels inviting.
ⓘ Source: listings_history table (triggers on properties + properties_extension) + one-shot
backfill from property_details.listing_events for pre-trigger history.
Nearby sold comps map
Loading sold comps map…
Walkable amenities ~0.75 mi
Loading nearby amenities…
Taxation est. · year 1
- Rental income
- $18,052
- − Mortgage interest
- −$4,257
- − Property taxes
- −$1,140
- − Insurance
- −$380
- − Repairs & maintenance
- −$1,444
- − Management
- −$1,444
- − HOA
- −$6,720
- − Depreciation
- −$2,211
- Taxable income
- $456
- Est. tax owed @ 24.0%
- −$110
- After-tax cash flow
- $1,130/yr
For passive investors: Depreciation is non-cash, so a rental often shows a tax loss while cash-flowing — sheltering income. Rental losses are passive: they offset passive income freely, and up to $25,000/yr can offset ordinary (W-2) income if you actively participate and your MAGI is under $100k (phasing out to $0 by $150k); unused losses carry forward. On sale, claimed depreciation is recaptured at up to 25%, and gains may owe capital-gains tax (a 1031 exchange can defer both). Figures are a year-1 estimate at your 24.0% rate — not tax advice; consult a CPA.
Condition & rehab AI · 1 photo
This Belmont manufactured home is in excellent condition with no visible repairs or maintenance needed. It is move-in ready and offers a spacious layout perfect for comfortable everyday living.
Schools (NCES district)
No district data.
Livability — Sellersburg
- Score
- 73/100
- State rank
- #85
- US rank
- #5005
Category grades
Schools grade is shown separately in the Schools card above.
Census & demographics
- Census place
- Sellersburg, IN
- County
- Clark County · 108,879 people
- City population
- 21,045
- Metro
- Louisville/Jefferson County, KY-IN
- Population (ZIP)
- 21,045
- Household income
- $82,503
- Rent vs Own
- Severe rent burden
- 250.0
Population outlook (Clark County) Hauer SSP2
- Today (2025)
- 126,401 people
- By 2030
- 131,455 · +4.0%
- By 2040
- 140,471 · +11.1%
- By 2050
- 147,677 · +16.8%
- By 2075
- 161,702 · +27.9%
- By 2100
- 164,078 · +29.8%
Race, ethnicity, and origin ACS 2023
- Neighborhood character
- Predominantly White (90%)
- Race & ethnicity
- White 90% Two or more races 7% Hispanic / Latino 3% Asian 2%
- Common ancestry
- Romanian 2% Slovak 2% Italian 2%
- Foreign-born
- 3% · Canada
- Languages at home
- 96% English-only · Spanish 2% Vietnamese 1% Other Indo-European 1%
Political lean MEDSL · Clark
- 2024 margin
- Strong R (+20.4) · D 38.9% · R 59.3% · Other 1.8%
- 2008→2024 swing
- -13.3pp toward R · 2008: -7.1pp · 2024: -20.4pp
- All cycles
- 2024: R+20.4 2020: R+18.3 2016: R+22.0 2012: R+9.9 2008: R+7.1
Not yet ingested
- Civics
- —
Market trends
- HPI YoY
- ▼ -114.50%
- Current HPI
- 173.6209
- Rent YoY
- —
- Metro
- Louisville/Jefferson County, KY-IN
- State GDP YoY
- ▲ 2.90%
- F500 in state
- 18
Industry mix (Fortune 500 HQ in IN)
| Industry | F500 HQs | Revenue |
|---|---|---|
| Industrial Machinery | 2 | $37B |
|
||
| Healthcare | 1 | $177B |
|
||
| Pharmaceuticals | 1 | $45B |
|
||
| Metals / Steel | 1 | $18B |
|
||
| Agriculture | 1 | $17B |
|
||
| Packaging | 1 | $12B |
|
||
Price history
1 event — show timeline
- 2026-02-16 Listed $75,995 Zillow
Cash-flow waterfall
monthlySold comps — $/sqft
last 12 mo · ≤1 miLoading sold comps…