 Multi-family
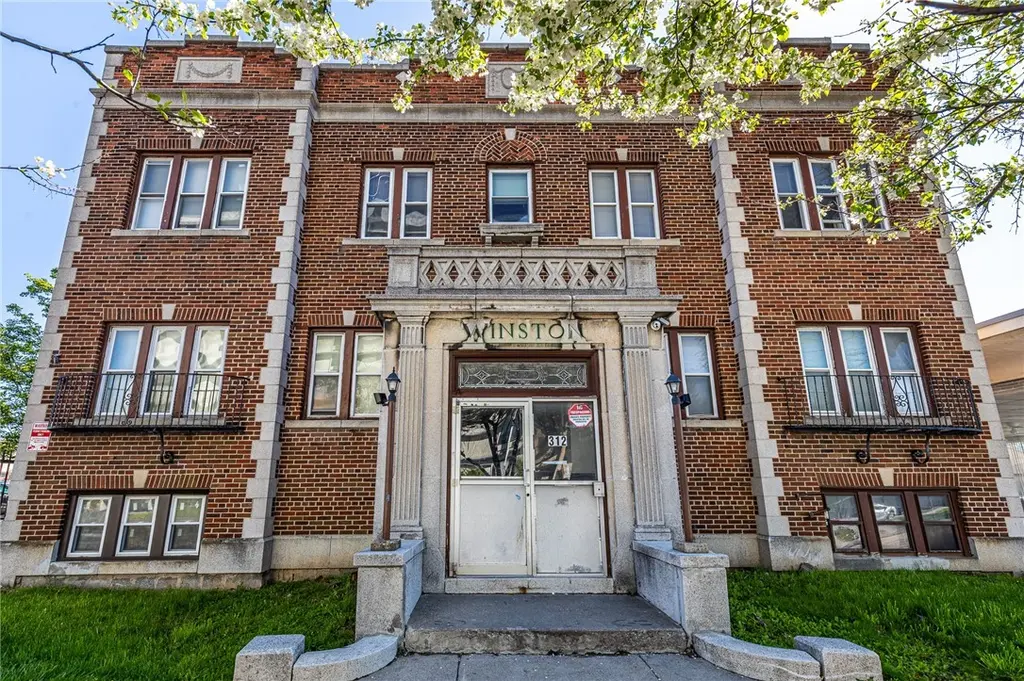
312 Lake Ave · Rochester, NY
Flood risk 4/10 · Minor
- FEMA flood zone
- X (unshaded)
- Chance of flooding over 30 yrs
- 0.2%
- Est. flood insurance / yr
- $473 – $860
Fire risk 1/10 · Minimal
- Est. fire insurance / yr
- $691 – $1,283
Heat risk 2/10 · Minimal
- Hot days now (above 95°F)
- 7 days/yr
- Hot days in 30 yrs
- 15 days/yr
Wind risk 1/10 · Minimal
- Chance of severe wind over 30 yrs
- —
Air-quality risk 2/10 · Minimal
- Unhealthy air days now
- 1 days/yr
- Unhealthy air days in 30 yrs
- 2 days/yr
Risk factors via First Street. Map © Google.
Why this score? — see what drove the C+ grade
The composite is a weighted blend of 9 inputs, each scored 0–100. Each bar is that input's sub-score; the figure is the points it added to the 100-point composite (weight × sub-score).
- Cash flow +28.4/30.0
- DSCR +10.0/10.0
- Appreciation +6.8/10.0
- 1% rule +6.7/10.0
- Rent growth +4.2/5.0
- Livability +3.8/5.0
- Condition / age +2.5/5.0
- Schools +1.9/10.0
- ARV discount +0.0/15.0
$1,900,000
🖨 Deal sheet (PDF) 📄 Offer letter ✓ Due diligence
Multi-family units
County records classify this as Multi-Family (5+ Unit). Listing-text estimate: 1 unit. estimate disagrees with records
5+ unit building — per-unit beds/baths from public records are typically unavailable; the breakdown below (if shown) is an estimate from the listing text.
Listing remarks
Another Rockin' Rochester Property! Annual Gross Income of $288,552! Solid brick building with new C of O at closing! 16 studios, 9 one bdrms. This is a solid brick building in great shape with all units rehabbed, 122 new replacement windows, energy efficient lighting and boiler controls. torch down roof, off street parking. Do NOT walk property without an appointment. Edgerton offers a variety of housing options, including duplexes, townhouses, single detached homes, and large apartment buildings. The neighborhood features an abundance of green spaces like Edgerton Park, providing peaceful and accessible spots for outdoor activities. A number of supermarkets, restaurants, and coffee shops
Key facts
- Off street parking
- Boiler controls
- Solid brick building
Tags
Property features AI
Finance
- Other: Owner pays: other (see remarks); Rent includes: see remarks
- Financial info: 25 total units; 26 separate gas meters; 26 separate electric meters; Operating expenses include insurance, maintenance, utilities, and water/sewer
Exterior
- Parking: Driveway parking; Three or more parking spaces; No garage
- Utilities: Cable available; Public water (connected); Sewer connected; Circuit breaker electric
- Home design: 2-story building; Resale property
- Construction: Brick construction; Copper and PEX plumbing; Existing (previously built)
- Exterior features: Blacktop driveway; Near public transit; Rectangular residential lot; City street frontage
Interior
- Kitchen: Refrigerator; Gas water heater
- Flooring: Hardwood; Luxury vinyl; Varies by unit
- Heating & cooling: Gas heating; Steam heating
- Interior features: Thermal windows; Partially finished full basement with walk-out access
Neighborhood map
What this means for you Summary
Snapshot
- This is a 9-bed/?-bath multifamily listed at $1.90M.
Deal economics
- At list price, monthly cash flow is $6k ($74k/yr) — positive.
- The deal already cash-flows at list — no discount required.
- Meets the 1% rule at list price ($22k rent vs $1.90M).
- Recommended offer: $1.84M (3.0% below list) — sets the bar for market timing.
Location & tenants
- Location reads 76/100 on livability (#222 in NY, #3,482 nationally) — a middle-class / working-renter tenant base. Strengths: commute A+, cost of living A+, housing A+; Watch: crime F, employment F.
- Rochester City School District (urban): math 21% / reading 26% proficiency, ranked #589 of 590 in NY (top 100%) — low school quality limits family demand, transient renter base, plan for 1-2y turnover; 82% free/reduced lunch — lower-income household profile, screen leases tightly.
- Zoned schools: School 5-John Williams (math 2% / reading 8%, grade F, #2,098 of 2,108 statewide, top 100%, 596 students, 93% FRL); East Lower School (math 2% / reading 22%, grade F, #715 of 729 statewide, top 98%, 304 students, 86% FRL); Edison Career And Technology High School (math 44% / reading 50%, grade D-, #1,007 of 1,100 statewide, top 93%, 1,233 students, 91% FRL).
- Market conditions: Rents rising fast (+6.6%/yr); 51 active listings in the ZIP; lower-income renter base — watch delinquency; 1,169 units permitted in Monroe County in 2024 (591 in 5+ unit buildings).
- At $22,206/mo this rent would consume 656% of the median local household income ($41k/yr) (locally 1300% of renters already pay >50% of income on rent) — very limited rent-growth headroom before tenants either downsize or default.
Forward outlook
- In year one you build about $83k of equity ($13k loan paydown + $70k appreciation (3.7% local appreciation)).
- Monroe County population projected to shrink 6% by 2050 — rents likely to lag national; underwrite the cash flow, not the appreciation.
- At projected returns (3.7% appreciation + 6.6% rent growth), your $532k cash investment doubles in ~4 years — after that, you're playing with house money.
- By year 2, paydown + projected appreciation supports a ~$134k cash-out refi (75% LTV) — recoverable capital for the next deal without selling this one.
Negotiation context
- It's been on market 39 days — a 3% lower offer ($1.84M) is reasonable based on typical stale-listing flexibility.
- Current owner paid $225k; list at $1.90M implies a 744% gain — meaningful room to come down on a strong offer.
Risks & watch-outs
- Watch-outs: built in 1920 — expect roof / HVAC / electrical / plumbing capex.
Questions for the listing agent
- It's been on market 39 days. Have you received any prior offers? Is the seller open to a 3% concession, seller financing, or rate buy-down credit?
- Built in 1920 — when were the roof, HVAC, electrical panel, plumbing, and water heater last replaced?
- Is there a deadline driving the sale (1031 exchange, divorce, estate, relocation)? That informs how much negotiation room exists.
- Schools are D-rated, which usually means shorter tenancies and higher turnover. Who's the typical renter profile here, and what's been the actual vacancy rate?
- Crime grade is F in this area — have there been break-ins, vandalism, or insurance claims at this property in the last 3 years? What carrier currently insures it and at what premium?
- What's the average days-on-market for RENTAL listings here right now (not sales)? A rising rental-DOM trend means longer vacancies and softer asking-rent achievability than the comps imply.
- What's the recent tenant-quality profile in this submarket — average credit score on applications, eviction rate, late-payment / NSF rate, and stable-employment percentage? A property-management company in the area should have these aggregated.
- How much new apartment / multifamily construction is in the pipeline within 1–3 miles? Heavy new supply (>2% of stock underway) typically softens rents 12–24 months out; light construction supports rent growth.
Investment metrics
- 1% rule
- 1.17% ✓
- Cap rate
- 10.18%
- Cash-on-cash
- 13.87%
- DSCR
- 1.62
- GRM
- 7.1
CMA / ARV
- ARV (median comp)
- $1,343,248
- List price
- $1,900,000
- Delta
- 41.45%
- Verdict
- OVERPRICED
- Comps
- 6 within 2.0 mi
Projected returns pro-forma
3.69% appreciation · 6.61% rent growth · sell at horizon
- IRR
- 24.2%
- Equity multiple
- 2.45×
- Total profit
- $773,828
- Equity at exit
- $929,204
- IRR
- 26.1%
- Equity multiple
- 5.26×
- Total profit
- $2,265,158
- Equity at exit
- $1,493,181
Cash invested: $532,000 (down + closing). Projections, not guarantees.
Landlord ↔ Tenant lean methodology
- Overall (STATE)
- 15 Strongly Tenant-Friendly
- State New York
- 15 Strongly Tenant-Friendly · D+10
- County
- — inherits STATE
- City
- — inherits STATE
ZIP-level market 14608
- Home prices YoY
- 1.3%
- Rents YoY
- 6.6%
- Active inventory
- 51
- Price-to-rent
- 114.1×
Monthly cashflow live
- Estimated rent
- $22,206 high interval (Pro) →
- Mortgage (P&I)
- −$9,964
- Tax from tax record
- −$637 /mo · $7,644/yr
- Insurance
- −$792
- HOA
- −$0
- Vacancy / Maint / Mgmt
- −$4,663
- Net cashflow
- $6,150
Break-even live
Sensitivity live
| Price | -10% $7,226 | -5% $6,688 | +0% $6,150 | +5% $5,612 | +10% $5,075 |
|---|---|---|---|---|---|
| Rent | -10% $4,396 | -5% $5,273 | +0% $6,150 | +5% $7,027 | +10% $7,905 |
| Rate | -1.0pp $7,107 | -0.5pp $6,633 | base $6,150 | +0.5pp $5,658 | +1.0pp $5,157 |
16-unit breakdown (identical units grouped — click to expand)
| Units | Beds | Baths | Est. rent |
|---|---|---|---|
| 16× units | 1 | 1 | $22,208 |
| #1 | 1 | 1 | $1,388 |
| #2 | 1 | 1 | $1,388 |
| #3 | 1 | 1 | $1,388 |
| #4 | 1 | 1 | $1,388 |
| #5 | 1 | 1 | $1,388 |
| #6 | 1 | 1 | $1,388 |
| #7 | 1 | 1 | $1,388 |
| #8 | 1 | 1 | $1,388 |
| #9 | 1 | 1 | $1,388 |
| #10 | 1 | 1 | $1,388 |
| #11 | 1 | 1 | $1,388 |
| #12 | 1 | 1 | $1,388 |
| #13 | 1 | 1 | $1,388 |
| #14 | 1 | 1 | $1,388 |
| #15 | 1 | 1 | $1,388 |
| #16 | 1 | 1 | $1,388 |
| Total (16 units) | $22,206 | ||
UW: 25.0% down · 7.5% · 30yr · 1.5% tax · 5.0% vac · 8.0% maint · 8.0% mgmt
Financing live
Cash to close
- Down payment
- $475,000
- Closing costs
- $57,000
- Reserves months
- —
- Total cash needed
- —
Loan-product check · same deal, 3 products live
Conventional
25% down · 7.5% · 30yr
- Down + closing
- —
- Monthly P&I
- —
- Monthly cashflow
- —
- DSCR
- —
- Eligible?
- —
Personal DTI + credit; lowest rate.
DSCR
20% down · 8.5% · 30yr
- Down + closing
- —
- Monthly P&I
- —
- Monthly cashflow
- —
- DSCR
- —
- Eligible?
- —
No personal income docs; deal must DSCR.
Hard money
10% down · 12.0% · 12mo
- Down + closing
- —
- Monthly P&I
- —
- Monthly cashflow
- —
- DSCR
- —
- Eligible?
- —
Short-term bridge; refi at stabilization.
Listing history 19 events
-
2026-06-21days on market $1,900,000 Active 39 DOM
-
2026-06-18days on market $1,900,000 Active 36 DOM
-
2026-06-17days on market $1,900,000 Active 35 DOM
-
2026-06-16days on market $1,900,000 Active 34 DOM
-
2026-06-15days on market $1,900,000 Active 33 DOM
-
2026-06-13days on market $1,900,000 Active 31 DOM
-
2026-06-13days on market $1,900,000 Active 30 DOM
-
2026-06-10days on market $1,900,000 Active 28 DOM
-
2026-06-09days on market $1,900,000 Active 27 DOM
-
2026-06-09days on market $1,900,000 Active 26 DOM
-
2026-06-07days on market $1,900,000 Active 25 DOM
-
2026-06-05days on market $1,900,000 Active 22 DOM
-
2026-06-03days on market $1,900,000 Active 21 DOM
-
2026-06-03days on market $1,900,000 Active 20 DOM
-
2026-06-01days on market $1,900,000 Active 19 DOM
-
2026-05-31days on market $1,900,000 Active 18 DOM
-
2026-05-13$1,900,000 Active 744-char remark
-
2001-12-28soldstatus $225,000
-
1998-04-15soldstatus $300,000
ⓘ Source: listings_history table (triggers on properties + properties_extension) + one-shot
backfill from property_details.listing_events for pre-trigger history.
Tax reassessment forecast NY · Partial reset (capped growth)
- Current annual tax
- $7,644 · $637/mo
- Projected year-2 tax
- $19,877 · $1,656/mo
- Expected delta
- +$12,233/yr (+$1,019/mo · 160.0%)
ⓘ Screening estimate from a state-policy table — verify with the county assessor before closing.
Climate risk First Street
- Flood 4/10 Moderate FEMA zone X (unshaded) · 20% chance over 30 yrs
- Wildfire 1/10 Low
- Heat 2/10 Low 7 d/yr ≥95°F today · 15 d/yr by 30 yrs out
- Wind 1/10 Low
- Air quality 2/10 Low 1 unhealthy d/yr today · 2 by 30 yrs out
Nearby sold comps map
Loading sold comps map…
Walkable amenities ~0.75 mi
Loading nearby amenities…
Taxation est. · year 1
- Rental income
- $266,472
- − Mortgage interest
- −$106,430
- − Property taxes
- −$7,644
- − Insurance
- −$9,500
- − Repairs & maintenance
- −$21,318
- − Management
- −$21,318
- − Depreciation
- −$55,273
- Taxable income
- $44,990
- Est. tax owed @ 24.0%
- −$10,798
- After-tax cash flow
- $63,005/yr
For passive investors: Depreciation is non-cash, so a rental often shows a tax loss while cash-flowing — sheltering income. Rental losses are passive: they offset passive income freely, and up to $25,000/yr can offset ordinary (W-2) income if you actively participate and your MAGI is under $100k (phasing out to $0 by $150k); unused losses carry forward. On sale, claimed depreciation is recaptured at up to 25%, and gains may owe capital-gains tax (a 1031 exchange can defer both). Figures are a year-1 estimate at your 24.0% rate — not tax advice; consult a CPA.
Schools (NCES district)
- District
- Rochester City School District
- NCES district ID
- 3624750
- Math proficiency
- 21% ▬ 0.00%
- Reading proficiency
- 26% ▲ 4.00%
- Median HH income
- $30,923
- Composite
- 18.98/100
- National rank
- #8850
- State rank
- #589 of 590 in NY
Livability — Rochester
- Score
- 76/100
- State rank
- #222
- US rank
- #3482
Category grades
Schools grade is shown separately in the Schools card above.
Census & demographics
- Census place
- Rochester, NY
- County
- Monroe County · 674,131 people
- City population
- 432,803
- Metro
- Rochester, NY
- Population (ZIP)
- 12,792
- Household income
- $40,646
- Rent vs Own
- Severe rent burden
- 1300.0
Population outlook (Monroe County) Hauer SSP2
- Today (2025)
- 759,460 people
- By 2030
- 757,154 · -0.3%
- By 2040
- 740,644 · -2.5%
- By 2050
- 714,443 · -5.9%
- By 2075
- 645,883 · -15.0%
- By 2100
- 547,084 · -28.0%
Race, ethnicity, and origin ACS 2023
- Neighborhood character
- Diverse neighborhood (Simpson 0.67)
- Race & ethnicity
- Black 50% White 25% Two or more races 13% Hispanic / Latino 12% Asian 4%
- Hispanic origin (detail)
- Puerto Rican 10%
- Common ancestry
- Lithuanian 1% Romanian 1% Iranian 1%
- Foreign-born
- 8% · Canada, India
- Languages at home
- 85% English-only · Spanish 8% Other Indo-European 3% French/Haitian/Cajun 1%
Political lean MEDSL · Monroe
- 2024 margin
- D (+19.1) · D 59.5% · R 40.5%
- 2008→2024 swing
- +1.4pp toward D · 2008: 17.7pp · 2024: 19.1pp
- All cycles
- 2024: D+19.1 2020: D+21.0 2016: D+14.1 2012: D+17.4 2008: D+17.7
Not yet ingested
- Civics
- —
Market trends
- HPI YoY
- ▲ 3.69%
- Current HPI
- 280.2411
- Rent YoY
- ▲ 6.61%
- Metro
- Rochester, NY
- State GDP YoY
- ▲ 2.60%
- F500 in state
- 92
Industry mix (Fortune 500 HQ in NY)
| Industry | F500 HQs | Revenue |
|---|---|---|
| Financial Services | 10 | $950B |
|
||
| Consumer Goods | 9 | $162B |
|
||
| Insurance | 4 | $225B |
|
||
| Telecommunications | 2 | $144B |
|
||
| Pharmaceuticals | 2 | $112B |
|
||
| Media / Entertainment | 2 | $69B |
|
||
Price history
+533.3% since first listed3 events — show timeline
- 2026-05-13 Listed $1,900,000 UNYREIS
- 2001-12-28 Sold (Public Records) $225,000 Public Records
- 1998-04-15 Sold (Public Records) $300,000 Public Records
Property tax history
+1.1%/yrLatest (2025): $7,644 · -3.4% YoY. Source: county tax records.
Cash-flow waterfall
monthlySold comps — $/sqft
last 12 mo · ≤1 miLoading sold comps…