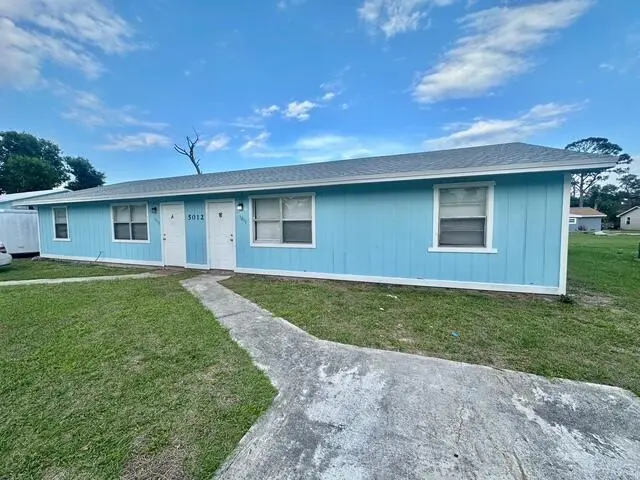
 Duplex
5012 Killarney Ave · Lakewood Park, FL
Flood risk 1/10 · Minimal
- FEMA flood zone
- X (unshaded)
- Chance of flooding over 30 yrs
- 0.0%
- Est. flood insurance / yr
- $507 – $1,088
Fire risk 2/10 · Minimal
- Est. fire insurance / yr
- $947 – $1,759
Heat risk 10/10 · Severe
- Hot days now (above 107°F)
- 7 days/yr
- Hot days in 30 yrs
- 26 days/yr
Wind risk 10/10 · Severe
- Chance of severe wind over 30 yrs
- 99.0%
Air-quality risk 1/10 · Minimal
- Unhealthy air days now
- 0 days/yr
- Unhealthy air days in 30 yrs
- 0 days/yr
Risk factors via First Street. Map © Google.
Why this score? — see what drove the C- grade
The composite is a weighted blend of 9 inputs, each scored 0–100. Each bar is that input's sub-score; the figure is the points it added to the 100-point composite (weight × sub-score).
- Cash flow +20.2/30.0
- ARV discount +7.5/15.0
- DSCR +6.4/10.0
- 1% rule +5.4/10.0
- Schools +3.7/10.0
- Livability +3.2/5.0
- Rent growth +2.5/5.0
- Condition / age +2.5/5.0
- Appreciation +0.0/10.0
$349,000
🖨 Deal sheet 📄 Offer letter ✓ Due diligence
Multi-family units
County records classify this as Multi-Family (2-4 Unit). Listing-text estimate: 2 units. confirmed
Listing remarks MLS
2/1 duplex each side. Tenants on a monthly lease. Well and septic, separate meters. Roof 2005. Rents are below market.
Key facts
- Newer roof
- Centrally located
- Large yard
Tags
Property features AI
Finance
- Financial info: Two total units; Tenants pay cable TV, electricity, sewer and water; Pets allowed with no restrictions
Exterior
- Utilities: Well water; Septic tank; Electricity available; Sewer available; Water connected; Two separate electric meters; Two separate gas meters; Two separate water meters
- Home design: Duplex; One level; Resale condition
- Construction: Frame construction; Shingle roof; Brick/mortar and concrete perimeter foundation; Built as a 2-unit building
- Exterior features: Outbuilding, shed(s) and storage; Not waterfront
Interior
- Flooring: Carpet; Linoleum; Tile
- Heating & cooling: Central heating; Central electric air conditioning
- Interior features: Carpet, linoleum and tile flooring
Neighborhood map
What this means for you Summary
Snapshot
- This is a 2 × 2-bed/1.0-bath units multifamily listed at $349k.
Deal economics
- At list price, monthly cash flow is $438 ($5k/yr) — positive. Per door: $219/mo.
- The deal already cash-flows at list — no discount required.
- Meets the 1% rule at list price ($4k rent vs $349k).
- Recommended offer: $339k (3.0% below list) — sets the bar for market timing.
- Cap rate 7.8% vs local median 5.7% in Lakewood Park — top-decile yield for the area; either an underpriced asset or a hidden risk that comps aren't pricing in. Stress-test before assuming the spread holds.
Location & tenants
- Location reads 63/100 on livability (#719 in FL) — a middle-class / working-renter tenant base. Strengths: cost of living A+, housing A+; Watch: schools F, amenities F, commute F.
- St. Lucie (urban): math 40% / reading 48% proficiency, ranked #51 of 73 in FL (top 70%) — families likely to look elsewhere, expect single-tenant / working-renter base with shorter leases.
- Market conditions: 292 active listings in the ZIP; 10 comparable units currently listed for rent nearby; rentals at typical pace (median 21d on market — plan ~3-4 weeks tenant-placement turnaround); 4,868 units permitted in St. Lucie County in 2024 (268 in 5+ unit buildings).
- At $3,632/mo this rent would consume 69% of the median local household income ($63k/yr) (locally 140% of renters already pay >50% of income on rent) — very limited rent-growth headroom before tenants either downsize or default.
Forward outlook
- Local home prices are declining (-3.0%/yr); year-one equity from $2k of loan paydown is wiped out by about $10k of value loss. Plan a longer hold.
- St. Lucie County population projected at +20% by 2050 — long-run rental-demand tailwind backs the buy-and-hold thesis.
Negotiation context
- It's been on market 53 days — a 3% lower offer ($339k) is reasonable based on typical stale-listing flexibility.
- 5 sale attempts since 20y ago; this cycle's ask has dropped $20k (5%) from the opening price — seller is motivated, your offer sets the floor, not the list.
- Current owner paid $298k; 17% above their basis — modest negotiation headroom, anchor on the comps not their cost.
Risks & watch-outs
- Climate carrying-cost: severe wind risk, 99% chance of damaging wind over 30y; extreme-heat days projected 7→26/yr by 2055 (HVAC capex compounding) — expect insurance premiums to compound above CPI over the hold.
Questions for the listing agent
- It's been on market 53 days. Have you received any prior offers? Is the seller open to a 3% concession, seller financing, or rate buy-down credit?
- Can we see the unit-by-unit rent roll, current vacancy, and any below-market leases? What's the average tenancy length?
- What capital expenditures (roof, boiler, parking lot, exteriors) have been made in the last 5 years, and what's planned in the next 2?
- Built in 1979 — when were the roof, HVAC, electrical panel, plumbing, and water heater last replaced?
- Is there a deadline driving the sale (1031 exchange, divorce, estate, relocation)? That informs how much negotiation room exists.
- Schools are F-rated, which usually means shorter tenancies and higher turnover. Who's the typical renter profile here, and what's been the actual vacancy rate?
- What's the average days-on-market for RENTAL listings here right now (not sales)? A rising rental-DOM trend means longer vacancies and softer asking-rent achievability than the comps imply.
- What's the recent tenant-quality profile in this submarket — average credit score on applications, eviction rate, late-payment / NSF rate, and stable-employment percentage? A property-management company in the area should have these aggregated.
- How much new apartment / multifamily construction is in the pipeline within 1–3 miles? Heavy new supply (>2% of stock underway) typically softens rents 12–24 months out; light construction supports rent growth.
Investment metrics
- 1% rule
- 1.04% ✓
- Cap rate
- 7.80%
- Cash-on-cash
- 5.38%
- DSCR
- 1.24
- GRM
- 8.0
CMA / ARV
No comps found within radius.
Projected returns pro-forma
-3.0% appreciation · 3.0% rent growth · sell at horizon
- IRR
- -7.9%
- Equity multiple
- 0.71×
- Total profit
- $-28,596
- Equity at exit
- $52,037
- IRR
- 1.6%
- Equity multiple
- 1.12×
- Total profit
- $11,283
- Equity at exit
- $30,175
Cash invested: $97,720 (down + closing). Projections, not guarantees.
Landlord ↔ Tenant lean methodology
- Overall (STATE)
- 87 Strongly Landlord-Friendly
- State Florida
- 87 Strongly Landlord-Friendly · R+3
- County
- — inherits STATE
- City
- — inherits STATE
ZIP-level market 34951
- Home prices YoY
- -23.6%
- Active inventory
- 292
- Price-to-rent
- 16.0×
Monthly cashflow live
- Estimated rent
- $3,632 medium interval (Pro) →
- Mortgage (P&I)
- −$1,830
- Tax from tax record
- −$456 /mo · $5,469/yr
- Insurance
- −$145
- HOA
- −$0
- Vacancy / Maint / Mgmt
- −$763
- Net cashflow
- $438
Break-even live
2-unit breakdown (identical units grouped — click to expand)
| Units | Beds | Baths | Est. rent |
|---|---|---|---|
| 2× units | 2 | 1 | $3,632 |
| #1 | 2 | 1 | $1,816 |
| #2 | 2 | 1 | $1,816 |
| Total (2 units) | $3,632 | ||
UW: 25.0% down · 7.5% · 30yr · 1.5% tax · 5.0% vac · 8.0% maint · 8.0% mgmt
Financing live
Cash to close
- Down payment
- $87,250
- Closing costs
- $10,470
- Reserves months
- —
- Total cash needed
- —
Loan-product check · same deal, 3 products live
Conventional
25% down · 7.5% · 30yr
- Down + closing
- —
- Monthly P&I
- —
- Monthly cashflow
- —
- DSCR
- —
- Eligible?
- —
Personal DTI + credit; lowest rate.
DSCR
20% down · 8.5% · 30yr
- Down + closing
- —
- Monthly P&I
- —
- Monthly cashflow
- —
- DSCR
- —
- Eligible?
- —
No personal income docs; deal must DSCR.
Hard money
10% down · 12.0% · 12mo
- Down + closing
- —
- Monthly P&I
- —
- Monthly cashflow
- —
- DSCR
- —
- Eligible?
- —
Short-term bridge; refi at stabilization.
Rent comps 10 comps
| Address | Beds | Baths | Sqft | Rent | $/sqft | DOM | Units | Dist |
|---|---|---|---|---|---|---|---|---|
| 5010 Killarney Ave Unit A Fort Pierce, FL | 2.0 | 1.0 | 1720 | $1,500 | $0.87 | 23d | 1 | 0.01mi |
| 6602 Palomar Pkwy Unit A Fort Pierce, FL | 3.0 | 1.0 | 1200 | $2,000 | $1.67 | 23d | 1 | 0.07mi |
| 5234 Oakland Lake Cir Fort Pierce, FL | 3.0 | 2.0 | 1460 | $2,300 | $1.58 | 13d | 1 | 0.51mi |
| 5510 Shannon Dr Fort Pierce, FL | 3.0 | 2.0 | 1594 | $2,350 | $1.47 | 13d | 1 | 0.61mi |
| 5082 Armina Pl Fort Pierce, FL | 3.0 | 2.0 | 1464 | $3,000 | $2.05 | 23d | 1 | 1.10mi |
| 5154 Armina Pl Fort Pierce, FL | 3.0 | 2.0 | 1477 | $2,350 | $1.59 | 13d | 1 | 1.14mi |
| 7704 Pacific Ave Fort Pierce, FL | 3.0 | 2.0 | 1719 | $2,500 | $1.45 | 13d | 1 | 1.19mi |
| 5642 Sunberry Cir Fort Pierce, FL | 3.0 | 2.0 | 1377 | $1,950 | $1.42 | 23d | 1 | 1.19mi |
| 7403 Winter Garden Pkwy Fort Pierce, FL | 3.0 | 2.0 | 1372 | $2,200 | $1.60 | 21d | 1 | 1.21mi |
| 6906 Ocala Ave Fort Pierce, FL | 3.0 | 2.0 | 1175 | $1,955 | $1.66 | 13d | 1 | 1.33mi |
Listing history 16 events
-
2026-05-24status Pending
-
2026-04-30price $349,000
-
2026-04-15price $359,000
-
2026-04-01$369,000 Active
-
2023-05-22soldstatus $298,286
-
2023-05-19soldstatus $298,400 118-char remark
Show marketing remark (118 chars)
2/1 duplex each side. Tenants on a monthly lease. Well and septic, separate meters. Roof 2005. Rents are below market.
-
2023-05-16$300,000 118-char remark
Show marketing remark (118 chars)
2/1 duplex each side. Tenants on a monthly lease. Well and septic, separate meters. Roof 2005. Rents are below market.
-
2018-06-26historical
-
2018-06-26historical
-
2010-11-01soldstatus $33,000
-
2010-10-29soldstatus $33,000
-
2010-10-24historical
-
2010-10-09$35,000
-
2007-12-07$109,000
-
2006-12-19$159,000
-
1999-02-26soldstatus $23,100
ⓘ Source: listings_history table (triggers on properties + properties_extension) + one-shot
backfill from property_details.listing_events for pre-trigger history.
Tax reassessment forecast FL · Resets to sale price
- Current annual tax
- $5,469 · $456/mo
- Projected year-2 tax
- $5,469 · $456/mo
- Expected delta
- $0/yr ($0/mo · 0.0%)
ⓘ Screening estimate from a state-policy table — verify with the county assessor before closing.
Climate risk First Street
- Flood 1/10 Low FEMA zone X (unshaded) · 0% chance over 30 yrs
- Wildfire 2/10 Low
- Heat 10/10 Extreme 7 d/yr ≥107°F today · 26 d/yr by 30 yrs out
- Wind 10/10 Extreme 99% chance of damaging wind over 30 yrs
- Air quality 1/10 Low 0 unhealthy d/yr today · 0 by 30 yrs out
Nearby sold comps map
Loading sold comps map…
Walkable amenities ~0.75 mi
Loading nearby amenities…
Taxation est. · year 1
- Rental income
- $43,584
- − Mortgage interest
- −$19,549
- − Property taxes
- −$5,469
- − Insurance
- −$1,745
- − Repairs & maintenance
- −$3,487
- − Management
- −$3,487
- − Depreciation
- −$10,153
- Taxable loss
- −$306
- Est. tax savings @ 24.0%
- +$73
- After-tax cash flow
- $5,328/yr
For passive investors: Depreciation is non-cash, so a rental often shows a tax loss while cash-flowing — sheltering income. Rental losses are passive: they offset passive income freely, and up to $25,000/yr can offset ordinary (W-2) income if you actively participate and your MAGI is under $100k (phasing out to $0 by $150k); unused losses carry forward. On sale, claimed depreciation is recaptured at up to 25%, and gains may owe capital-gains tax (a 1031 exchange can defer both). Figures are a year-1 estimate at your 24.0% rate — not tax advice; consult a CPA.
Schools (NCES district)
- District
- St. Lucie
- NCES district ID
- 1201770
- Math proficiency
- 40% ▼ -11.00%
- Reading proficiency
- 48% ▼ -4.00%
- Median HH income
- $44,737
- Composite
- 37.28/100
- National rank
- #4449
- State rank
- #51 of 73 in FL
Livability — Lakewood Park
- Score
- 63/100
- State rank
- #719
- US rank
- #15407
Category grades
Schools grade is shown separately in the Schools card above.
Census & demographics
- Census place
- Lakewood Park, FL
- County
- Saint Lucie County · 337,150 people
- Metro
- Port St. Lucie, FL
- Population (ZIP)
- 17,148
- Household income
- $63,122
- Rent vs Own
- Severe rent burden
- 140.0
Population outlook (St. Lucie County) Hauer SSP2
- Today (2025)
- 338,016 people
- By 2030
- 355,687 · +5.2%
- By 2040
- 385,521 · +14.1%
- By 2050
- 406,106 · +20.1%
- By 2075
- 441,054 · +30.5%
- By 2100
- 436,885 · +29.2%
Race, ethnicity, and origin ACS 2023
- Neighborhood character
- Predominantly White (74%)
- Race & ethnicity
- White 74% Black 13% Hispanic / Latino 8% Two or more races 7% Asian 2%
- Hispanic origin (detail)
- Mexican 2% Puerto Rican 2% Cuban 2%
- Common ancestry
- Romanian 3% Italian 2% Lithuanian 2%
- Foreign-born
- 10% · Canada, Jamaica, Vietnam
- Languages at home
- 88% English-only · Spanish 7% French/Haitian/Cajun 3% Vietnamese 1%
Political lean MEDSL · St. Lucie
- 2024 margin
- Lean R (+9.1) · D 45.1% · R 54.2%
- 2008→2024 swing
- -21.2pp toward R · 2008: 12.1pp · 2024: -9.1pp
- All cycles
- 2024: R+9.1 2020: R+1.6 2016: R+2.5 2012: D+7.9 2008: D+12.1
Not yet ingested
- Civics
- —
Market trends
- HPI YoY
- ▼ -106.06%
- Current HPI
- 343.1376
- Rent YoY
- —
- Metro
- Port St. Lucie, FL
- State GDP YoY
- ▲ 3.28%
- F500 in state
- 36
Industry mix (Fortune 500 HQ in FL)
| Industry | F500 HQs | Revenue |
|---|---|---|
| Industrial Technology | 2 | $29B |
|
||
| Insurance | 2 | $17B |
|
||
| Retail | 1 | $60B |
|
||
| Technology Distribution | 1 | $58B |
|
||
| Homebuilding | 1 | $35B |
|
||
| Technology Manufacturing | 1 | $35B |
|
||
Price history
+1410.8% since first listed16 events — show timeline
- 2026-05-24 Pending — Beaches MLS
- 2026-04-30 Price Changed $349,000 Beaches MLS
- 2026-04-15 Price Changed $359,000 Beaches MLS
- 2026-04-01 Listed $369,000 Beaches MLS
- 2023-05-22 Sold (Public Records) $298,286 Public Records
- 2023-05-19 Sold (MLS) $298,400 Beaches MLS
- 2023-05-16 Listed $300,000 Beaches MLS
- 2018-06-26 Listing Removed — Beaches MLS
- 2018-06-26 Listing Removed — Beaches MLS
- 2010-11-01 Sold (Public Records) $33,000 Public Records
- 2010-10-29 Sold (MLS) $33,000 Beaches MLS
- 2010-10-24 Listing Removed — Beaches MLS
- 2010-10-09 Listed $35,000 Beaches MLS
- 2007-12-07 Listed $109,000 Beaches MLS
- 2006-12-19 Listed $159,000 Beaches MLS
- 1999-02-26 Sold (Public Records) $23,100 Public Records
Property tax history
+15.5%/yrLatest (2025): $5,469 · +7.7% YoY. Source: county tax records.
Cash-flow waterfall
monthlySold comps — $/sqft
last 12 mo · ≤1 miLoading sold comps…