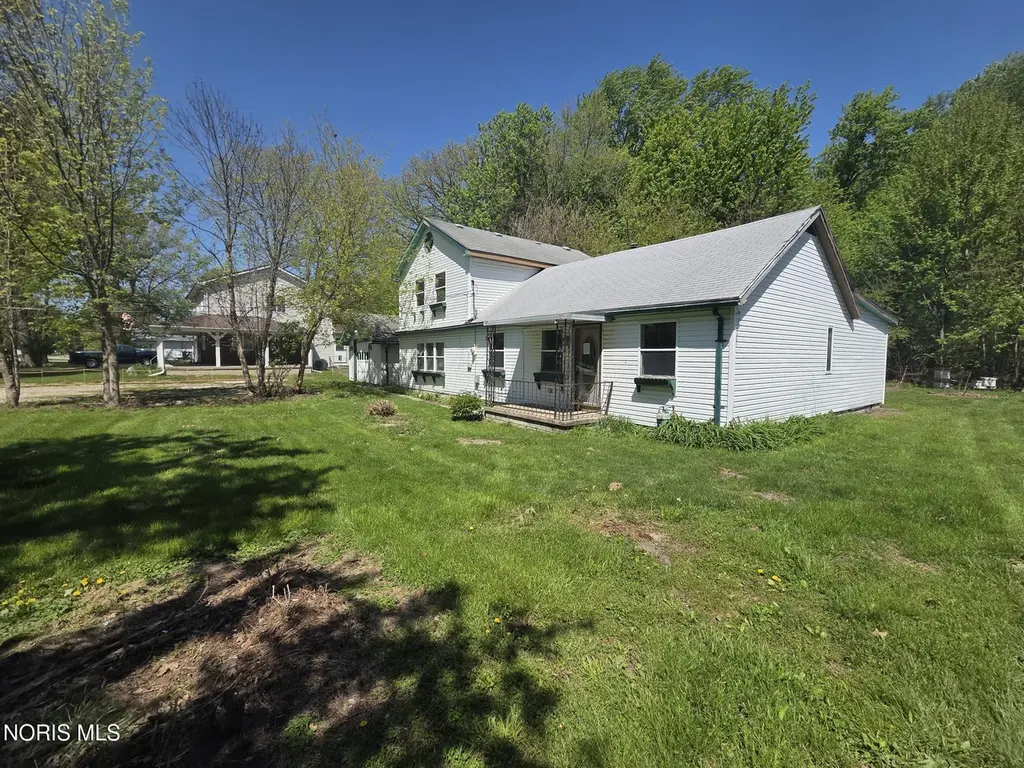
6125 Bryan Rd · Oregon, OH
Flood risk 1/10 · Minimal
- FEMA flood zone
- X
- Chance of flooding over 30 yrs
- 0.0%
- Est. flood insurance / yr
- $507 – $1,088
Fire risk 1/10 · Minimal
- Est. fire insurance / yr
- $713 – $1,323
Heat risk 3/10 · Minor
- Hot days now (above 99°F)
- 7 days/yr
- Hot days in 30 yrs
- 16 days/yr
Wind risk 2/10 · Minimal
- Chance of severe wind over 30 yrs
- —
Air-quality risk 2/10 · Minimal
- Unhealthy air days now
- 1 days/yr
- Unhealthy air days in 30 yrs
- 2 days/yr
Risk factors via First Street. Map © Google.
Why this score? — see what drove the B+ grade
The composite is a weighted blend of 9 inputs, each scored 0–100. Each bar is that input's sub-score; the figure is the points it added to the 100-point composite (weight × sub-score).
- Cash flow +30.0/30.0
- ARV discount +15.0/15.0
- 1% rule +10.0/10.0
- DSCR +10.0/10.0
- Schools +4.6/10.0
- Livability +3.8/5.0
- Rent growth +2.5/5.0
- Condition / age +2.5/5.0
- Appreciation +0.0/10.0
$104,000
🖨 Deal sheet (PDF) 📄 Offer letter ✓ Due diligence
Listing remarks
This 5 bedroom 2 full bath that sits on a crawl foundation with over 2000 sqft of living space. This property is in need of some updates and is looking for your TLC. This property sits in a neighborhood right next to the waters of lake Erie. If you are looking for a project this is for you. ?All offers must be submitted by the buyer?s agent using the online offer management system. Access the system via the link below.
Key facts
- 5,663 sq ft lot
- Garage
- Built 1949
Property features AI
Finance
- Other: Tax year: 2025
Exterior
- Parking: Has garage (1.5 garage spaces); Total parking for 2 vehicles; Driveway with gravel surface
- Utilities: Electricity connected (100 Amp service); Natural gas available; Public water connected; Public sewer
- Home design: Single-family residence (house); Two levels / 2 stories; Not attached to other structures; Living area approximately 2,060
- Construction: Vinyl siding; Crawl space foundation
- Exterior features: Asphalt/shingle roof; Chain link fencing; Shed(s) on property; Irregular, wooded lot; City street frontage with asphalt road
Interior
- Kitchen: Kitchen on main level (10 x 8)
- Bedrooms: Bedroom 2 on main level (10 x 10); Bedroom 3 on main level (12 x 10); Bedroom 4 on upper level (15 x 12); Bedroom 5 on upper level (12 x 12)
- Flooring: Carpet; Linoleum
- Bathrooms: 2 full bathrooms
- Heating & cooling: Natural gas heating; Cooling: Other
- Interior features: 8 total rooms; Other interior features; Fireplaces in family room and living room (2 total)
- Laundry & utility: Laundry on main level; Water heater
Neighborhood map
What this means for you Summary
Snapshot
- This is a 5-bed/2.0-bath single-family listed at $104k.
Deal economics
- At list price, monthly cash flow is $735 ($9k/yr) — positive.
- The deal already cash-flows at list — no discount required.
- Meets the 1% rule at list price ($2k rent vs $104k).
- Recommended offer: $102k (1.5% below list) — sets the bar for market timing.
- Cap rate 14.8% vs local median 3.3% in Oregon — top-decile yield for the area; either an underpriced asset or a hidden risk that comps aren't pricing in. Stress-test before assuming the spread holds.
Location & tenants
- Location reads 76/100 on livability (#210 in OH, #3,303 nationally) — a middle-class / working-renter tenant base. Strengths: cost of living A+, housing A+, health & safety A+; Watch: crime D, amenities F, commute F.
- Oregon City (rural): math 48% / reading 59% proficiency, ranked #384 of 656 in OH (top 58%) — acceptable for families but not a draw, mixed tenant base, ~2y average lease.
- Zoned schools: Jerusalem Elementary School (math 77% / reading 67%, grade A-, #323 of 1,584 statewide, top 23%, 396 students, 34% FRL); Fassett Junior High School (math 42% / reading 54%, grade C-, #441 of 654 statewide, top 68%, 519 students, 40% FRL); Clay High School (math 27% / reading 69%, grade D, #429 of 781 statewide, top 55%, 1,139 students, 39% FRL) — zoned schools at 38% FRL track the district average.
- Market conditions: 80 active listings in the ZIP; solid renter incomes; 415 units permitted in Lucas County in 2024 (122 in 5+ unit buildings).
Forward outlook
- Local home prices are declining (-3.0%/yr); year-one equity from $719 of loan paydown is wiped out by about $3k of value loss. Plan a longer hold.
- Lucas County population projected at -16% by 2050 — secular population decline; favor cash flow + early exit over multi-decade hold.
- At projected returns (-3.0% appreciation + 3.0% rent growth), your $29k cash investment doubles in ~4 years — after that, you're playing with house money.
Negotiation context
- It's been on market 19 days — a 2% lower offer ($102k) is reasonable based on typical stale-listing flexibility.
Risks & watch-outs
- Watch-outs: built in 1949 — expect roof / HVAC / electrical / plumbing capex.
Questions for the listing agent
- Built in 1949 — when were the roof, HVAC, electrical panel, plumbing, and water heater last replaced?
- Is there a deadline driving the sale (1031 exchange, divorce, estate, relocation)? That informs how much negotiation room exists.
- Schools are B-rated — typically a magnet for longer-tenancy family renters. What's the average tenant stay here, and is there a school-zone premium baked into asking?
- Crime grade is D in this area — have there been break-ins, vandalism, or insurance claims at this property in the last 3 years? What carrier currently insures it and at what premium?
- What's the average days-on-market for RENTAL listings here right now (not sales)? A rising rental-DOM trend means longer vacancies and softer asking-rent achievability than the comps imply.
- What's the recent tenant-quality profile in this submarket — average credit score on applications, eviction rate, late-payment / NSF rate, and stable-employment percentage? A property-management company in the area should have these aggregated.
- How much new for-sale + rental construction is in the pipeline within 1–3 miles? Heavy new supply typically softens prices + rents 12–24 months out; constrained supply supports both.
Investment metrics
- 1% rule
- 1.87% ✓
- Cap rate
- 14.78%
- Cash-on-cash
- 30.31%
- DSCR
- 2.35
- GRM
- 4.5
CMA / ARV
- ARV (median comp)
- $194,614
- List price
- $104,000
- Delta
- -46.56%
- Verdict
- UNDERPRICED
- Comps
- 6 within 1.0 mi
Show comp detail 2 sales within ~0.75 mi
| Address | Dist | Beds/Ba | Sqft | Sold | Price | $/sf | Match |
|---|---|---|---|---|---|---|---|
| 1810 James Rd | 0.21mi | 4/2.0 (-1) | 1,870 (-9%) | 15mo | $272,000 | $145 | 58 |
| 1856 N Stadium Rd | 0.47mi | 4/1.0 (-1) | 1,862 (-10%) | 9mo | $185,000 | $99 | 45 |
Match score weights: distance 35% · size 25% · config 20% · recency 20%. Top-matched comps best support the ARV.
Projected returns pro-forma
-3.0% appreciation · 3.0% rent growth · sell at horizon
- IRR
- 25.0%
- Equity multiple
- 2.03×
- Total profit
- $30,071
- Equity at exit
- $15,507
- IRR
- 32.8%
- Equity multiple
- 3.98×
- Total profit
- $86,831
- Equity at exit
- $8,992
Cash invested: $29,120 (down + closing). Projections, not guarantees.
Landlord ↔ Tenant lean methodology
- Overall (STATE)
- 73 Landlord-Friendly
- State Ohio
- 73 Landlord-Friendly · R+6
- County
- — inherits STATE
- City
- — inherits STATE
ZIP-level market 43616
- Home prices YoY
- -20.9%
- Active inventory
- 80
- Price-to-rent
- 4.5×
Monthly cashflow live
- Estimated rent
- $1,947 medium interval (Pro) →
- Mortgage (P&I)
- −$545
- Tax from tax record
- −$214 /mo · $2,569/yr
- Insurance
- −$43
- HOA
- −$0
- Vacancy / Maint / Mgmt
- −$409
- Net cashflow
- $735
Break-even live
Sensitivity live
| Price | -10% $794 | -5% $765 | +0% $735 | +5% $706 | +10% $677 |
|---|---|---|---|---|---|
| Rent | -10% $582 | -5% $659 | +0% $735 | +5% $812 | +10% $889 |
| Rate | -1.0pp $788 | -0.5pp $762 | base $735 | +0.5pp $709 | +1.0pp $681 |
UW: 25.0% down · 7.5% · 30yr · 1.5% tax · 5.0% vac · 8.0% maint · 8.0% mgmt
Financing live
Cash to close
- Down payment
- $26,000
- Closing costs
- $3,120
- Reserves months
- —
- Total cash needed
- —
Loan-product check · same deal, 3 products live
Conventional
25% down · 7.5% · 30yr
- Down + closing
- —
- Monthly P&I
- —
- Monthly cashflow
- —
- DSCR
- —
- Eligible?
- —
Personal DTI + credit; lowest rate.
DSCR
20% down · 8.5% · 30yr
- Down + closing
- —
- Monthly P&I
- —
- Monthly cashflow
- —
- DSCR
- —
- Eligible?
- —
No personal income docs; deal must DSCR.
Hard money
10% down · 12.0% · 12mo
- Down + closing
- —
- Monthly P&I
- —
- Monthly cashflow
- —
- DSCR
- —
- Eligible?
- —
Short-term bridge; refi at stabilization.
Listing history 2 events
-
2026-05-06$104,000 Active 422-char remark
-
2025-11-19soldstatus $126,100
ⓘ Source: listings_history table (triggers on properties + properties_extension) + one-shot
backfill from property_details.listing_events for pre-trigger history.
Tax reassessment forecast OH · Partial reset (capped growth)
- Current annual tax
- $2,569 · $214/mo
- Projected year-2 tax
- $2,569 · $214/mo
- Expected delta
- $0/yr ($0/mo · 0.0%)
ⓘ Screening estimate from a state-policy table — verify with the county assessor before closing.
Climate risk First Street
- Flood 1/10 Low FEMA zone X · 0% chance over 30 yrs
- Wildfire 1/10 Low
- Heat 3/10 Moderate 7 d/yr ≥99°F today · 16 d/yr by 30 yrs out
- Wind 2/10 Low
- Air quality 2/10 Low 1 unhealthy d/yr today · 2 by 30 yrs out
Nearby sold comps map
Loading sold comps map…
Walkable amenities ~0.75 mi
Loading nearby amenities…
Taxation est. · year 1
- Rental income
- $23,366
- − Mortgage interest
- −$5,826
- − Property taxes
- −$2,569
- − Insurance
- −$520
- − Repairs & maintenance
- −$1,869
- − Management
- −$1,869
- − Depreciation
- −$3,025
- Taxable income
- $7,687
- Est. tax owed @ 24.0%
- −$1,845
- After-tax cash flow
- $6,981/yr
For passive investors: Depreciation is non-cash, so a rental often shows a tax loss while cash-flowing — sheltering income. Rental losses are passive: they offset passive income freely, and up to $25,000/yr can offset ordinary (W-2) income if you actively participate and your MAGI is under $100k (phasing out to $0 by $150k); unused losses carry forward. On sale, claimed depreciation is recaptured at up to 25%, and gains may owe capital-gains tax (a 1031 exchange can defer both). Figures are a year-1 estimate at your 24.0% rate — not tax advice; consult a CPA.
Schools (NCES district)
- District
- Oregon City
- NCES district ID
- 3904460
- Math proficiency
- 48% ▼ -20.00%
- Reading proficiency
- 59% ▼ -7.00%
- Median HH income
- $53,972
- Composite
- 46.03/100
- National rank
- #2524
- State rank
- #384 of 656 in OH
Livability — Oregon
- Score
- 76/100
- State rank
- #210
- US rank
- #3303
Category grades
Schools grade is shown separately in the Schools card above.
Census & demographics
- Census place
- Oregon, OH
- County
- Lucas County · 380,724 people
- City population
- 20,309
- Metro
- Toledo, OH
- Population (ZIP)
- 20,309
- Household income
- $81,829
- Rent vs Own
- Severe rent burden
- 395.0
Population outlook (Lucas County) Hauer SSP2
- Today (2025)
- 420,751 people
- By 2030
- 410,187 · -2.5%
- By 2040
- 384,019 · -8.7%
- By 2050
- 355,125 · -15.6%
- By 2075
- 291,683 · -30.7%
- By 2100
- 233,670 · -44.5%
Race, ethnicity, and origin ACS 2023
- Neighborhood character
- Predominantly White (86%)
- Race & ethnicity
- White 86% Hispanic / Latino 8% Two or more races 6% Asian 2% Black 1%
- Hispanic origin (detail)
- Mexican 7%
- Common ancestry
- Romanian 8% Lithuanian 6% Slovak 2%
- Foreign-born
- 3% · Canada, Vietnam, China
- Languages at home
- 95% English-only · Spanish 2% Vietnamese 1%
Political lean MEDSL · Lucas
- 2024 margin
- D (+12.6) · D 55.8% · R 43.2%
- 2008→2024 swing
- -18.9pp toward R · 2008: 31.4pp · 2024: 12.6pp
- All cycles
- 2024: D+12.6 2020: D+16.8 2016: D+17.4 2012: D+30.4 2008: D+31.4
Not yet ingested
- Civics
- —
Market trends
- HPI YoY
- ▼ -56.90%
- Current HPI
- 214.6328
- Rent YoY
- —
- Metro
- Toledo, OH
- State GDP YoY
- ▲ 1.98%
- F500 in state
- 48
Industry mix (Fortune 500 HQ in OH)
| Industry | F500 HQs | Revenue |
|---|---|---|
| Insurance | 3 | $145B |
|
||
| Industrial Machinery | 3 | $49B |
|
||
| Financial Services | 3 | $24B |
|
||
| Consumer Goods | 2 | $93B |
|
||
| Aerospace / Defense | 2 | $47B |
|
||
| Utilities | 2 | $33B |
|
||
Price history
-17.5% since first listed3 events — show timeline
- 2026-05-26 Pending — NORIS
- 2026-05-06 Listed $104,000 NORIS
- 2025-11-19 Sold (Public Records) $126,100 Public Records
Property tax history
+3.3%/yrLatest (2025): $2,569 · +26.9% YoY. Source: county tax records.
Cash-flow waterfall
monthlySold comps — $/sqft
last 12 mo · ≤1 miLoading sold comps…