4719 Metroon Dr · Charlotte, NC
Flood risk No data
- FEMA flood zone
- —
- Chance of flooding over 30 yrs
- —
- Est. flood insurance / yr
- —
Fire risk No data
- Est. fire insurance / yr
- —
Heat risk No data
- Hot days now (above threshold)
- —
- Hot days in 30 yrs
- —
Wind risk No data
- Chance of severe wind over 30 yrs
- —
Air-quality risk No data
- Unhealthy air days now
- —
- Unhealthy air days in 30 yrs
- —
Risk factors via First Street. Map © Google.
Why this score? — see what drove the C grade
The composite is a weighted blend of 9 inputs, each scored 0–100. Each bar is that input's sub-score; the figure is the points it added to the 100-point composite (weight × sub-score).
- Cash flow +16.9/30.0
- ARV discount +15.0/15.0
- DSCR +5.2/10.0
- 1% rule +4.6/10.0
- Livability +3.9/5.0
- Schools +3.8/10.0
- Rent growth +3.2/5.0
- Condition / age +2.5/5.0
- Appreciation +0.0/10.0
$179,099
🖨 Deal sheet 📄 Offer letter ✓ Due diligence
Listing remarks
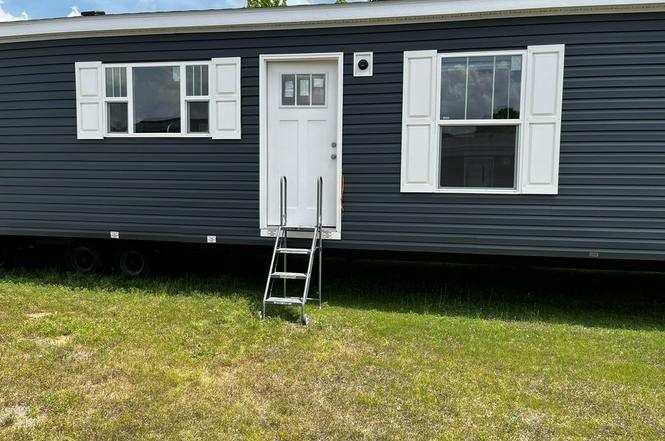
INSTALLED ON LOT AND FINAL FINISHING IN PROGRESS
Key facts
- Built 2025
- Listed 177 days
Neighborhood map
What this means for you Summary
Snapshot
- This is a 2-bed/2.0-bath single-family listed at $179k.
Deal economics
- At list price, monthly cash flow is $117 ($1k/yr) — positive.
- The deal already cash-flows at list — no discount required.
- To meet the 1% rule (rent ≥ 1% of price), the offer needs to be $172k (4.2% below list).
- Recommended offer: $158k (12.0% below list) — sets the bar for market timing.
- Cap rate 7.1% vs local median 3.1% in Charlotte — top-decile yield for the area; either an underpriced asset or a hidden risk that comps aren't pricing in. Stress-test before assuming the spread holds.
Location & tenants
- Location reads 78/100 on livability (#26 in NC, #2,502 nationally) — a middle-class / working-renter tenant base. Strengths: amenities A+, commute A+, housing A+; Watch: schools D+, crime F.
- Charlotte-Mecklenburg Schools (urban): math 42% / reading 46% proficiency, ranked #85 of 178 in NC (top 48%) — families likely to look elsewhere, expect single-tenant / working-renter base with shorter leases.
- Market conditions: Rents rising (+2.7%/yr); 375 active listings in the ZIP; 28 comparable units currently listed for rent nearby; rentals at typical pace (median 16d on market — plan ~3-4 weeks tenant-placement turnaround); solid renter incomes; 11,969 units permitted in Mecklenburg County in 2024 (5,377 in 5+ unit buildings).
Forward outlook
- Local home prices are declining (-3.0%/yr); year-one equity from $1k of loan paydown is wiped out by about $5k of value loss. Plan a longer hold.
- Mecklenburg County population projected at +53% by 2050 — long-run rental-demand tailwind backs the buy-and-hold thesis.
Negotiation context
- It's been on market 177 days — a 12% lower offer ($158k) is reasonable based on typical stale-listing flexibility.
Questions for the listing agent
- It's been on market 177 days. Have you received any prior offers? Is the seller open to a 12% concession, seller financing, or rate buy-down credit?
- Why hasn't it sold? Are there any deal-killer items the seller is aware of (foundation, flood, title, zoning, code violations)?
- Is there a deadline driving the sale (1031 exchange, divorce, estate, relocation)? That informs how much negotiation room exists.
- Schools are D-rated, which usually means shorter tenancies and higher turnover. Who's the typical renter profile here, and what's been the actual vacancy rate?
- Crime grade is F in this area — have there been break-ins, vandalism, or insurance claims at this property in the last 3 years? What carrier currently insures it and at what premium?
- What's the average days-on-market for RENTAL listings here right now (not sales)? A rising rental-DOM trend means longer vacancies and softer asking-rent achievability than the comps imply.
- What's the recent tenant-quality profile in this submarket — average credit score on applications, eviction rate, late-payment / NSF rate, and stable-employment percentage? A property-management company in the area should have these aggregated.
- How much new for-sale + rental construction is in the pipeline within 1–3 miles? Heavy new supply typically softens prices + rents 12–24 months out; constrained supply supports both.
Investment metrics
- 1% rule
- 0.96% ✗
- Cap rate
- 7.08%
- Cash-on-cash
- 2.80%
- DSCR
- 1.12
- GRM
- 8.7
CMA / ARV
- ARV (on-the-fly)
- $317,205
- Comps found
- 12
Show comp detail 12 sales within ~0.75 mi
| Address | Dist | Beds/Ba | Sqft | Sold | Price | $/sf | Match |
|---|---|---|---|---|---|---|---|
| 7125 Falconwood Ct | 0.47mi | 3/2.0 (+1) | 1,251 (+4%) | 1mo | $320,000 | $256 | 65 |
| 7310 Palmetto Ct | 0.60mi | 2/2.0 | 1,118 (-7%) | 2mo | $278,000 | $249 | 59 |
| 9320 Tibble Creek Way | 0.70mi | 3/2.0 (+1) | 1,204 (+1%) | 6mo | $322,750 | $268 | 56 |
| 3512 Cross Winds Rd | 0.45mi | 3/2.0 (+1) | 1,302 (+9%) | 6mo | $345,000 | $265 | 55 |
| 9122 Nathaniel Russell Ln | 0.35mi | 3/2.0 (+1) | 1,062 (-11%) | 8mo | $309,900 | $292 | 53 |
| 8318 David Lee Ln | 0.51mi | 3/2.0 (+1) | 1,110 (-7%) | 7mo | $263,000 | $237 | 53 |
| 8618 Milton Morris Dr | 0.71mi | 3/2.0 (+1) | 1,280 (+7%) | 1mo | $335,000 | $262 | 50 |
| 7516 Barn Stone Dr | 0.65mi | 3/2.0 (+1) | 1,310 (+9%) | 6mo | $315,000 | $240 | 43 |
| 3410 Joseph Dr | 0.74mi | 3/2.0 (+1) | 1,269 (+6%) | 8mo | $340,000 | $268 | 43 |
| 7308 Barn Stone Dr | 0.72mi | 3/2.0 (+1) | 1,097 (-8%) | 9mo | $360,000 | $328 | 40 |
| 3403 Fernstone Cir | 0.74mi | 3/2.0 (+1) | 1,071 (-10%) | 7mo | $290,000 | $271 | 37 |
| 8606 Beechbrooke Rd | 0.58mi | 3/2.0 (+1) | 1,376 (+15%) | 10mo | $327,000 | $238 | 35 |
Match score weights: distance 35% · size 25% · config 20% · recency 20%. Top-matched comps best support the ARV.
Projected returns pro-forma
-3.0% appreciation · 2.7% rent growth · sell at horizon
- IRR
- -12.2%
- Equity multiple
- 0.56×
- Total profit
- $-22,047
- Equity at exit
- $26,704
- IRR
- -3.5%
- Equity multiple
- 0.77×
- Total profit
- $-11,587
- Equity at exit
- $15,485
Cash invested: $50,148 (down + closing). Projections, not guarantees.
Landlord ↔ Tenant lean methodology
- Overall (STATE)
- 85 Strongly Landlord-Friendly
- State North Carolina
- 85 Strongly Landlord-Friendly · R+3
- County
- — inherits STATE
- City
- — inherits STATE
ZIP-level market 28227
- Rents YoY
- 2.7%
- Active inventory
- 375
- Price-to-rent
- 8.7×
Monthly cashflow live
- Estimated rent
- $1,715 high interval (Pro) →
- Mortgage (P&I)
- −$939
- Tax est. 1.5%
- −$224 /mo · $2,686/yr
- Insurance
- −$75
- HOA
- −$0
- Vacancy / Maint / Mgmt
- −$360
- Net cashflow
- $117
Break-even live
UW: 25.0% down · 7.5% · 30yr · 1.5% tax · 5.0% vac · 8.0% maint · 8.0% mgmt
Financing live
Cash to close
- Down payment
- $44,775
- Closing costs
- $5,373
- Reserves months
- —
- Total cash needed
- —
Loan-product check · same deal, 3 products live
Conventional
25% down · 7.5% · 30yr
- Down + closing
- —
- Monthly P&I
- —
- Monthly cashflow
- —
- DSCR
- —
- Eligible?
- —
Personal DTI + credit; lowest rate.
DSCR
20% down · 8.5% · 30yr
- Down + closing
- —
- Monthly P&I
- —
- Monthly cashflow
- —
- DSCR
- —
- Eligible?
- —
No personal income docs; deal must DSCR.
Hard money
10% down · 12.0% · 12mo
- Down + closing
- —
- Monthly P&I
- —
- Monthly cashflow
- —
- DSCR
- —
- Eligible?
- —
Short-term bridge; refi at stabilization.
Rent comps 28 comps
| Address | Beds | Baths | Sqft | Rent | $/sqft | DOM | Units | Dist |
|---|---|---|---|---|---|---|---|---|
| 4616 Stoney Trace Dr Mint Hill, NC | 3.0 | 2.0 | 1306 | $1,750 | $1.34 | 18d | 1 | 0.15mi |
| 4616 Stoney Trace Dr Mint Hill, NC | 1.0–3.0 | 1.0–2.0 | 975 | $1,312 | $1.35 | 5d | 25 | 0.15mi |
| 4616 Stoney Trace Dr Mint Hill, NC | 1.0–3.0 | 1.0–2.0 | 975 | $1,532 | $1.57 | 24d | 18 | 0.15mi |
| 3434 Braewick Pl Charlotte, NC | 3.0 | 2.0 | 1093 | $1,720 | $1.57 | 24d | 1 | 0.36mi |
| 3407 Braewick Pl Charlotte, NC | 3.0 | 2.0 | 1134 | $1,750 | $1.54 | 16d | 1 | 0.41mi |
| 9610 Stoney Glen Dr Mint Hill, NC | 1.0–3.0 | 1.0–2.0 | 1071 | $1,400 | $1.31 | 2d | 53 | 0.41mi |
| 7601 Swedish Ivy Ln Charlotte, NC | 3.0 | 2.5 | 1300 | $2,000 | $1.54 | 5d | 1 | 0.59mi |
| 3032 Chenango Dr Charlotte, NC | 2.0 | 1.5 | 895 | $1,695 | $1.89 | 7d | 1 | 0.60mi |
| 3131 Vestal Pl Charlotte, NC | 2.0 | 1.0 | 800 | $1,550 | $1.94 | 24d | 1 | 0.63mi |
| 8204 Mintworth Links Ln Matthews, NC | 3.0 | 2.5 | 1470 | $2,085 | $1.42 | 1d | 7 | 0.64mi |
| 9930 Idlewild Rd Matthews, NC | 1.0–2.0 | 1.0–2.0 | 1061 | $2,901 | $2.73 | 2d | 62 | 0.67mi |
| 8501 Milton Morris Dr Charlotte, NC | 3.0 | 2.0 | 1328 | $1,879 | $1.41 | 22d | 1 | 0.69mi |
| 3652 Melrose Cottage Dr Matthews, NC | 3.0 | 2.5 | 1444 | $1,900 | $1.32 | 7d | 1 | 0.72mi |
| 3400 New Hampshire Dr Charlotte, NC | 3.0 | 2.0 | 1436 | $1,950 | $1.36 | 24d | 1 | 0.78mi |
| 3821 Rosedown Dr Matthews, NC | 3.0 | 2.0 | 1024 | $1,899 | $1.85 | 24d | 1 | 0.89mi |
| 3722 Hunters Run Ln Matthews, NC | 3.0 | 2.0 | 1291 | $1,949 | $1.51 | 16d | 1 | 0.94mi |
| 8448 Huntdale Ct Charlotte, NC | 3.0 | 2.0 | 1500 | $1,995 | $1.33 | 24d | 1 | 0.94mi |
| 5310 McAlpine Glen Dr Charlotte, NC | 1.0–2.0 | 1.0–2.0 | 750 | $1,600 | $2.13 | 2d | 14 | 0.96mi |
| 5323 Chestnut Lake Dr Charlotte, NC | 3.0 | 2.5 | 1440 | $1,500 | $1.04 | 24d | 1 | 1.19mi |
| 7608 Morgense Pl Charlotte, NC | 3.0 | 2.0 | 1019 | $1,675 | $1.64 | 7d | 1 | 1.22mi |
| 8727 Wandering Creek Way Charlotte, NC | 3.0 | 2.5 | 1368 | $1,650 | $1.21 | 16d | 1 | 1.23mi |
| 8727 Wandering Creek Way Charlotte, NC | 3.0 | 2.5 | 1368 | $1,695 | $1.24 | 7d | 1 | 1.23mi |
| 8737 Wandering Creek Way Charlotte, NC | 2.0 | 2.5 | 1019 | $1,325 | $1.30 | 24d | 1 | 1.24mi |
| 8618 Twined Creek Ln Charlotte, NC | 2.0 | 2.5 | 1226 | $1,595 | $1.30 | 7d | 1 | 1.24mi |
| 8708 Twined Creek Ln Charlotte, NC | 2.0 | 2.5 | 1058 | $1,550 | $1.47 | 7d | 1 | 1.25mi |
| 6550 Lynmont Dr Charlotte, NC | 3.0 | 2.0 | 984 | $1,800 | $1.83 | 24d | 1 | 1.34mi |
| 10510 Waterford Creek Ln Charlotte, NC | 1.0–2.0 | 1.0–2.0 | 915 | $1,306 | $1.43 | 2d | 20 | 1.35mi |
| 7100 Snow Ln Charlotte, NC | 2.0 | 1.5 | 852 | $1,275 | $1.50 | 24d | 1 | 1.46mi |
Listing history 13 events
-
2026-06-18days on market $179,099 Active 177 DOM
-
2026-06-17days on market $179,099 Active 176 DOM
-
2026-06-16days on market $179,099 Active 175 DOM
-
2026-06-15days on market $179,099 Active 174 DOM
-
2026-06-13days on market $179,099 Active 172 DOM
-
2026-06-10days on market $179,099 Active 168 DOM
-
2026-06-07days on market $179,099 Active 166 DOM
-
2026-06-04days on market $179,099 Active 163 DOM
-
2026-06-03days on market $179,099 Active 162 DOM
-
2026-06-02days on market $179,099 Active 161 DOM
-
2026-06-02days on market $179,099 Active 160 DOM
-
2026-05-31days on market $179,099 Active 159 DOM
-
2025-12-23$179,099 Active
ⓘ Source: listings_history table (triggers on properties + properties_extension) + one-shot
backfill from property_details.listing_events for pre-trigger history.
Nearby sold comps map
Loading sold comps map…
Walkable amenities ~0.75 mi
Loading nearby amenities…
Taxation est. · year 1
- Rental income
- $20,581
- − Mortgage interest
- −$10,032
- − Property taxes
- −$2,686
- − Insurance
- −$895
- − Repairs & maintenance
- −$1,646
- − Management
- −$1,646
- − Depreciation
- −$5,210
- Taxable loss
- −$1,536
- Est. tax savings @ 24.0%
- +$369
- After-tax cash flow
- $1,775/yr
For passive investors: Depreciation is non-cash, so a rental often shows a tax loss while cash-flowing — sheltering income. Rental losses are passive: they offset passive income freely, and up to $25,000/yr can offset ordinary (W-2) income if you actively participate and your MAGI is under $100k (phasing out to $0 by $150k); unused losses carry forward. On sale, claimed depreciation is recaptured at up to 25%, and gains may owe capital-gains tax (a 1031 exchange can defer both). Figures are a year-1 estimate at your 24.0% rate — not tax advice; consult a CPA.
Schools (NCES district)
- District
- Charlotte-Mecklenburg Schools
- NCES district ID
- 3702970
- Math proficiency
- 42% ▼ -6.00%
- Reading proficiency
- 46% ▲ 1.00%
- Median HH income
- $57,175
- Composite
- 38.49/100
- National rank
- #4183
- State rank
- #85 of 178 in NC
Livability — Charlotte
- Score
- 78/100
- State rank
- #26
- US rank
- #2502
Category grades
Schools grade is shown separately in the Schools card above.
Census & demographics
- Census place
- Charlotte, NC
- County
- Mecklenburg County · 1,167,319 people
- City population
- 920,422
- Metro
- Charlotte-Concord-Gastonia, NC-SC
- Population (ZIP)
- 60,482
- Household income
- $77,115
- Rent vs Own
- Severe rent burden
- 1373.0
Population outlook (Mecklenburg County) Hauer SSP2
- Today (2025)
- 1,305,740 people
- By 2030
- 1,442,752 · +10.5%
- By 2040
- 1,722,441 · +31.9%
- By 2050
- 1,999,450 · +53.1%
- By 2075
- 2,642,495 · +102.4%
- By 2100
- 3,106,755 · +137.9%
Race, ethnicity, and origin ACS 2023
- Neighborhood character
- Diverse neighborhood (Simpson 0.69)
- Race & ethnicity
- White 43% Black 29% Hispanic / Latino 19% Two or more races 8% Asian 5%
- Hispanic origin (detail)
- Mexican 8% Puerto Rican 2%
- Common ancestry
- Slovak 2% Serbian 2% Scotch-Irish 1%
- Foreign-born
- 17% · Canada, Philippines, Vietnam
- Languages at home
- 76% English-only · Spanish 17% Other Indo-European 2% Other Asian/Pacific 1%
Political lean MEDSL · Mecklenburg
- 2024 margin
- Solid D (+32.9) · D 65.6% · R 32.7% · Other 1.6%
- 2008→2024 swing
- +8.5pp toward D · 2008: 24.4pp · 2024: 32.9pp
- All cycles
- 2024: D+32.9 2020: D+35.1 2016: D+29.9 2012: D+22.5 2008: D+24.4
Not yet ingested
- Civics
- —
Market trends
- HPI YoY
- ▼ -281.74%
- Current HPI
- 257.0678
- Rent YoY
- ▲ 2.70%
- Metro
- Charlotte-Concord-Gastonia, NC-SC
- State GDP YoY
- ▲ 3.28%
- F500 in state
- 26
Industry mix (Fortune 500 HQ in NC)
| Industry | F500 HQs | Revenue |
|---|---|---|
| Financial Services | 2 | $213B |
|
||
| Retail | 2 | $95B |
|
||
| Industrial Conglomerate | 1 | $38B |
|
||
| Metals / Steel | 1 | $35B |
|
||
| Utilities | 1 | $30B |
|
||
| Industrial Machinery | 1 | $19B |
|
||
Price history
1 event — show timeline
- 2025-12-23 Listed $179,099 ForSaleByOwner.com
Cash-flow waterfall
monthlySold comps — $/sqft
last 12 mo · ≤1 miLoading sold comps…