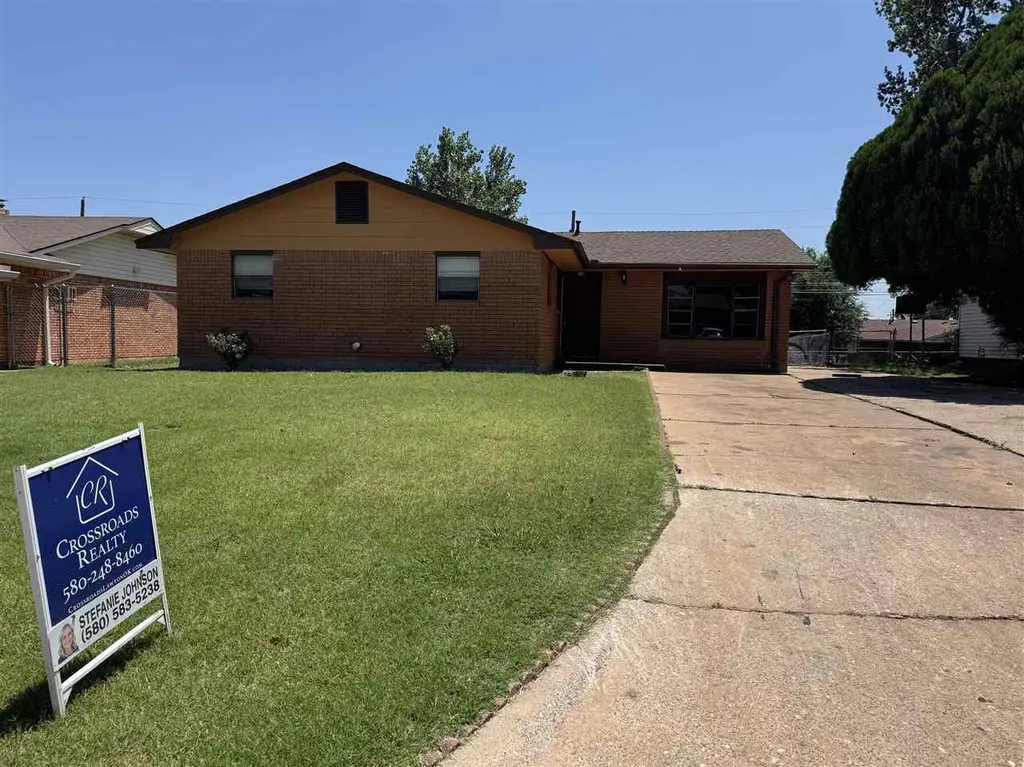
718 SW Ranch Oak Blvd · Lawton, OK
Flood risk 1/10 · Minimal
- FEMA flood zone
- X (unshaded)
- Chance of flooding over 30 yrs
- 0.0%
- Est. flood insurance / yr
- $507 – $1,088
Fire risk 7/10 · Major
- Est. fire insurance / yr
- $2,463 – $4,575
Heat risk 7/10 · Major
- Hot days now (above 109°F)
- 7 days/yr
- Hot days in 30 yrs
- 19 days/yr
Wind risk 3/10 · Minor
- Chance of severe wind over 30 yrs
- 6.0%
Air-quality risk 1/10 · Minimal
- Unhealthy air days now
- 0 days/yr
- Unhealthy air days in 30 yrs
- 0 days/yr
Risk factors via First Street. Map © Google.
Why this score? — see what drove the A- grade
The composite is a weighted blend of 9 inputs, each scored 0–100. Each bar is that input's sub-score; the figure is the points it added to the 100-point composite (weight × sub-score).
- Cash flow +30.0/30.0
- ARV discount +15.0/15.0
- 1% rule +10.0/10.0
- DSCR +10.0/10.0
- Appreciation +4.6/10.0
- Livability +3.2/5.0
- Rent growth +2.9/5.0
- Condition / age +2.5/5.0
- Schools +2.0/10.0
$85,000
🖨 Deal sheet (PDF) 📄 Offer letter ✓ Due diligence
Listing remarks
Great investment opportunity, has been a rental continuously for 20+ years. Needs a stove and some love. Sold as-is but VA and FHA could add lender required repairs, if any to the price. Please contact the REALTOR you have a written agreement with or if unrepresented, please call or text Stefanie Johnson at 580 583 5238 for more information or to schedule a showing.
Key facts
- 6,000 sq ft lot
- Garage
- Built 1964
Property features AI
Exterior
- Parking: No garage (converted garage)
- Security: Smoke detectors
- Utilities: Public water; Public sewer; Natural gas available
- Home design: Single family residence; One story; Residential property
- Construction: Brick veneer construction; Composition roof; Slab foundation; Built as single family residence
- Exterior features: Covered patio; Patio; Porch; Chain link fencing; Public maintained road access; City street frontage; R-1 single family zoning
Interior
- Kitchen: Disposal; Range hood
- Flooring: Ceramic tile; Carpet; Vinyl
- Bathrooms: 1 full bathroom
- Heating & cooling: Central heating (natural gas); Central electric air conditioning
- Interior features: Double pane windows; Window coverings; Disposal; Gas water heater; Range hood; No fireplace
- Laundry & utility: Washer hookup
Neighborhood map
What this means for you Summary
Snapshot
- This is a 3-bed/1.0-bath single-family listed at $85k.
Deal economics
- At list price, monthly cash flow is $552 ($7k/yr) — positive.
- The deal already cash-flows at list — no discount required.
- Meets the 1% rule at list price ($1k rent vs $85k).
- Cap rate 14.1% vs local median 6.0% in Lawton — top-decile yield for the area; either an underpriced asset or a hidden risk that comps aren't pricing in. Stress-test before assuming the spread holds.
Location & tenants
- Location reads 63/100 on livability (#206 in OK) — a middle-class / working-renter tenant base. Strengths: cost of living A+, housing A+; Watch: employment D, crime F, commute F.
- Lawton (urban): math 20% / reading 26% proficiency, ranked #137 of 270 in OK (top 51%) — low school quality limits family demand, transient renter base, plan for 1-2y turnover.
- Zoned schools: Sullivan Village Es (math 22% / reading 27%, grade F, #354 of 845 statewide, top 47%, 433 students, 0% FRL); Macarthur Ms (math 16% / reading 31%, grade F, #113 of 345 statewide, top 34%, 865 students, 0% FRL); Macarthur Hs (math 19% / reading 34%, grade F, #139 of 447 statewide, top 31%, 1,163 students, 0% FRL) — zoned schools average 0% FRL vs 54% district-wide (54 pts lower); this property's tenant base skews higher-income than the district average.
- Market conditions: Rents rising (+1.7%/yr); 120 active listings in the ZIP; 133 units permitted in Comanche County in 2024 (0 in 5+ unit buildings).
- This rent runs 33% of the median local income ($50k/yr) — at the standard rent-burdened threshold; future hikes will face affordability resistance.
Forward outlook
- Local home prices are declining (-0.7%/yr); year-one equity from $588 of loan paydown is wiped out by about $603 of value loss. Plan a longer hold.
- Comanche County population projected to shrink 3% by 2050 — rents likely to lag national; underwrite the cash flow, not the appreciation.
- At projected returns (-0.7% appreciation + 1.7% rent growth), your $24k cash investment doubles in ~4 years — after that, you're playing with house money.
Negotiation context
- Only 13 days on market — expect competitive offers; lowballing is unlikely to land.
Risks & watch-outs
- Climate carrying-cost: major wildfire risk; extreme-heat days projected 7→19/yr by 2055 (HVAC capex compounding) — expect insurance premiums to compound above CPI over the hold.
Questions for the listing agent
- Built in 1964 — when were the roof, HVAC, electrical panel, plumbing, and water heater last replaced?
- Is there a deadline driving the sale (1031 exchange, divorce, estate, relocation)? That informs how much negotiation room exists.
- Schools are D-rated, which usually means shorter tenancies and higher turnover. Who's the typical renter profile here, and what's been the actual vacancy rate?
- Crime grade is F in this area — have there been break-ins, vandalism, or insurance claims at this property in the last 3 years? What carrier currently insures it and at what premium?
- What's the average days-on-market for RENTAL listings here right now (not sales)? A rising rental-DOM trend means longer vacancies and softer asking-rent achievability than the comps imply.
- What's the recent tenant-quality profile in this submarket — average credit score on applications, eviction rate, late-payment / NSF rate, and stable-employment percentage? A property-management company in the area should have these aggregated.
- How much new for-sale + rental construction is in the pipeline within 1–3 miles? Heavy new supply typically softens prices + rents 12–24 months out; constrained supply supports both.
Investment metrics
- 1% rule
- 1.61% ✓
- Cap rate
- 14.08%
- Cash-on-cash
- 27.83%
- DSCR
- 2.24
- GRM
- 5.2
CMA / ARV
- ARV (on-the-fly)
- $137,917
- Comps found
- 8
Show comp detail 8 sales within ~0.75 mi
| Address | Dist | Beds/Ba | Sqft | Sold | Price | $/sf | Match |
|---|---|---|---|---|---|---|---|
| 3314 SW Salinas Dr | 0.11mi | 3/1.5 | 1,300 (-3%) | 0mo | $155,000 | $119 | 88 |
| 705 SW Ranch Oak Blvd | 0.07mi | 3/1.5 | 1,300 (-3%) | 11mo | $99,500 | $77 | 80 |
| 633 SW Arbuckle Ave | 0.08mi | 3/2.0 | 1,300 (-3%) | 14mo | $153,000 | $118 | 75 |
| 716 SW Arbuckle Ave | 0.05mi | 3/1.0 | 1,500 (+12%) | 7mo | $58,000 | $39 | 71 |
| 722 SW Butterfield Dr | 0.17mi | 3/2.0 | 1,300 (-3%) | 14mo | $60,000 | $46 | 71 |
| 708 SW Arbuckle Ave | 0.07mi | 4/1.5 (+1) | 1,200 (-10%) | 8mo | $158,000 | $132 | 65 |
| 3303 SW Salinas Dr | 0.07mi | 4/2.0 (+1) | 1,500 (+12%) | 3mo | $155,000 | $103 | 65 |
| 1205 SW Oklahoma Ave | 0.58mi | 4/1.5 (+1) | 1,200 (-10%) | 2mo | $113,500 | $95 | 47 |
Match score weights: distance 35% · size 25% · config 20% · recency 20%. Top-matched comps best support the ARV.
Projected returns pro-forma
-0.71% appreciation · 1.7% rent growth · sell at horizon
- IRR
- 25.6%
- Equity multiple
- 2.18×
- Total profit
- $28,087
- Equity at exit
- $21,711
- IRR
- 29.5%
- Equity multiple
- 3.97×
- Total profit
- $70,684
- Equity at exit
- $23,830
Cash invested: $23,800 (down + closing). Projections, not guarantees.
Landlord ↔ Tenant lean methodology
- Overall (STATE)
- 83 Strongly Landlord-Friendly
- State Oklahoma
- 83 Strongly Landlord-Friendly · R+20
- County
- — inherits STATE
- City
- — inherits STATE
ZIP-level market 73501
- Home prices YoY
- -0.4%
- Rents YoY
- 1.7%
- Active inventory
- 120
- Price-to-rent
- 5.2×
Monthly cashflow live
- Estimated rent
- $1,369 medium interval (Pro) →
- Mortgage (P&I)
- −$446
- Tax from tax record
- −$49 /mo · $586/yr
- Insurance
- −$35
- HOA
- −$0
- Vacancy / Maint / Mgmt
- −$288
- Net cashflow
- $552
Break-even live
Sensitivity live
| Price | -10% $600 | -5% $576 | +0% $552 | +5% $528 | +10% $504 |
|---|---|---|---|---|---|
| Rent | -10% $444 | -5% $498 | +0% $552 | +5% $606 | +10% $660 |
| Rate | -1.0pp $595 | -0.5pp $573 | base $552 | +0.5pp $530 | +1.0pp $507 |
UW: 25.0% down · 7.5% · 30yr · 1.5% tax · 5.0% vac · 8.0% maint · 8.0% mgmt
Financing live
Cash to close
- Down payment
- $21,250
- Closing costs
- $2,550
- Reserves months
- —
- Total cash needed
- —
Loan-product check · same deal, 3 products live
Conventional
25% down · 7.5% · 30yr
- Down + closing
- —
- Monthly P&I
- —
- Monthly cashflow
- —
- DSCR
- —
- Eligible?
- —
Personal DTI + credit; lowest rate.
DSCR
20% down · 8.5% · 30yr
- Down + closing
- —
- Monthly P&I
- —
- Monthly cashflow
- —
- DSCR
- —
- Eligible?
- —
No personal income docs; deal must DSCR.
Hard money
10% down · 12.0% · 12mo
- Down + closing
- —
- Monthly P&I
- —
- Monthly cashflow
- —
- DSCR
- —
- Eligible?
- —
Short-term bridge; refi at stabilization.
Listing history 12 events
-
2026-06-21days on market $85,000 Active 13 DOM
-
2026-06-19days on market $85,000 Active 11 DOM
-
2026-06-18days on market $85,000 Active 10 DOM
-
2026-06-17days on market $85,000 Active 9 DOM
-
2026-06-16days on market $85,000 Active 8 DOM
-
2026-06-15days on market $85,000 Active 7 DOM
-
2026-06-14days on market $85,000 Active 5 DOM
-
2026-06-13remarks 368-char remark
-
2026-06-13days on market $85,000 Active 4 DOM
-
2026-06-10days on market $85,000 Active 2 DOM
-
2026-06-09remarks 193-char remark
-
2026-06-09$85,000 Active 1 DOM
ⓘ Source: listings_history table (triggers on properties + properties_extension) + one-shot
backfill from property_details.listing_events for pre-trigger history.
Tax reassessment forecast OK · Resets to sale price
- Current annual tax
- $586 · $49/mo
- Projected year-2 tax
- $765 · $64/mo
- Expected delta
- +$179/yr (+$15/mo · 30.5%)
ⓘ Screening estimate from a state-policy table — verify with the county assessor before closing.
Climate risk First Street
- Flood 1/10 Low FEMA zone X (unshaded) · 0% chance over 30 yrs
- Wildfire 7/10 Severe
- Heat 7/10 Severe 7 d/yr ≥109°F today · 19 d/yr by 30 yrs out
- Wind 3/10 Moderate 6% chance of damaging wind over 30 yrs
- Air quality 1/10 Low 0 unhealthy d/yr today · 0 by 30 yrs out
Nearby sold comps map
Loading sold comps map…
Walkable amenities ~0.75 mi
Loading nearby amenities…
Taxation est. · year 1
- Rental income
- $16,434
- − Mortgage interest
- −$4,761
- − Property taxes
- −$586
- − Insurance
- −$425
- − Repairs & maintenance
- −$1,315
- − Management
- −$1,315
- − Depreciation
- −$2,473
- Taxable income
- $5,559
- Est. tax owed @ 24.0%
- −$1,334
- After-tax cash flow
- $5,288/yr
For passive investors: Depreciation is non-cash, so a rental often shows a tax loss while cash-flowing — sheltering income. Rental losses are passive: they offset passive income freely, and up to $25,000/yr can offset ordinary (W-2) income if you actively participate and your MAGI is under $100k (phasing out to $0 by $150k); unused losses carry forward. On sale, claimed depreciation is recaptured at up to 25%, and gains may owe capital-gains tax (a 1031 exchange can defer both). Figures are a year-1 estimate at your 24.0% rate — not tax advice; consult a CPA.
Schools (NCES district)
- District
- Lawton
- NCES district ID
- 4017250
- Math proficiency
- 20% ▼ -12.00%
- Reading proficiency
- 26% ▼ -9.00%
- Median HH income
- $42,618
- Composite
- 19.68/100
- National rank
- #8732
- State rank
- #137 of 270 in OK
Livability — Lawton
- Score
- 63/100
- State rank
- #206
- US rank
- #15131
Category grades
Schools grade is shown separately in the Schools card above.
Census & demographics
- Census place
- Lawton, OK
- County
- Comanche County · 96,361 people
- City population
- 89,233
- Metro
- Lawton, OK
- Population (ZIP)
- 20,397
- Household income
- $49,741
- Rent vs Own
- Severe rent burden
- 742.0
Population outlook (Comanche County) Hauer SSP2
- Today (2025)
- 124,518 people
- By 2030
- 124,231 · -0.2%
- By 2040
- 122,193 · -1.9%
- By 2050
- 120,368 · -3.3%
- By 2075
- 120,492 · -3.2%
- By 2100
- 123,113 · -1.1%
Race, ethnicity, and origin ACS 2023
- Neighborhood character
- Highly diverse neighborhood (Simpson 0.73)
- Race & ethnicity
- White 45% Black 20% Two or more races 18% Hispanic / Latino 14% Native American 7% Asian 3%
- Hispanic origin (detail)
- Mexican 7% Puerto Rican 4%
- Common ancestry
- Lithuanian 2% Italian 2% Slovak 1%
- Foreign-born
- 6% · Canada, Vietnam, South Korea
- Languages at home
- 88% English-only · Spanish 8% Tagalog/Filipino 1% German/W. Germanic 1%
Political lean MEDSL · Comanche
- 2024 margin
- Strong R (+23.3) · D 37.4% · R 60.7% · Other 1.9%
- 2008→2024 swing
- -5.8pp toward R · 2008: -17.5pp · 2024: -23.3pp
- All cycles
- 2024: R+23.3 2020: R+20.1 2016: R+23.7 2012: R+17.0 2008: R+17.5
Not yet ingested
- Civics
- —
Market trends
- HPI YoY
- ▼ -0.71%
- Current HPI
- 172.4877
- Rent YoY
- ▲ 1.70%
- Metro
- Lawton, OK
- State GDP YoY
- ▲ 1.55%
- F500 in state
- 6
Industry mix (Fortune 500 HQ in OK)
| Industry | F500 HQs | Revenue |
|---|---|---|
| Energy | 3 | $48B |
|
||
Price history
1 event — show timeline
- 2026-06-04 Listed $85,000 LBRMLS
Property tax history
+2.3%/yrLatest (2025): $586 · +4.8% YoY. Source: county tax records.
Cash-flow waterfall
monthlySold comps — $/sqft
last 12 mo · ≤1 miLoading sold comps…