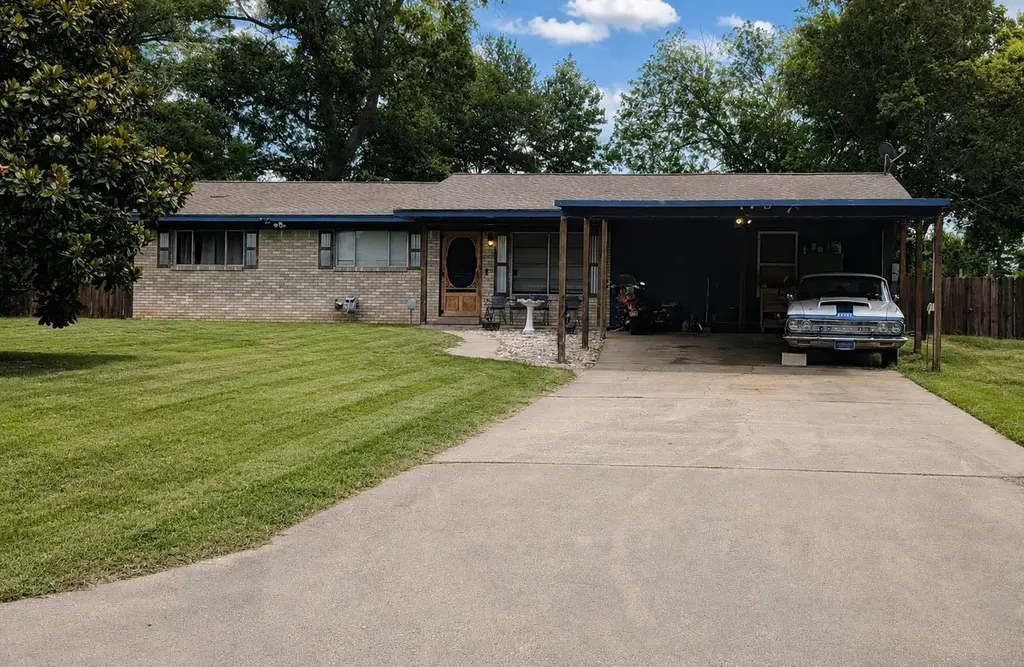
112 N Thomas Rd · White Oak, TX
Flood risk 1/10 · Minimal
- FEMA flood zone
- X (unshaded)
- Chance of flooding over 30 yrs
- 0.0%
- Est. flood insurance / yr
- $507 – $1,088
Fire risk 5/10 · Moderate
- Est. fire insurance / yr
- $1,222 – $2,270
Heat risk 7/10 · Major
- Hot days now (above 110°F)
- 7 days/yr
- Hot days in 30 yrs
- 25 days/yr
Wind risk 6/10 · Moderate
- Chance of severe wind over 30 yrs
- 51.0%
Air-quality risk 2/10 · Minimal
- Unhealthy air days now
- 0 days/yr
- Unhealthy air days in 30 yrs
- 1 days/yr
Risk factors via First Street. Map © Google.
Why this score? — see what drove the C+ grade
The composite is a weighted blend of 9 inputs, each scored 0–100. Each bar is that input's sub-score; the figure is the points it added to the 100-point composite (weight × sub-score).
- Cash flow +22.7/30.0
- ARV discount +15.0/15.0
- DSCR +7.3/10.0
- 1% rule +6.3/10.0
- Schools +4.3/10.0
- Livability +3.9/5.0
- Rent growth +2.5/5.0
- Condition / age +2.5/5.0
- Appreciation +0.0/10.0
$239,000
🖨 Deal sheet 📄 Offer letter ✓ Due diligence
Listing remarks
Full of character and appeal, this 4-bedroom, 2-bath home in White Oak offers a unique blend of comfort and style. Rich wood accents, warm finishes, and thoughtful updates throughout create a welcoming space that feels like home the moment you walk through the door. Designed for both everyday living and entertaining, the spacious floor plan provides flexibility for growing families and guest. The kitchen is a true standout, featuring upgraded appliances, ample workspace, and a design that blends functionality with character. The living area flows seamlessly into the heart of the home, where rustic details add charm and personality around every corner. Retreating to the primary suite, the be
Key facts
- 0.46 acre lot
- Pool
- Built 1967
Property features AI
Exterior
- Utilities: Natural gas available; Public sewer
- Home design: Single-family residential property
- Exterior features: Wood fencing; Above-ground outdoor private pool
Interior
- Bathrooms: 2 full bathrooms
- Heating & cooling: Central heating (natural gas); Central air conditioning
- Interior features: Gas water heater; 7 total rooms
Neighborhood map
What this means for you Summary
Snapshot
- This is a 3-bed/2.0-bath single-family listed at $239k.
Deal economics
- At list price, monthly cash flow is $412 ($5k/yr) — positive.
- The deal already cash-flows at list — no discount required.
- Meets the 1% rule at list price ($3k rent vs $239k).
Location & tenants
- Location reads 77/100 on livability (#82 in TX, #2,827 nationally) — a middle-class / working-renter tenant base. Strengths: crime A+, cost of living A+, housing A+; Watch: amenities F, commute F.
- White Oak ISD (suburban): math 51% / reading 48% proficiency, ranked #176 of 826 in TX (top 21%) — families likely to look elsewhere, expect single-tenant / working-renter base with shorter leases.
- Market conditions: 72 active listings in the ZIP; 1 comparable units currently listed for rent nearby; 193 units permitted in Gregg County in 2024 (0 in 5+ unit buildings).
Forward outlook
- Local home prices are declining (-3.0%/yr); year-one equity from $2k of loan paydown is wiped out by about $7k of value loss. Plan a longer hold.
Negotiation context
- Only 6 days on market — expect competitive offers; lowballing is unlikely to land.
Risks & watch-outs
- Climate carrying-cost: major wind risk, 51% chance of damaging wind over 30y; moderate wildfire risk; extreme-heat days projected 7→25/yr by 2055 (HVAC capex compounding) — expect insurance premiums to compound above CPI over the hold.
Questions for the listing agent
- Built in 1967 — when were the roof, HVAC, electrical panel, plumbing, and water heater last replaced?
- Is there a deadline driving the sale (1031 exchange, divorce, estate, relocation)? That informs how much negotiation room exists.
- Schools are B-rated — typically a magnet for longer-tenancy family renters. What's the average tenant stay here, and is there a school-zone premium baked into asking?
- What's the average days-on-market for RENTAL listings here right now (not sales)? A rising rental-DOM trend means longer vacancies and softer asking-rent achievability than the comps imply.
- What's the recent tenant-quality profile in this submarket — average credit score on applications, eviction rate, late-payment / NSF rate, and stable-employment percentage? A property-management company in the area should have these aggregated.
- How much new for-sale + rental construction is in the pipeline within 1–3 miles? Heavy new supply typically softens prices + rents 12–24 months out; constrained supply supports both.
Investment metrics
- 1% rule
- 1.13% ✓
- Cap rate
- 8.36%
- Cash-on-cash
- 7.38%
- DSCR
- 1.33
- GRM
- 7.4
CMA / ARV
- ARV (on-the-fly)
- $316,830
- Comps found
- 1
Show comp detail 1 sale within ~0.75 mi
| Address | Dist | Beds/Ba | Sqft | Sold | Price | $/sf | Match |
|---|---|---|---|---|---|---|---|
| 207 E Hillcrest | 0.36mi | 4/3.0 (+1) | 2,016 (+14%) | 11mo | $359,900 | $179 | 42 |
Match score weights: distance 35% · size 25% · config 20% · recency 20%. Top-matched comps best support the ARV.
Projected returns pro-forma
-3.0% appreciation · 3.0% rent growth · sell at horizon
- IRR
- -5.0%
- Equity multiple
- 0.81×
- Total profit
- $-12,417
- Equity at exit
- $35,636
- IRR
- 4.7%
- Equity multiple
- 1.35×
- Total profit
- $23,300
- Equity at exit
- $20,664
Cash invested: $66,920 (down + closing). Projections, not guarantees.
Landlord ↔ Tenant lean methodology
- Overall (STATE)
- 87 Strongly Landlord-Friendly
- State Texas
- 87 Strongly Landlord-Friendly · R+5
- County
- — inherits STATE
- City
- — inherits STATE
ZIP-level market 75693
- Home prices YoY
- -23.0%
- Active inventory
- 72
- Price-to-rent
- 7.4×
Monthly cashflow live
- Estimated rent
- $2,700 medium interval (Pro) →
- Mortgage (P&I)
- −$1,253
- Tax from tax record
- −$368 /mo · $4,419/yr
- Insurance
- −$100
- HOA
- −$0
- Vacancy / Maint / Mgmt
- −$567
- Net cashflow
- $412
Break-even live
UW: 25.0% down · 7.5% · 30yr · 1.5% tax · 5.0% vac · 8.0% maint · 8.0% mgmt
Financing live
Cash to close
- Down payment
- $59,750
- Closing costs
- $7,170
- Reserves months
- —
- Total cash needed
- —
Loan-product check · same deal, 3 products live
Conventional
25% down · 7.5% · 30yr
- Down + closing
- —
- Monthly P&I
- —
- Monthly cashflow
- —
- DSCR
- —
- Eligible?
- —
Personal DTI + credit; lowest rate.
DSCR
20% down · 8.5% · 30yr
- Down + closing
- —
- Monthly P&I
- —
- Monthly cashflow
- —
- DSCR
- —
- Eligible?
- —
No personal income docs; deal must DSCR.
Hard money
10% down · 12.0% · 12mo
- Down + closing
- —
- Monthly P&I
- —
- Monthly cashflow
- —
- DSCR
- —
- Eligible?
- —
Short-term bridge; refi at stabilization.
Rent comps 1 comps
| Address | Beds | Baths | Sqft | Rent | $/sqft | DOM | Units | Dist |
|---|---|---|---|---|---|---|---|---|
| 3001 Bull Run Trl Longview, TX | 3.0 | 2.0 | 2026 | $2,700 | $1.33 | 13d | 1 | 1.31mi |
Listing history 7 events
-
2026-06-19days on market $239,000 Active 6 DOM
-
2026-06-18days on market $239,000 Active 5 DOM
-
2026-06-17days on market $239,000 Active 4 DOM
-
2026-06-16days on market $239,000 Active 3 DOM
-
2026-06-15days on market $239,000 Active 2 DOM
-
2026-06-14remarks 699-char remark
-
2026-06-14$239,000 Active 1 DOM
ⓘ Source: listings_history table (triggers on properties + properties_extension) + one-shot
backfill from property_details.listing_events for pre-trigger history.
Tax reassessment forecast TX · Resets to sale price
- Current annual tax
- $4,419 · $368/mo
- Projected year-2 tax
- $4,419 · $368/mo
- Expected delta
- $0/yr ($0/mo · 0.0%)
ⓘ Screening estimate from a state-policy table — verify with the county assessor before closing.
Climate risk First Street
- Flood 1/10 Low FEMA zone X (unshaded) · 0% chance over 30 yrs
- Wildfire 5/10 Major
- Heat 7/10 Severe 7 d/yr ≥110°F today · 25 d/yr by 30 yrs out
- Wind 6/10 Major 51% chance of damaging wind over 30 yrs
- Air quality 2/10 Low 0 unhealthy d/yr today · 1 by 30 yrs out
Nearby sold comps map
Loading sold comps map…
Walkable amenities ~0.75 mi
Loading nearby amenities…
Taxation est. · year 1
- Rental income
- $32,400
- − Mortgage interest
- −$13,388
- − Property taxes
- −$4,419
- − Insurance
- −$1,195
- − Repairs & maintenance
- −$2,592
- − Management
- −$2,592
- − Depreciation
- −$6,953
- Taxable income
- $1,261
- Est. tax owed @ 24.0%
- −$303
- After-tax cash flow
- $4,639/yr
For passive investors: Depreciation is non-cash, so a rental often shows a tax loss while cash-flowing — sheltering income. Rental losses are passive: they offset passive income freely, and up to $25,000/yr can offset ordinary (W-2) income if you actively participate and your MAGI is under $100k (phasing out to $0 by $150k); unused losses carry forward. On sale, claimed depreciation is recaptured at up to 25%, and gains may owe capital-gains tax (a 1031 exchange can defer both). Figures are a year-1 estimate at your 24.0% rate — not tax advice; consult a CPA.
Schools (NCES district)
- District
- White Oak ISD
- NCES district ID
- 4845480
- Math proficiency
- 51% ▲ 1.00%
- Reading proficiency
- 48% ▼ -8.00%
- Median HH income
- $57,293
- Composite
- 43.09/100
- National rank
- #3088
- State rank
- #176 of 826 in TX
Livability — White Oak
- Score
- 77/100
- State rank
- #82
- US rank
- #2827
Category grades
Schools grade is shown separately in the Schools card above.
Census & demographics
- Census place
- White Oak, TX
- City population
- 5,915
- Population (ZIP)
- 5,915
Population outlook (Gregg County) Hauer SSP2
- Today (2025)
- 125,947 people
- By 2030
- 126,542 · +0.5%
- By 2040
- 127,311 · +1.1%
- By 2050
- 127,289 · +1.1%
- By 2075
- 124,954 · -0.8%
- By 2100
- 113,737 · -9.7%
Race, ethnicity, and origin ACS 2023
- Neighborhood character
- Predominantly White (72%)
- Race & ethnicity
- White 72% Two or more races 17% Hispanic / Latino 12% Black 6%
- Hispanic origin (detail)
- Mexican 12%
- Common ancestry
- Lithuanian 2% Slovak 1% Iranian 1%
- Foreign-born
- 1% · Canada
- Languages at home
- 99% English-only · Spanish 1%
Political lean MEDSL · Gregg
- 2024 margin
- Solid R (+42.2) · D 28.5% · R 70.7%
- 2008→2024 swing
- -4.6pp toward R · 2008: -37.6pp · 2024: -42.2pp
- All cycles
- 2024: R+42.2 2020: R+36.9 2016: R+41.3 2012: R+39.5 2008: R+37.6
Not yet ingested
- Civics
- —
Market trends
- HPI YoY
- ▼ -75.10%
- Current HPI
- 250.8482
- Rent YoY
- —
- Metro
- —
- State GDP YoY
- ▲ 3.95%
- F500 in state
- 110
Industry mix (Fortune 500 HQ in TX)
| Industry | F500 HQs | Revenue |
|---|---|---|
| Energy | 16 | $1,198B |
|
||
| Technology | 5 | $198B |
|
||
| Engineering / Construction | 4 | $72B |
|
||
| Energy Services | 3 | $60B |
|
||
| Utilities | 3 | $41B |
|
||
| Healthcare | 2 | $330B |
|
||
Price history
3 events — show timeline
- 2026-06-13 Listed $239,000 LAAR
- 2015-10-29 Sold (Public Records) — Public Records
- 1997-11-17 Sold (Public Records) — Public Records
Property tax history
+5.7%/yrLatest (2025): $4,419 · +9.1% YoY. Source: county tax records.
Cash-flow waterfall
monthlySold comps — $/sqft
last 12 mo · ≤1 miLoading sold comps…