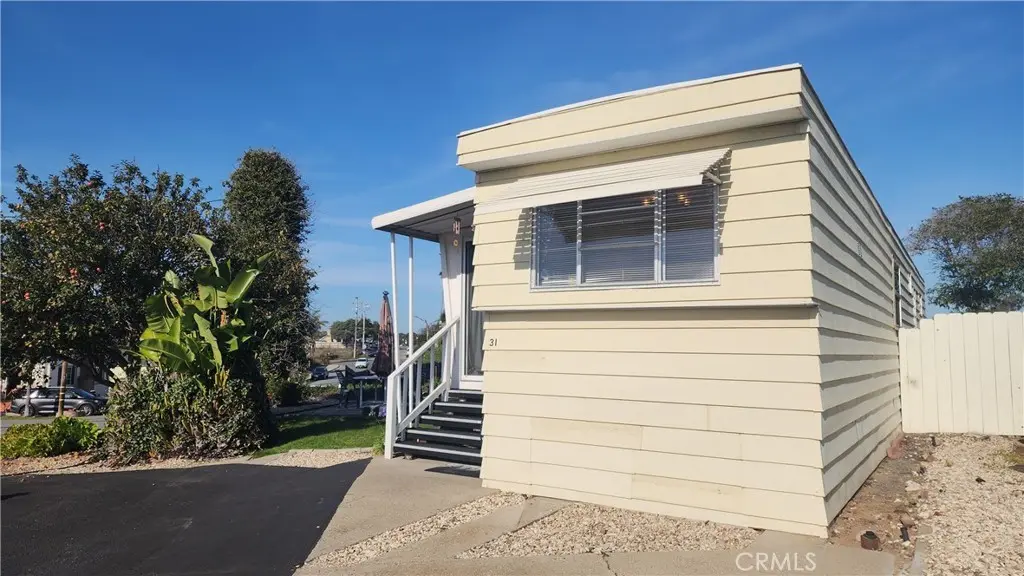
2531 Cienaga St #31 · Oceano, CA
Flood risk 1/10 · Minimal
- FEMA flood zone
- X (unshaded)
- Chance of flooding over 30 yrs
- 0.0%
- Est. flood insurance / yr
- $507 – $1,088
Fire risk 4/10 · Minor
- Est. fire insurance / yr
- $659 – $1,223
Heat risk 5/10 · Moderate
- Hot days now (above 80°F)
- 7 days/yr
- Hot days in 30 yrs
- 16 days/yr
Wind risk 1/10 · Minimal
- Chance of severe wind over 30 yrs
- —
Air-quality risk 6/10 · Moderate
- Unhealthy air days now
- 9 days/yr
- Unhealthy air days in 30 yrs
- 10 days/yr
Risk factors via First Street. Map © Google.
Why this score? — see what drove the C+ grade
The composite is a weighted blend of 9 inputs, each scored 0–100. Each bar is that input's sub-score; the figure is the points it added to the 100-point composite (weight × sub-score).
- Cash flow +26.3/30.0
- DSCR +8.9/10.0
- ARV discount +7.9/15.0
- 1% rule +7.0/10.0
- Schools +4.5/10.0
- Livability +3.3/5.0
- Rent growth +2.5/5.0
- Condition / age +2.5/5.0
- Appreciation +0.0/10.0
$185,000
🖨 Deal sheet 📄 Offer letter ✓ Due diligence
Listing remarks
Welcome to the Casa Del Rey 55+ community. Explore the amenities such as the pool, spa, and outdoor common area for your leisure. Corner lot with lots of backyard space and outdoor patio seating. Featuring 2 bedrooms & 1 full bathroom with separate laundry room/office. Just a 6 minute drive to the Oceano dunes & Beach. Down the street from restaurants and shopping. Schedule your showing today with your favorite realtor.
Key facts
- Spa
- Pool
- Outdoor common area
Tags
Neighborhood map
What this means for you Summary
Snapshot
- This is a 2-bed/1.0-bath manufactured listed at $185k.
Deal economics
- At list price, monthly cash flow is $477 ($6k/yr) — positive.
- The deal already cash-flows at list — no discount required.
- Meets the 1% rule at list price ($2k rent vs $185k).
- Cap rate 9.4% vs local median 2.5% in Oceano — top-decile yield for the area; either an underpriced asset or a hidden risk that comps aren't pricing in. Stress-test before assuming the spread holds.
Location & tenants
- Location reads 66/100 on livability (#346 in CA) — a middle-class / working-renter tenant base. Strengths: employment A, health & safety A, housing B; Watch: crime D, amenities D, schools F.
- Lucia Mar Unified (town): math 42% / reading 56% proficiency, ranked #433 of 1,400 in CA (top 31%) — families likely to look elsewhere, expect single-tenant / working-renter base with shorter leases.
- Market conditions: 36 active listings in the ZIP; 9 comparable units currently listed for rent nearby; rentals at typical pace (median 23d on market — plan ~3-4 weeks tenant-placement turnaround); 44% of comp listings sitting > 30 days — soft ceiling on asking rent; 1,104 units permitted in San Luis Obispo County in 2024 (273 in 5+ unit buildings).
Forward outlook
- Local home prices are declining (-3.0%/yr); year-one equity from $1k of loan paydown is wiped out by about $6k of value loss. Plan a longer hold.
- San Luis Obispo County population projected at +20% by 2050 — long-run rental-demand tailwind backs the buy-and-hold thesis.
- At projected returns (-3.0% appreciation + 3.0% rent growth), your $52k cash investment doubles in ~10 years — after that, you're playing with house money.
Negotiation context
- Only 8 days on market — expect competitive offers; lowballing is unlikely to land.
- 14 sale attempts since 31y ago; this cycle's ask has dropped $12k (6%) from the opening price — seller is motivated, your offer sets the floor, not the list.
Risks & watch-outs
- Climate carrying-cost: extreme-heat days projected 7→16/yr by 2055 (HVAC capex compounding) — expect insurance premiums to compound above CPI over the hold.
Questions for the listing agent
- Built in 1960 — when were the roof, HVAC, electrical panel, plumbing, and water heater last replaced?
- Is there a deadline driving the sale (1031 exchange, divorce, estate, relocation)? That informs how much negotiation room exists.
- Schools are F-rated, which usually means shorter tenancies and higher turnover. Who's the typical renter profile here, and what's been the actual vacancy rate?
- Crime grade is D in this area — have there been break-ins, vandalism, or insurance claims at this property in the last 3 years? What carrier currently insures it and at what premium?
- What's the average days-on-market for RENTAL listings here right now (not sales)? A rising rental-DOM trend means longer vacancies and softer asking-rent achievability than the comps imply.
- What's the recent tenant-quality profile in this submarket — average credit score on applications, eviction rate, late-payment / NSF rate, and stable-employment percentage? A property-management company in the area should have these aggregated.
- How much new for-sale + rental construction is in the pipeline within 1–3 miles? Heavy new supply typically softens prices + rents 12–24 months out; constrained supply supports both.
Investment metrics
- 1% rule
- 1.20% ✓
- Cap rate
- 9.39%
- Cash-on-cash
- 11.05%
- DSCR
- 1.49
- GRM
- 6.9
CMA / ARV
- ARV (median comp)
- $186,468
- List price
- $185,000
- Delta
- 5.65%
- Verdict
- FAIR
- Comps
- 20 within 1.0 mi
Show comp detail 5 sales within ~0.75 mi
| Address | Dist | Beds/Ba | Sqft | Sold | Price | $/sf | Match |
|---|---|---|---|---|---|---|---|
| 2531 Cienaga St #28 | 0.00mi | 2/2.0 | 750 (-1%) | 10mo | $164,000 | $219 | 86 |
| 2300 Cienaga #36 | 0.25mi | 2/2.0 | 720 (-5%) | 5mo | $250,000 | $347 | 72 |
| 2531 Cienaga St #39 | 0.00mi | 2/1.0 | 700 (-7%) | 24mo | $209,900 | $300 | 68 |
| 1241 Farroll Ave #58 | 0.71mi | 2/1.0 | 696 (-8%) | 8mo | $155,000 | $223 | 47 |
| 1623 23rd St #6 | 0.29mi | 2/2.0 | 864 (+14%) | 17mo | $255,000 | $295 | 45 |
Match score weights: distance 35% · size 25% · config 20% · recency 20%. Top-matched comps best support the ARV.
Projected returns pro-forma
-3.0% appreciation · 3.0% rent growth · sell at horizon
- IRR
- 0.2%
- Equity multiple
- 1.01×
- Total profit
- $425
- Equity at exit
- $27,584
- IRR
- 9.9%
- Equity multiple
- 1.76×
- Total profit
- $39,611
- Equity at exit
- $15,995
Cash invested: $51,800 (down + closing). Projections, not guarantees.
Landlord ↔ Tenant lean methodology
- Overall (STATE)
- 18 Strongly Tenant-Friendly
- State California
- 18 Strongly Tenant-Friendly · D+13
- County
- — inherits STATE
- City
- — inherits STATE
ZIP-level market 93445
- Home prices YoY
- -24.0%
- Active inventory
- 36
- Price-to-rent
- 6.9×
Monthly cashflow live
- Estimated rent
- $2,222 high interval (Pro) →
- Mortgage (P&I)
- −$970
- Tax est. 1.5%
- −$231 /mo · $2,775/yr
- Insurance
- −$77
- HOA
- −$0
- Vacancy / Maint / Mgmt
- −$467
- Net cashflow
- $477
Break-even live
UW: 25.0% down · 7.5% · 30yr · 1.5% tax · 5.0% vac · 8.0% maint · 8.0% mgmt
Financing live
Cash to close
- Down payment
- $46,250
- Closing costs
- $5,550
- Reserves months
- —
- Total cash needed
- —
Loan-product check · same deal, 3 products live
Conventional
25% down · 7.5% · 30yr
- Down + closing
- —
- Monthly P&I
- —
- Monthly cashflow
- —
- DSCR
- —
- Eligible?
- —
Personal DTI + credit; lowest rate.
DSCR
20% down · 8.5% · 30yr
- Down + closing
- —
- Monthly P&I
- —
- Monthly cashflow
- —
- DSCR
- —
- Eligible?
- —
No personal income docs; deal must DSCR.
Hard money
10% down · 12.0% · 12mo
- Down + closing
- —
- Monthly P&I
- —
- Monthly cashflow
- —
- DSCR
- —
- Eligible?
- —
Short-term bridge; refi at stabilization.
Rent comps 9 comps
| Address | Beds | Baths | Sqft | Rent | $/sqft | DOM | Units | Dist |
|---|---|---|---|---|---|---|---|---|
| 2531 Cienaga St #13 Oceano, CA | 2.0 | 2.0 | 800 | $1,995 | $2.49 | 23d | 1 | 0.04mi |
| 1247 Driftwood St Grover Beach, CA | 2.0 | 2.0 | 1090 | $2,600 | $2.39 | 23d | 1 | 0.67mi |
| 1451 16th St Oceano, CA | 2.0 | 2.0 | 928 | $2,800 | $3.02 | 43d | 1 | 0.74mi |
| 314 S Halcyon Rd Arroyo Grande, CA | 2.0 | 1.0 | 780 | $2,650 | $3.40 | 43d | 1 | 1.18mi |
| 312 S Halcyon Rd Unit B Arroyo Grande, CA | 2.0 | 2.0 | 900 | $3,000 | $3.33 | 43d | 1 | 1.18mi |
| 198 S Elm St Unit C Arroyo Grande, CA | 2.0 | 1.0 | 900 | $2,375 | $2.64 | 23d | 1 | 1.21mi |
| 976 S 13th St Apt B Grover Beach, CA | 2.0 | 1.5 | 944 | $2,050 | $2.17 | 23d | 1 | 1.27mi |
| 1036 Baden Ave Grover Beach, CA | 2.0 | 1.0 | 900 | $1,995 | $2.22 | 43d | 1 | 1.41mi |
| 251 S Oak Park Blvd Grover Beach, CA | 2.0 | 2.0 | 908 | $2,840 | $3.13 | 13d | 1 | 1.45mi |
Listing history 49 events
-
2026-06-18days on market $185,000 Active 8 DOM
-
2026-06-17days on market $185,000 Active 7 DOM
-
2026-06-16days on market $185,000 Active 6 DOM
-
2026-06-15days on market $185,000 Active 5 DOM
-
2026-06-14days on market $185,000 Active 3 DOM
-
2026-06-13pricedays on market $185,000 Active 2 DOM
-
2026-06-10days on market $197,000 Active 132 DOM
-
2026-06-09days on market $197,000 Active 131 DOM
-
2026-06-08days on market $197,000 Active 130 DOM
-
2026-06-07days on market $197,000 Active 129 DOM
-
2026-06-03days on market $197,000 Active 125 DOM
-
2026-06-02days on market $197,000 Active 124 DOM
-
2026-06-01days on market $197,000 Active 123 DOM
-
2026-05-31days on market $197,000 Active 122 DOM
-
2026-05-30days on market $197,000 Active 121 DOM
-
2026-04-30historical
-
2026-04-30historical
-
2026-03-19status Active
-
2026-03-19status Active
-
2026-03-19status Active
-
2026-01-26historical
-
2026-01-26historical
-
2026-01-26historical
-
2025-12-09price $197,000
-
2025-12-08$19,700 Active
-
2025-12-08$197,000 Active
-
2025-12-08$197,000 Active
-
2024-03-21historical
-
2024-03-21historical
-
2024-03-21historical
-
2024-01-03price $185,500
-
2024-01-03price $185,500
-
2024-01-02price $185,500
-
2023-09-25$197,500 Active
-
2023-09-21$197,500 Active
-
2023-09-18$197,500 Active
-
2023-07-01historical
-
2023-05-23historical
-
2023-05-23historical
-
2022-10-13price $197,500
-
2022-10-13price $197,500
-
2022-10-13price $197,500
-
2022-08-11$210,000 Active
-
2022-08-10$210,000 Active
-
2022-08-10$210,000 Active
-
2017-04-07historical
-
1995-05-13historical
-
1995-02-13$31,500
-
1995-02-13$31,500
ⓘ Source: listings_history table (triggers on properties + properties_extension) + one-shot
backfill from property_details.listing_events for pre-trigger history.
Climate risk First Street
- Flood 1/10 Low FEMA zone X (unshaded) · 0% chance over 30 yrs
- Wildfire 4/10 Moderate
- Heat 5/10 Major 7 d/yr ≥80°F today · 16 d/yr by 30 yrs out
- Wind 1/10 Low
- Air quality 6/10 Major 9 unhealthy d/yr today · 10 by 30 yrs out
Nearby sold comps map
Loading sold comps map…
Walkable amenities ~0.75 mi
Loading nearby amenities…
Taxation est. · year 1
- Rental income
- $26,663
- − Mortgage interest
- −$10,363
- − Property taxes
- −$2,775
- − Insurance
- −$925
- − Repairs & maintenance
- −$2,133
- − Management
- −$2,133
- − Depreciation
- −$5,382
- Taxable income
- $2,952
- Est. tax owed @ 24.0%
- −$709
- After-tax cash flow
- $5,013/yr
For passive investors: Depreciation is non-cash, so a rental often shows a tax loss while cash-flowing — sheltering income. Rental losses are passive: they offset passive income freely, and up to $25,000/yr can offset ordinary (W-2) income if you actively participate and your MAGI is under $100k (phasing out to $0 by $150k); unused losses carry forward. On sale, claimed depreciation is recaptured at up to 25%, and gains may owe capital-gains tax (a 1031 exchange can defer both). Figures are a year-1 estimate at your 24.0% rate — not tax advice; consult a CPA.
Schools (NCES district)
- District
- Lucia Mar Unified
- NCES district ID
- 0623080
- Math proficiency
- 42% ▲ 3.00%
- Reading proficiency
- 56% ▲ 2.00%
- Median HH income
- $62,681
- Composite
- 45.19/100
- National rank
- #5782
- State rank
- #433 of 1400 in CA
Livability — Oceano
- Score
- 66/100
- State rank
- #346
- US rank
- #11833
Category grades
Schools grade is shown separately in the Schools card above.
Census & demographics
- Census place
- Oceano, CA
- Population (ZIP)
- 6,812
Population outlook (San Luis Obispo County) Hauer SSP2
- Today (2025)
- 306,977 people
- By 2030
- 320,378 · +4.4%
- By 2040
- 343,933 · +12.0%
- By 2050
- 366,853 · +19.5%
- By 2075
- 428,329 · +39.5%
- By 2100
- 460,687 · +50.1%
Race, ethnicity, and origin ACS 2023
- Neighborhood character
- Diverse neighborhood (Simpson 0.55)
- Race & ethnicity
- White 51% Hispanic / Latino 44% Two or more races 17% Black 1%
- Hispanic origin (detail)
- Mexican 41% Puerto Rican 1%
- Common ancestry
- Slovak 2% Portuguese 2% Iranian 2%
- Foreign-born
- 17% · Canada
- Languages at home
- 71% English-only · Spanish 28%
Political lean MEDSL · San Luis Obispo
- 2024 margin
- D (+10.9) · D 53.9% · R 43.1% · Other 3.0%
- 2008→2024 swing
- +5.5pp toward D · 2008: 5.4pp · 2024: 10.9pp
- All cycles
- 2024: D+10.9 2020: D+13.1 2016: D+8.3 2012: D+1.0 2008: D+5.4
Not yet ingested
- Civics
- —
Market trends
- HPI YoY
- ▼ -124.63%
- Current HPI
- 394.4039
- Rent YoY
- —
- Metro
- —
- State GDP YoY
- ▲ 3.21%
- F500 in state
- 116
Industry mix (Fortune 500 HQ in CA)
| Industry | F500 HQs | Revenue |
|---|---|---|
| Technology | 27 | $1,492B |
|
||
| Financial Services | 3 | $174B |
|
||
| Retail | 3 | $44B |
|
||
| Insurance | 3 | $26B |
|
||
| Media / Entertainment | 2 | $115B |
|
||
| Pharmaceuticals / Biotech | 2 | $62B |
|
||
Price history
+525.4% since first listed34 events — show timeline
- 2026-04-30 Listing Removed — NSBCRMLS
- 2026-04-30 Listing Removed — SBMLS
- 2026-03-19 Relisted — CRMLS
- 2026-03-19 Relisted — SBMLS
- 2026-03-19 Relisted — NSBCRMLS
- 2026-01-26 Listing Removed — CRMLS
- 2026-01-26 Listing Removed — NSBCRMLS
- 2026-01-26 Listing Removed — SBMLS
- 2025-12-09 Price Changed $197,000 SBMLS
- 2025-12-08 Listed $197,000 CRMLS
- 2025-12-08 Listed $197,000 NSBCRMLS
- 2025-12-08 Listed $19,700 SBMLS
- 2024-03-21 Listing Removed — CRMLS
- 2024-03-21 Listing Removed — SBMLS
- 2024-03-21 Listing Removed — NSBCRMLS
- 2024-01-03 Price Changed $185,500 SBMLS
- 2024-01-03 Price Changed $185,500 NSBCRMLS
- 2024-01-02 Price Changed $185,500 CRMLS
- 2023-09-25 Listed $197,500 SBMLS
- 2023-09-21 Listed $197,500 CRMLS
- 2023-09-18 Listed $197,500 NSBCRMLS
- 2023-07-01 Listing Removed — SBMLS
- 2023-05-23 Listing Removed — CRMLS
- 2023-05-23 Listing Removed — NSBCRMLS
- 2022-10-13 Price Changed $197,500 SBMLS
- 2022-10-13 Price Changed $197,500 NSBCRMLS
- 2022-10-13 Price Changed $197,500 CRMLS
- 2022-08-11 Listed $210,000 CRMLS
- 2022-08-10 Listed $210,000 SBMLS
- 2022-08-10 Listed $210,000 NSBCRMLS
- 2017-04-07 Listing Removed — NSBCRMLS
- 1995-05-13 Listing Removed — CRMLS
- 1995-02-13 Listed $31,500 CRMLS
- 1995-02-13 Listed $31,500 NSBCRMLS
Cash-flow waterfall
monthlySold comps — $/sqft
last 12 mo · ≤1 miLoading sold comps…