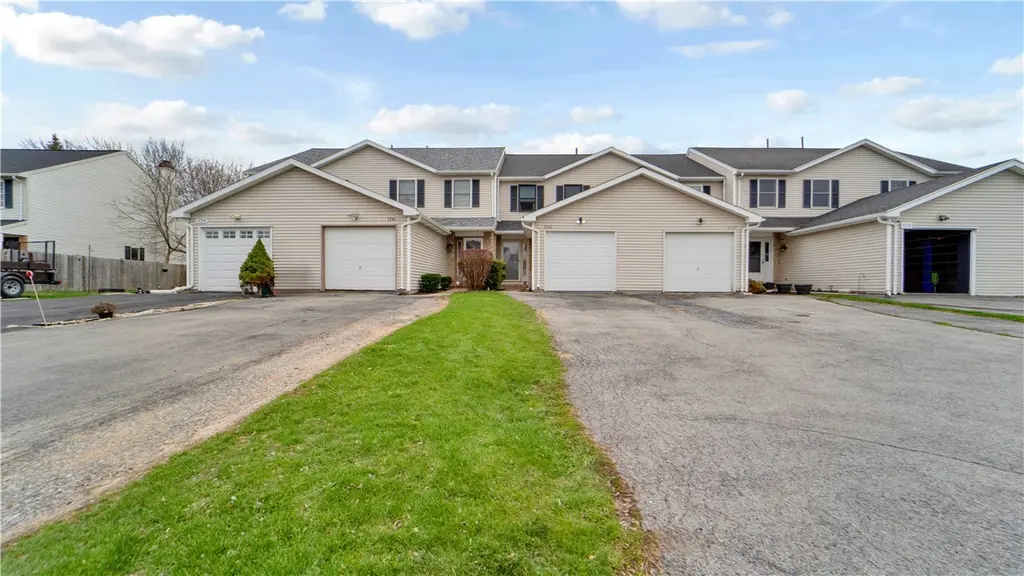
5743 Running Brook Rd · Victor, NY
Flood risk 1/10 · Minimal
- FEMA flood zone
- X
- Chance of flooding over 30 yrs
- 0.0%
- Est. flood insurance / yr
- $473 – $860
Fire risk 2/10 · Minimal
- Est. fire insurance / yr
- $691 – $1,283
Heat risk 2/10 · Minimal
- Hot days now (above 95°F)
- 7 days/yr
- Hot days in 30 yrs
- 16 days/yr
Wind risk 1/10 · Minimal
- Chance of severe wind over 30 yrs
- —
Air-quality risk 2/10 · Minimal
- Unhealthy air days now
- 1 days/yr
- Unhealthy air days in 30 yrs
- 1 days/yr
Risk factors via First Street. Map © Google.
Why this score? — see what drove the C+ grade
The composite is a weighted blend of 9 inputs, each scored 0–100. Each bar is that input's sub-score; the figure is the points it added to the 100-point composite (weight × sub-score).
- Cash flow +23.2/30.0
- ARV discount +9.4/15.0
- DSCR +7.5/10.0
- 1% rule +5.9/10.0
- Schools +5.2/10.0
- Livability +4.0/5.0
- Rent growth +2.5/5.0
- Condition / age +2.5/5.0
- Appreciation +0.0/10.0
$224,900
🖨 Deal sheet 📄 Offer letter ✓ Due diligence
Listing remarks MLS
MOVE RIGHT INTO THIS 3 Bedrm 1.5 Bath Townhome w/ NO HOA Fees! Fresh, Neutral Decor & Updates Thru-out This Open Concept Floor Plan. Generous Cabinet Space In Kitchen Which Includes All Appliances, Offers Spacious Eat-In Area & Opens to HUGE Living Rm w/ Sliders To Back Deck w/ Deep, Tree-Lined Backyard. 1/2 Bath & Access To 1 Car Attached Garage Complete 1st Floor. Upstairs The Nice-Sized Master Offers Double Closets & Well Maintained Carpet Continues Into Both 2nd & 3rd Bedrms. Washer & Dryer Included & Dry Basement Great Bonus Space! * NEW ROOF * CENTRAL AIR * VICTOR SCHOOLS * Don't Miss This One!
Key facts
- Open-concept design
- Private deck
- Garage
Tags
Neighborhood map
What this means for you Summary
Snapshot
- This is a 3-bed/1.5-bath townhouse listed at $225k.
Deal economics
- At list price, monthly cash flow is $408 ($5k/yr) — positive.
- The deal already cash-flows at list — no discount required.
- Meets the 1% rule at list price ($2k rent vs $225k).
- Cap rate 8.5% vs local median 2.6% in Victor — top-decile yield for the area; either an underpriced asset or a hidden risk that comps aren't pricing in. Stress-test before assuming the spread holds.
Location & tenants
- Location reads 79/100 on livability (#122 in NY, #1,991 nationally) — a middle-class / working-renter tenant base. Strengths: schools A+, employment A+, housing A+; Watch: amenities F, commute F.
- Victor Central School District (suburban): math 56% / reading 62% proficiency, ranked #222 of 590 in NY (top 38%) — acceptable for families but not a draw, mixed tenant base, ~2y average lease; only 12% free/reduced lunch — higher-income household profile.
- Market conditions: 72 active listings in the ZIP; 1 comparable units currently listed for rent nearby; solid renter incomes; 284 units permitted in Ontario County in 2024 (69 in 5+ unit buildings).
- This rent runs 31% of the median local income ($95k/yr) — at the standard rent-burdened threshold; future hikes will face affordability resistance.
Forward outlook
- Local home prices are declining (-3.0%/yr); year-one equity from $2k of loan paydown is wiped out by about $7k of value loss. Plan a longer hold.
- Ontario County population projected to shrink 6% by 2050 — rents likely to lag national; underwrite the cash flow, not the appreciation.
Negotiation context
- Only 13 days on market — expect competitive offers; lowballing is unlikely to land.
- 2 sale attempts since 11y ago with the ask held roughly flat each time — persistent listings suggest the price (not the market) is what's stuck; bring a comps-based counter.
- Current owner paid $115k; list at $225k implies a 96% gain — meaningful room to come down on a strong offer.
Questions for the listing agent
- Is there a deadline driving the sale (1031 exchange, divorce, estate, relocation)? That informs how much negotiation room exists.
- Schools are A-rated — typically a magnet for longer-tenancy family renters. What's the average tenant stay here, and is there a school-zone premium baked into asking?
- What's the average days-on-market for RENTAL listings here right now (not sales)? A rising rental-DOM trend means longer vacancies and softer asking-rent achievability than the comps imply.
- What's the recent tenant-quality profile in this submarket — average credit score on applications, eviction rate, late-payment / NSF rate, and stable-employment percentage? A property-management company in the area should have these aggregated.
- How much new for-sale + rental construction is in the pipeline within 1–3 miles? Heavy new supply typically softens prices + rents 12–24 months out; constrained supply supports both.
Investment metrics
- 1% rule
- 1.09% ✓
- Cap rate
- 8.47%
- Cash-on-cash
- 7.77%
- DSCR
- 1.35
- GRM
- 7.7
CMA / ARV
- ARV (on-the-fly)
- $235,008
- Comps found
- 12
Show comp detail 12 sales within ~0.75 mi
| Address | Dist | Beds/Ba | Sqft | Sold | Price | $/sf | Match |
|---|---|---|---|---|---|---|---|
| 5743 Running Brook Rd | 0.00mi | 3/1.5 | 1,152 (0%) | 0mo | $235,000 | $204 | 100 |
| 5745 Running Brook Rd | 0.00mi | 2/1.5 (-1) | 1,152 (0%) | 3mo | $220,000 | $191 | 92 |
| 5666 Running Brook Rd | 0.20mi | 3/1.5 | 1,152 (0%) | 11mo | $220,000 | $191 | 82 |
| 5752 Running Brook Rd | 0.05mi | 2/2.0 (-1) | 1,254 (+9%) | 12mo | $260,000 | $207 | 66 |
| 5711 Running Brook Rd | 0.08mi | 3/1.5 | 1,296 (+12%) | 13mo | $260,000 | $201 | 65 |
| 12 Carriage Ct | 0.57mi | 3/1.5 | 1,200 (+4%) | 3mo | $200,000 | $167 | 64 |
| 5687 Running Brook Rd | 0.14mi | 3/1.5 | 1,296 (+12%) | 12mo | $248,515 | $192 | 63 |
| 5665 Running Brook Rd | 0.19mi | 3/1.5 | 1,024 (-11%) | 16mo | $219,900 | $215 | 60 |
| 5661 Running Brook Rd | 0.20mi | 2/1.5 (-1) | 1,024 (-11%) | 13mo | $236,000 | $230 | 56 |
| 5659 Running Brook Rd | 0.20mi | 2/1.5 (-1) | 1,024 (-11%) | 14mo | $221,000 | $216 | 56 |
| 15 Farmbrook Dr | 0.56mi | 3/1.5 | 1,008 (-12%) | 2mo | $225,000 | $223 | 52 |
| 16 Carriage Ct | 0.57mi | 3/1.5 | 1,008 (-12%) | 14mo | $177,000 | $176 | 41 |
Match score weights: distance 35% · size 25% · config 20% · recency 20%. Top-matched comps best support the ARV.
Projected returns pro-forma
-3.0% appreciation · 3.0% rent growth · sell at horizon
- IRR
- -4.4%
- Equity multiple
- 0.83×
- Total profit
- $-10,443
- Equity at exit
- $33,533
- IRR
- 5.3%
- Equity multiple
- 1.39×
- Total profit
- $24,435
- Equity at exit
- $19,445
Cash invested: $62,972 (down + closing). Projections, not guarantees.
Landlord ↔ Tenant lean methodology
- Overall (STATE)
- 15 Strongly Tenant-Friendly
- State New York
- 15 Strongly Tenant-Friendly · D+10
- County
- — inherits STATE
- City
- — inherits STATE
ZIP-level market 14425
- Home prices YoY
- -15.1%
- Active inventory
- 72
- Price-to-rent
- 7.7×
Monthly cashflow live
- Estimated rent
- $2,444 medium interval (Pro) →
- Mortgage (P&I)
- −$1,179
- Tax from tax record
- −$249 /mo · $2,994/yr
- Insurance
- −$94
- HOA
- −$0
- Vacancy / Maint / Mgmt
- −$513
- Net cashflow
- $408
Break-even live
UW: 25.0% down · 7.5% · 30yr · 1.5% tax · 5.0% vac · 8.0% maint · 8.0% mgmt
Financing live
Cash to close
- Down payment
- $56,225
- Closing costs
- $6,747
- Reserves months
- —
- Total cash needed
- —
Loan-product check · same deal, 3 products live
Conventional
25% down · 7.5% · 30yr
- Down + closing
- —
- Monthly P&I
- —
- Monthly cashflow
- —
- DSCR
- —
- Eligible?
- —
Personal DTI + credit; lowest rate.
DSCR
20% down · 8.5% · 30yr
- Down + closing
- —
- Monthly P&I
- —
- Monthly cashflow
- —
- DSCR
- —
- Eligible?
- —
No personal income docs; deal must DSCR.
Hard money
10% down · 12.0% · 12mo
- Down + closing
- —
- Monthly P&I
- —
- Monthly cashflow
- —
- DSCR
- —
- Eligible?
- —
Short-term bridge; refi at stabilization.
Rent comps 1 comps
| Address | Beds | Baths | Sqft | Rent | $/sqft | DOM | Units | Dist |
|---|---|---|---|---|---|---|---|---|
| 1188 Barry Pl Farmington, NY | 1.0–3.0 | 1.0–2.5 | 1072 | $2,675 | $2.50 | 2d | 12 | 0.97mi |
Listing history 9 events
-
2026-04-28status Pending
-
2026-04-15$224,900 Active
-
2015-11-16historical 651-char remark
Show marketing remark (651 chars)
MOVE RIGHT INTO THIS 3 Bedrm 1.5 Bath Townhome w/ NO HOA Fees! Fresh, Neutral Decor & Updates Thru-out This Open Concept Floor Plan. Generous Cabinet Space In Kitchen Which Includes All Appliances, Offers Spacious Eat-In Area & Opens to HUGE Living Rm w/ Sliders To Back Deck w/ Deep, Tree-Lined Backyard. 1/2 Bath & Access To 1 Car Attached Garage Complete 1st Floor. Upstairs The Nice-Sized Master Offers Double Closets & Well Maintained Carpet Continues Into Both 2nd & 3rd Bedrms. Washer & Dryer Included & Dry Basement Great Bonus Space! * NEW ROOF * CENTRAL AIR * VICTOR SCHOOLS * Don't Miss This One!
-
2015-11-12soldstatus $114,945
-
2015-11-11soldstatus $118,500 651-char remark
Show marketing remark (651 chars)
MOVE RIGHT INTO THIS 3 Bedrm 1.5 Bath Townhome w/ NO HOA Fees! Fresh, Neutral Decor & Updates Thru-out This Open Concept Floor Plan. Generous Cabinet Space In Kitchen Which Includes All Appliances, Offers Spacious Eat-In Area & Opens to HUGE Living Rm w/ Sliders To Back Deck w/ Deep, Tree-Lined Backyard. 1/2 Bath & Access To 1 Car Attached Garage Complete 1st Floor. Upstairs The Nice-Sized Master Offers Double Closets & Well Maintained Carpet Continues Into Both 2nd & 3rd Bedrms. Washer & Dryer Included & Dry Basement Great Bonus Space! * NEW ROOF * CENTRAL AIR * VICTOR SCHOOLS * Don't Miss This One!
-
2015-08-19$118,500 651-char remark
Show marketing remark (651 chars)
MOVE RIGHT INTO THIS 3 Bedrm 1.5 Bath Townhome w/ NO HOA Fees! Fresh, Neutral Decor & Updates Thru-out This Open Concept Floor Plan. Generous Cabinet Space In Kitchen Which Includes All Appliances, Offers Spacious Eat-In Area & Opens to HUGE Living Rm w/ Sliders To Back Deck w/ Deep, Tree-Lined Backyard. 1/2 Bath & Access To 1 Car Attached Garage Complete 1st Floor. Upstairs The Nice-Sized Master Offers Double Closets & Well Maintained Carpet Continues Into Both 2nd & 3rd Bedrms. Washer & Dryer Included & Dry Basement Great Bonus Space! * NEW ROOF * CENTRAL AIR * VICTOR SCHOOLS * Don't Miss This One!
-
2007-11-02soldstatus $95,900
-
2003-08-28soldstatus $101,000
-
1996-10-31soldstatus $81,900
ⓘ Source: listings_history table (triggers on properties + properties_extension) + one-shot
backfill from property_details.listing_events for pre-trigger history.
Tax reassessment forecast NY · Partial reset (capped growth)
- Current annual tax
- $2,994 · $249/mo
- Projected year-2 tax
- $3,397 · $283/mo
- Expected delta
- +$404/yr (+$34/mo · 13.5%)
ⓘ Screening estimate from a state-policy table — verify with the county assessor before closing.
Climate risk First Street
- Flood 1/10 Low FEMA zone X · 0% chance over 30 yrs
- Wildfire 2/10 Low
- Heat 2/10 Low 7 d/yr ≥95°F today · 16 d/yr by 30 yrs out
- Wind 1/10 Low
- Air quality 2/10 Low 1 unhealthy d/yr today · 1 by 30 yrs out
Nearby sold comps map
Loading sold comps map…
Walkable amenities ~0.75 mi
Loading nearby amenities…
Taxation est. · year 1
- Rental income
- $29,325
- − Mortgage interest
- −$12,598
- − Property taxes
- −$2,994
- − Insurance
- −$1,124
- − Repairs & maintenance
- −$2,346
- − Management
- −$2,346
- − Depreciation
- −$6,543
- Taxable income
- $1,374
- Est. tax owed @ 24.0%
- −$330
- After-tax cash flow
- $4,566/yr
For passive investors: Depreciation is non-cash, so a rental often shows a tax loss while cash-flowing — sheltering income. Rental losses are passive: they offset passive income freely, and up to $25,000/yr can offset ordinary (W-2) income if you actively participate and your MAGI is under $100k (phasing out to $0 by $150k); unused losses carry forward. On sale, claimed depreciation is recaptured at up to 25%, and gains may owe capital-gains tax (a 1031 exchange can defer both). Figures are a year-1 estimate at your 24.0% rate — not tax advice; consult a CPA.
Schools (NCES district)
- District
- Victor Central School District
- NCES district ID
- 3629640
- Math proficiency
- 56% ▼ -18.00%
- Reading proficiency
- 62% ▲ 3.00%
- Median HH income
- $73,046
- Composite
- 52.43/100
- National rank
- #1575
- State rank
- #222 of 590 in NY
Livability — Victor
- Score
- 79/100
- State rank
- #122
- US rank
- #1991
Category grades
Schools grade is shown separately in the Schools card above.
Census & demographics
- County
- Ontario County · 58,989 people
- City population
- 16,364
- Metro
- Rochester, NY
- Population (ZIP)
- 13,839
- Household income
- $94,609
- Rent vs Own
- Severe rent burden
- 257.0
Population outlook (Ontario County) Hauer SSP2
- Today (2025)
- 111,230 people
- By 2030
- 111,401 · +0.2%
- By 2040
- 109,535 · -1.5%
- By 2050
- 104,895 · -5.7%
- By 2075
- 92,999 · -16.4%
- By 2100
- 73,723 · -33.7%
Race, ethnicity, and origin ACS 2023
- Neighborhood character
- Predominantly White (86%)
- Race & ethnicity
- White 86% Two or more races 7% Hispanic / Latino 5% Black 2% Asian 2%
- Hispanic origin (detail)
- Puerto Rican 3% Dominican 1%
- Common ancestry
- Romanian 6% Lithuanian 5% Iranian 4%
- Foreign-born
- 3% · Canada, South Korea
- Languages at home
- 94% English-only · Spanish 3% Other Indo-European 1%
Political lean MEDSL · Ontario
- 2024 margin
- Toss-up / Even · D 49.4% · R 50.6%
- 2008→2024 swing
- -1.0pp toward R · 2008: -0.1pp · 2024: -1.2pp
- All cycles
- 2024: R+1.2 2020: R+0.0 2016: R+8.6 2012: R+1.6 2008: R+0.1
Not yet ingested
- Civics
- —
Market trends
- HPI YoY
- ▼ -47.59%
- Current HPI
- 267.0192
- Rent YoY
- —
- Metro
- Rochester, NY
- State GDP YoY
- ▲ 2.60%
- F500 in state
- 92
Industry mix (Fortune 500 HQ in NY)
| Industry | F500 HQs | Revenue |
|---|---|---|
| Financial Services | 10 | $950B |
|
||
| Consumer Goods | 9 | $162B |
|
||
| Insurance | 4 | $225B |
|
||
| Telecommunications | 2 | $144B |
|
||
| Pharmaceuticals | 2 | $112B |
|
||
| Media / Entertainment | 2 | $69B |
|
||
Price history
+174.6% since first listed9 events — show timeline
- 2026-04-28 Pending — UNYREIS
- 2026-04-15 Listed $224,900 UNYREIS
- 2015-11-16 Listing Removed — UNYREIS
- 2015-11-12 Sold (Public Records) $114,945 Public Records
- 2015-11-11 Sold (MLS) $118,500 UNYREIS
- 2015-08-19 Listed $118,500 UNYREIS
- 2007-11-02 Sold (Public Records) $95,900 Public Records
- 2003-08-28 Sold (Public Records) $101,000 Public Records
- 1996-10-31 Sold (Public Records) $81,900 Public Records
Property tax history
+3.1%/yrLatest (2025): $2,994 · -0.1% YoY. Source: county tax records.
Cash-flow waterfall
monthlySold comps — $/sqft
last 12 mo · ≤1 miLoading sold comps…