 Multi-family
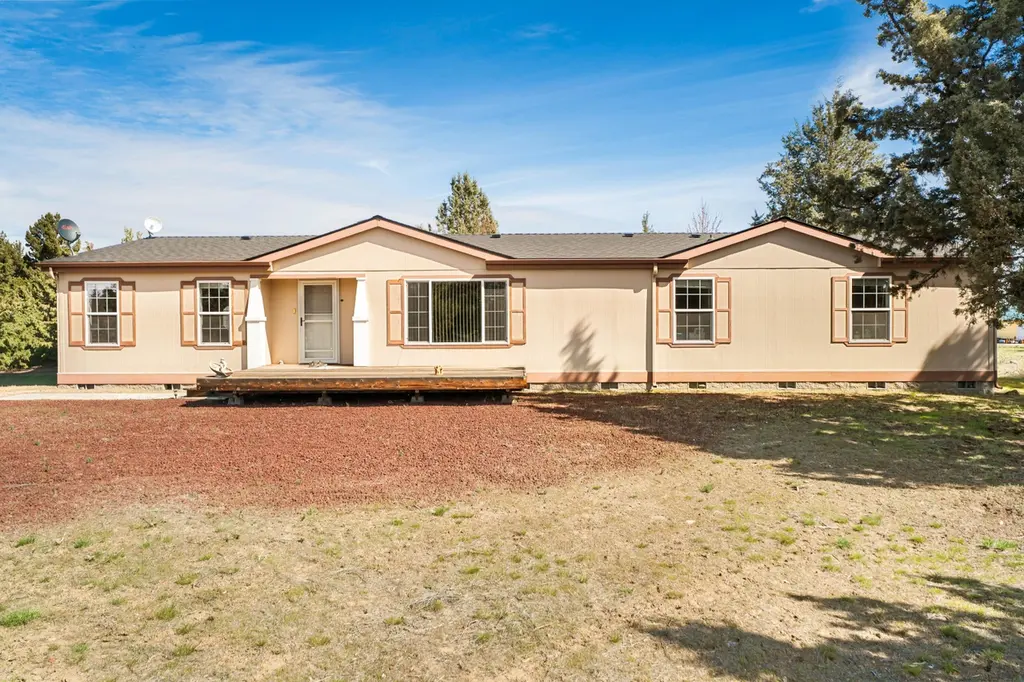
8092 SW Crater Loop Rd · Crooked River Ranch, OR
Flood risk 1/10 · Minimal
- FEMA flood zone
- X
- Chance of flooding over 30 yrs
- 0.0%
- Est. flood insurance / yr
- $507 – $1,088
Fire risk 7/10 · Major
- Est. fire insurance / yr
- $498 – $926
Heat risk 3/10 · Minor
- Hot days now (above 93°F)
- 7 days/yr
- Hot days in 30 yrs
- 16 days/yr
Wind risk 1/10 · Minimal
- Chance of severe wind over 30 yrs
- —
Air-quality risk 10/10 · Severe
- Unhealthy air days now
- 19 days/yr
- Unhealthy air days in 30 yrs
- 25 days/yr
Risk factors via First Street. Map © Google.
Why this score? — see what drove the C grade
The composite is a weighted blend of 9 inputs, each scored 0–100. Each bar is that input's sub-score; the figure is the points it added to the 100-point composite (weight × sub-score).
- Cash flow +25.0/30.0
- DSCR +8.1/10.0
- ARV discount +7.5/15.0
- 1% rule +5.7/10.0
- Schools +2.9/10.0
- Rent growth +2.5/5.0
- Livability +2.5/5.0
- Condition / age +2.5/5.0
- Appreciation +0.0/10.0
$430,000
🖨 Deal sheet 📄 Offer letter ✓ Due diligence
Multi-family units
County records classify this as Multi-Family (2-4 Unit). Listing-text estimate: 1 unit. estimate disagrees with records
Listing remarks
PRIME 1.28 ACRES | NEW ROOF 2026 | CASCADE VIEWS. This 2,100 sq. ft. 3-bed, 2-bath ranch style 2004 manufactured home sits on a flat, elevated 1.28-acre lot with mountain views from the front porch. With a kitchen fully updated in 2020 and two separate living rooms with separate living quarters you can live peacefully on the opposite side of the home, away from guests, hallelujah! Relax under the covered patio inside the fenced backyard and have peace of mind knowing you have a brand new roof installed March 2026. This home also features an attached two car garage, and is exceptionally well maintained. Perfect for those wanting privacy, views, and move-in-ready comfort in Central Oregon.
Key facts
- 1.29 acre lot
- 2 garage spots
- Community pool
Neighborhood map
What this means for you Summary
Snapshot
- This is a 3-bed/1.0-bath multifamily listed at $430k.
Deal economics
- At list price, monthly cash flow is $935 ($11k/yr) — positive.
- The deal already cash-flows at list — no discount required.
- Meets the 1% rule at list price ($5k rent vs $430k).
- Cap rate 8.9% vs local median 2.4% in Crooked River Ranch — top-decile yield for the area; either an underpriced asset or a hidden risk that comps aren't pricing in. Stress-test before assuming the spread holds.
Location & tenants
- Location reads: area grade C — affects rentability + tenant quality, not the cash-flow math above.
- Redmond SD 2J (town): math 24% / reading 42% proficiency, ranked #28 of 58 in OR (top 48%) — families likely to look elsewhere, expect single-tenant / working-renter base with shorter leases.
- Zoned schools: Terrebonne Community School (math 15% / reading 34%, grade F, #309 of 412 statewide, top 77%, 299 students, 35% FRL); Elton Gregory Middle School (math 18% / reading 39%, grade F, #94 of 128 statewide, top 73%, 709 students, 40% FRL); Redmond High School (936 students, 38% FRL).
- Market conditions: 142 active listings in the ZIP; 1 comparable units currently listed for rent nearby; 108 units permitted in Jefferson County in 2024 (5 in 5+ unit buildings).
Forward outlook
- Local home prices are declining (-3.0%/yr); year-one equity from $3k of loan paydown is wiped out by about $13k of value loss. Plan a longer hold.
- Jefferson County population projected at +7% by 2050 — modest demand growth; plan on rents tracking national, not racing it.
Negotiation context
- Only 10 days on market — expect competitive offers; lowballing is unlikely to land.
- 2 sale attempts since 18y ago with the ask held roughly flat each time — persistent listings suggest the price (not the market) is what's stuck; bring a comps-based counter.
Risks & watch-outs
- Climate carrying-cost: major wildfire risk — expect insurance premiums to compound above CPI over the hold.
Questions for the listing agent
- What does the HOA fee cover, when was the last increase, and are there any pending special assessments or reserve-fund shortfalls?
- Is there a deadline driving the sale (1031 exchange, divorce, estate, relocation)? That informs how much negotiation room exists.
- What's the average days-on-market for RENTAL listings here right now (not sales)? A rising rental-DOM trend means longer vacancies and softer asking-rent achievability than the comps imply.
- What's the recent tenant-quality profile in this submarket — average credit score on applications, eviction rate, late-payment / NSF rate, and stable-employment percentage? A property-management company in the area should have these aggregated.
- How much new apartment / multifamily construction is in the pipeline within 1–3 miles? Heavy new supply (>2% of stock underway) typically softens rents 12–24 months out; light construction supports rent growth.
Investment metrics
- 1% rule
- 1.07% ✓
- Cap rate
- 8.90%
- Cash-on-cash
- 9.32%
- DSCR
- 1.41
- GRM
- 7.8
CMA / ARV
No comps found within radius.
Projected returns pro-forma
-3.0% appreciation · 3.0% rent growth · sell at horizon
- IRR
- -2.2%
- Equity multiple
- 0.92×
- Total profit
- $-10,196
- Equity at exit
- $64,114
- IRR
- 7.4%
- Equity multiple
- 1.56×
- Total profit
- $67,442
- Equity at exit
- $37,179
Cash invested: $120,400 (down + closing). Projections, not guarantees.
Landlord ↔ Tenant lean methodology
- Overall (STATE)
- 28 Tenant-Leaning
- State Oregon
- 28 Tenant-Leaning · D+6
- County
- — inherits STATE
- City
- — inherits STATE
ZIP-level market 97760
- Home prices YoY
- -14.9%
- Active inventory
- 142
- Price-to-rent
- 15.6×
Monthly cashflow live
- Estimated rent
- $4,600 medium interval (Pro) →
- Mortgage (P&I)
- −$2,255
- Tax from tax record
- −$214 /mo · $2,573/yr
- Insurance
- −$179
- HOA
- −$50
- Vacancy / Maint / Mgmt
- −$966
- Net cashflow
- $935
Break-even live
2-unit breakdown (identical units grouped — click to expand)
| Units | Beds | Baths | Est. rent |
|---|---|---|---|
| 2× units | 3 | 2 | $4,600 |
| #1 | 3 | 2 | $2,300 |
| #2 | 3 | 2 | $2,300 |
| Total (2 units) | $4,600 | ||
UW: 25.0% down · 7.5% · 30yr · 1.5% tax · 5.0% vac · 8.0% maint · 8.0% mgmt
Financing live
Cash to close
- Down payment
- $107,500
- Closing costs
- $12,900
- Reserves months
- —
- Total cash needed
- —
Loan-product check · same deal, 3 products live
Conventional
25% down · 7.5% · 30yr
- Down + closing
- —
- Monthly P&I
- —
- Monthly cashflow
- —
- DSCR
- —
- Eligible?
- —
Personal DTI + credit; lowest rate.
DSCR
20% down · 8.5% · 30yr
- Down + closing
- —
- Monthly P&I
- —
- Monthly cashflow
- —
- DSCR
- —
- Eligible?
- —
No personal income docs; deal must DSCR.
Hard money
10% down · 12.0% · 12mo
- Down + closing
- —
- Monthly P&I
- —
- Monthly cashflow
- —
- DSCR
- —
- Eligible?
- —
Short-term bridge; refi at stabilization.
Rent comps 1 comps
| Address | Beds | Baths | Sqft | Rent | $/sqft | DOM | Units | Dist |
|---|---|---|---|---|---|---|---|---|
| 6690 Old Ranch House Rd Terrebonne, OR | 4.0 | 1.0 | 1500 | $2,300 | $1.53 | 43d | 1 | 1.36mi |
HOA detail
- Monthly dues
- $50 · $600/yr
Listing history 4 events
-
2026-04-05status Pending
-
2026-03-25$430,000 Active
-
2008-11-02historical
-
2008-04-01$235,000
ⓘ Source: listings_history table (triggers on properties + properties_extension) + one-shot
backfill from property_details.listing_events for pre-trigger history.
Tax reassessment forecast OR · Resets to sale price
- Current annual tax
- $2,573 · $214/mo
- Projected year-2 tax
- $4,171 · $348/mo
- Expected delta
- +$1,598/yr (+$133/mo · 62.1%)
ⓘ Screening estimate from a state-policy table — verify with the county assessor before closing.
Climate risk First Street
- Flood 1/10 Low FEMA zone X · 0% chance over 30 yrs
- Wildfire 7/10 Severe
- Heat 3/10 Moderate 7 d/yr ≥93°F today · 16 d/yr by 30 yrs out
- Wind 1/10 Low
- Air quality 10/10 Extreme 19 unhealthy d/yr today · 25 by 30 yrs out
Nearby sold comps map
Loading sold comps map…
Walkable amenities ~0.75 mi
Loading nearby amenities…
Taxation est. · year 1
- Rental income
- $55,200
- − Mortgage interest
- −$24,087
- − Property taxes
- −$2,573
- − Insurance
- −$2,150
- − Repairs & maintenance
- −$4,416
- − Management
- −$4,416
- − HOA
- −$600
- − Depreciation
- −$12,509
- Taxable income
- $4,450
- Est. tax owed @ 24.0%
- −$1,068
- After-tax cash flow
- $10,158/yr
For passive investors: Depreciation is non-cash, so a rental often shows a tax loss while cash-flowing — sheltering income. Rental losses are passive: they offset passive income freely, and up to $25,000/yr can offset ordinary (W-2) income if you actively participate and your MAGI is under $100k (phasing out to $0 by $150k); unused losses carry forward. On sale, claimed depreciation is recaptured at up to 25%, and gains may owe capital-gains tax (a 1031 exchange can defer both). Figures are a year-1 estimate at your 24.0% rate — not tax advice; consult a CPA.
Schools (NCES district)
- District
- Redmond SD 2J
- NCES district ID
- 4110350
- Math proficiency
- 24% ▼ -19.00%
- Reading proficiency
- 42% ▼ -11.00%
- Median HH income
- $51,027
- Composite
- 28.72/100
- National rank
- #6682
- State rank
- #28 of 58 in OR
Livability — Crooked River Ranch
No livability data for this city. (Only ~50 U.S. cities are tracked.)
Census & demographics
- Census place
- Crooked River Ranch, OR
- City population
- 8,185
- Population (ZIP)
- 8,185
Population outlook (Jefferson County) Hauer SSP2
- Today (2025)
- 24,040 people
- By 2030
- 24,631 · +2.5%
- By 2040
- 25,499 · +6.1%
- By 2050
- 25,801 · +7.3%
- By 2075
- 25,682 · +6.8%
- By 2100
- 22,222 · -7.6%
Race, ethnicity, and origin ACS 2023
- Neighborhood character
- Predominantly White (88%)
- Race & ethnicity
- White 88% Hispanic / Latino 7% Two or more races 6%
- Hispanic origin (detail)
- Mexican 4%
- Common ancestry
- Italian 7% Portuguese 5% Slovak 3%
- Foreign-born
- 5% · Canada, South Korea
- Languages at home
- 93% English-only · Spanish 5% Other Indo-European 1%
Political lean MEDSL · Jefferson
- 2024 margin
- Solid R (+30.2) · D 33.6% · R 63.8% · Other 2.5%
- 2008→2024 swing
- -21.5pp toward R · 2008: -8.7pp · 2024: -30.2pp
- All cycles
- 2024: R+30.2 2020: R+23.5 2016: R+27.6 2012: R+16.8 2008: R+8.7
Not yet ingested
- Civics
- —
Market trends
- HPI YoY
- ▼ -82.04%
- Current HPI
- 470.078
- Rent YoY
- —
- Metro
- —
- State GDP YoY
- ▲ 2.05%
- F500 in state
- 2
Industry mix (Fortune 500 HQ in OR)
| Industry | F500 HQs | Revenue |
|---|---|---|
| Consumer Goods | 1 | $51B |
|
||
Price history
+83.0% since first listed4 events — show timeline
- 2026-04-05 Pending — MLSCO
- 2026-03-25 Listed $430,000 MLSCO
- 2008-11-02 Listing Removed — MLSCO
- 2008-04-01 Listed $235,000 MLSCO
Property tax history
+3.2%/yrLatest (2025): $2,573 · +4.0% YoY. Source: county tax records.
Cash-flow waterfall
monthlySold comps — $/sqft
last 12 mo · ≤1 miLoading sold comps…