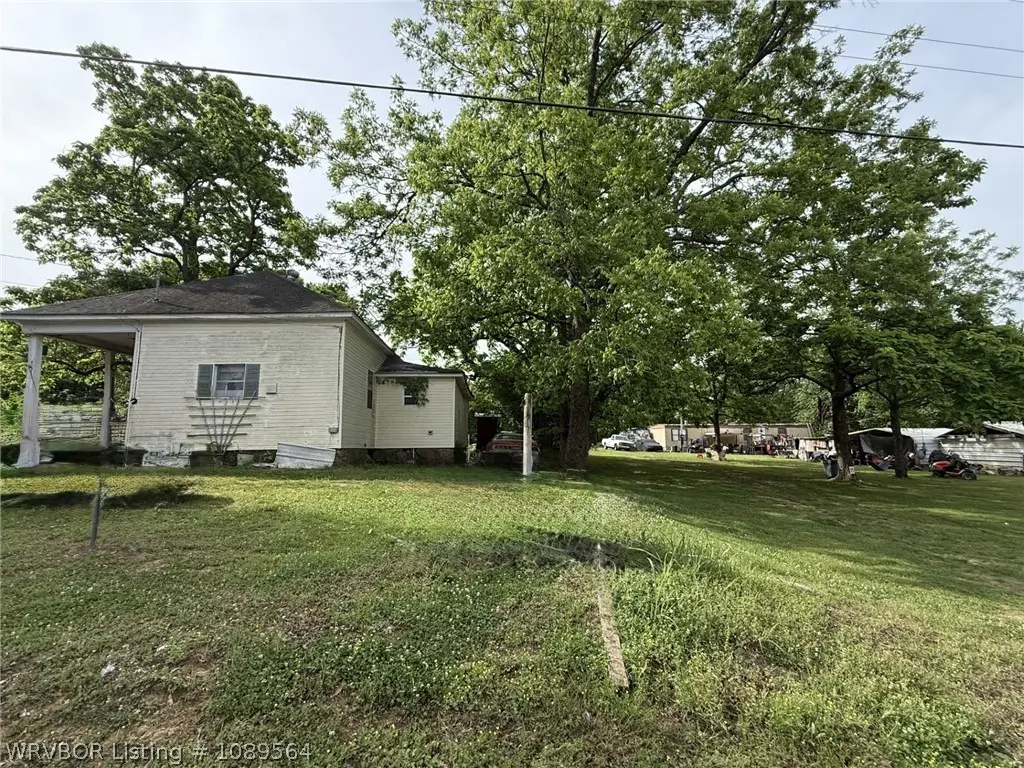
905 Southview St · Dyer, AR
Flood risk 1/10 · Minimal
- FEMA flood zone
- X (unshaded)
- Chance of flooding over 30 yrs
- 0.0%
- Est. flood insurance / yr
- $507 – $1,088
Fire risk 6/10 · Moderate
- Est. fire insurance / yr
- $1,499 – $2,785
Heat risk 6/10 · Moderate
- Hot days now (above 111°F)
- 7 days/yr
- Hot days in 30 yrs
- 20 days/yr
Wind risk 2/10 · Minimal
- Chance of severe wind over 30 yrs
- 2.0%
Air-quality risk 2/10 · Minimal
- Unhealthy air days now
- 1 days/yr
- Unhealthy air days in 30 yrs
- 1 days/yr
Risk factors via First Street. Map © Google.
Why this score? — see what drove the B grade
The composite is a weighted blend of 9 inputs, each scored 0–100. Each bar is that input's sub-score; the figure is the points it added to the 100-point composite (weight × sub-score).
- Cash flow +30.0/30.0
- 1% rule +10.0/10.0
- DSCR +10.0/10.0
- ARV discount +7.5/15.0
- Appreciation +5.0/10.0
- Livability +3.4/5.0
- Schools +3.0/10.0
- Rent growth +2.5/5.0
- Condition / age +2.5/5.0
$27,000
🖨 Deal sheet 📄 Offer letter ✓ Due diligence
Listing remarks
2 bedroom 1 bathroom house in Dyer. Large lot. Photo has been edited to remove debris.
Key facts
- 0.5 acre lot
- Built 1950
- Listed 7 days
Property features AI
Exterior
- Utilities: Electricity available
- Home design: Single-family house; One story
- Construction: Vinyl siding; Asphalt shingle roof; Built on foundation (year built not provided)
- Exterior features: Front porch
Interior
- Flooring: Carpet; Laminate
- Bathrooms: 1 full bathroom
- Heating & cooling: Ceiling fan cooling; Has cooling
- Interior features: Ceiling fans; Kitchen fireplace
- Laundry & utility: No laundry hookups listed
Neighborhood map
What this means for you Summary
Snapshot
- This is a 2-bed/1.0-bath single-family listed at $27k.
Deal economics
- At list price, monthly cash flow is $647 ($8k/yr) — positive.
- The deal already cash-flows at list — no discount required.
- Meets the 1% rule at list price ($1k rent vs $27k).
Location & tenants
- Location reads 67/100 on livability (#101 in AR) — a middle-class / working-renter tenant base. Strengths: cost of living A+, housing A+, health & safety A+; Watch: crime D, amenities F, commute F.
- Alma School District (suburban): math 34% / reading 37% proficiency, ranked #111 of 238 in AR (top 47%) — families likely to look elsewhere, expect single-tenant / working-renter base with shorter leases.
- Zoned schools: Alma Primary School (701 students, 47% FRL); Alma Middle School (math 42% / reading 41%, grade F, #81 of 201 statewide, top 40%, 716 students, 44% FRL); Alma High School (math 25% / reading 38%, grade F, #128 of 292 statewide, top 44%, 1,003 students, 38% FRL) — zoned schools at 43% FRL track the district average.
- Market conditions: 3 active listings in the ZIP; 47 units permitted in Crawford County in 2024 (0 in 5+ unit buildings).
Forward outlook
- In year one you build about $997 of equity ($187 loan paydown + $810 appreciation (3.0% local appreciation)).
- Crawford County population projected to shrink 7% by 2050 — rents likely to lag national; underwrite the cash flow, not the appreciation.
- At projected returns (3.0% appreciation + 3.0% rent growth), your $8k cash investment doubles in ~1 year — after that, you're playing with house money.
Negotiation context
- Only 7 days on market — expect competitive offers; lowballing is unlikely to land.
- Current owner paid $18k; list at $27k implies a 50% gain — meaningful room to come down on a strong offer.
Risks & watch-outs
- Watch-outs: built in 1950 — expect roof / HVAC / electrical / plumbing capex.
- Climate carrying-cost: major wildfire risk; extreme-heat days projected 7→20/yr by 2055 (HVAC capex compounding) — expect insurance premiums to compound above CPI over the hold.
Questions for the listing agent
- Built in 1950 — when were the roof, HVAC, electrical panel, plumbing, and water heater last replaced?
- Is there a deadline driving the sale (1031 exchange, divorce, estate, relocation)? That informs how much negotiation room exists.
- Schools are F-rated, which usually means shorter tenancies and higher turnover. Who's the typical renter profile here, and what's been the actual vacancy rate?
- Crime grade is D in this area — have there been break-ins, vandalism, or insurance claims at this property in the last 3 years? What carrier currently insures it and at what premium?
- What's the average days-on-market for RENTAL listings here right now (not sales)? A rising rental-DOM trend means longer vacancies and softer asking-rent achievability than the comps imply.
- What's the recent tenant-quality profile in this submarket — average credit score on applications, eviction rate, late-payment / NSF rate, and stable-employment percentage? A property-management company in the area should have these aggregated.
- How much new for-sale + rental construction is in the pipeline within 1–3 miles? Heavy new supply typically softens prices + rents 12–24 months out; constrained supply supports both.
Investment metrics
- 1% rule
- 4.01% ✓
- Cap rate
- 35.05%
- Cash-on-cash
- 102.72%
- DSCR
- 5.57
- GRM
- 2.1
CMA / ARV
- ARV (on-the-fly)
- $179,732
- Comps found
- 5
Show comp detail 5 sales within ~0.75 mi
| Address | Dist | Beds/Ba | Sqft | Sold | Price | $/sf | Match |
|---|---|---|---|---|---|---|---|
| 205 N Main St | 0.12mi | 2/1.0 | 1,260 (-8%) | 3mo | $155,000 | $123 | 78 |
| 205 N Main St | 0.12mi | 3/2.0 (+1) | 1,260 (-8%) | 3mo | $155,000 | $123 | 69 |
| 107 N Kerkendoll St | 0.28mi | 3/2.0 (+1) | 1,264 (-8%) | 4mo | $165,000 | $131 | 61 |
| 1011 Red Hill St | 0.15mi | 3/2.0 (+1) | 1,306 (-5%) | 18mo | $315,000 | $241 | 61 |
| 1217 W Red Hill St | 0.19mi | 3/2.0 (+1) | 1,466 (+7%) | 18mo | $205,000 | $140 | 56 |
Match score weights: distance 35% · size 25% · config 20% · recency 20%. Top-matched comps best support the ARV.
Projected returns pro-forma
3.0% appreciation · 3.0% rent growth · sell at horizon
- IRR
- —
- Equity multiple
- 6.89×
- Total profit
- $44,499
- Equity at exit
- $12,140
- IRR
- —
- Equity multiple
- 14.32×
- Total profit
- $100,692
- Equity at exit
- $18,710
Cash invested: $7,560 (down + closing). Projections, not guarantees.
Landlord ↔ Tenant lean methodology
- Overall (STATE)
- 92 Strongly Landlord-Friendly
- State Arkansas
- 92 Strongly Landlord-Friendly · R+14
- County
- — inherits STATE
- City
- — inherits STATE
ZIP-level market 72935
- Active inventory
- 3
- Price-to-rent
- 2.1×
Monthly cashflow live
- Estimated rent
- $1,082 medium interval (Pro) →
- Mortgage (P&I)
- −$142
- Tax from tax record
- −$55 /mo · $660/yr
- Insurance
- −$11
- HOA
- −$0
- Vacancy / Maint / Mgmt
- −$227
- Net cashflow
- $647
Break-even live
UW: 25.0% down · 7.5% · 30yr · 1.5% tax · 5.0% vac · 8.0% maint · 8.0% mgmt
Financing live
Cash to close
- Down payment
- $6,750
- Closing costs
- $810
- Reserves months
- —
- Total cash needed
- —
Loan-product check · same deal, 3 products live
Conventional
25% down · 7.5% · 30yr
- Down + closing
- —
- Monthly P&I
- —
- Monthly cashflow
- —
- DSCR
- —
- Eligible?
- —
Personal DTI + credit; lowest rate.
DSCR
20% down · 8.5% · 30yr
- Down + closing
- —
- Monthly P&I
- —
- Monthly cashflow
- —
- DSCR
- —
- Eligible?
- —
No personal income docs; deal must DSCR.
Hard money
10% down · 12.0% · 12mo
- Down + closing
- —
- Monthly P&I
- —
- Monthly cashflow
- —
- DSCR
- —
- Eligible?
- —
Short-term bridge; refi at stabilization.
Listing history 6 events
-
2026-06-13statusdays on market $27,000 Pending 7 DOM
-
2026-06-10days on market $27,000 Active 5 DOM
-
2026-06-09days on market $27,000 Active 4 DOM
-
2026-06-08days on market $27,000 Active 3 DOM
-
2026-06-07remarks 86-char remark
-
2026-06-07$27,000 Active 2 DOM
ⓘ Source: listings_history table (triggers on properties + properties_extension) + one-shot
backfill from property_details.listing_events for pre-trigger history.
Tax reassessment forecast AR · Resets to sale price
- Current annual tax
- $660 · $55/mo
- Projected year-2 tax
- $660 · $55/mo
- Expected delta
- $0/yr ($0/mo · 0.0%)
ⓘ Screening estimate from a state-policy table — verify with the county assessor before closing.
Climate risk First Street
- Flood 1/10 Low FEMA zone X (unshaded) · 0% chance over 30 yrs
- Wildfire 6/10 Major
- Heat 6/10 Major 7 d/yr ≥111°F today · 20 d/yr by 30 yrs out
- Wind 2/10 Low 2% chance of damaging wind over 30 yrs
- Air quality 2/10 Low 1 unhealthy d/yr today · 1 by 30 yrs out
Nearby sold comps map
Loading sold comps map…
Walkable amenities ~0.75 mi
Loading nearby amenities…
Taxation est. · year 1
- Rental income
- $12,987
- − Mortgage interest
- −$1,512
- − Property taxes
- −$660
- − Insurance
- −$135
- − Repairs & maintenance
- −$1,039
- − Management
- −$1,039
- − Depreciation
- −$785
- Taxable income
- $7,816
- Est. tax owed @ 24.0%
- −$1,876
- After-tax cash flow
- $5,890/yr
For passive investors: Depreciation is non-cash, so a rental often shows a tax loss while cash-flowing — sheltering income. Rental losses are passive: they offset passive income freely, and up to $25,000/yr can offset ordinary (W-2) income if you actively participate and your MAGI is under $100k (phasing out to $0 by $150k); unused losses carry forward. On sale, claimed depreciation is recaptured at up to 25%, and gains may owe capital-gains tax (a 1031 exchange can defer both). Figures are a year-1 estimate at your 24.0% rate — not tax advice; consult a CPA.
Schools (NCES district)
- District
- Alma School District
- NCES district ID
- 0502250
- Math proficiency
- 34% ▼ -17.00%
- Reading proficiency
- 37% ▼ -7.00%
- Median HH income
- $45,566
- Composite
- 30.34/100
- National rank
- #6264
- State rank
- #111 of 238 in AR
Livability — Dyer
- Score
- 67/100
- State rank
- #101
- US rank
- #10563
Category grades
Schools grade is shown separately in the Schools card above.
Census & demographics
- Census place
- Dyer, AR
- City population
- 487
- Population (ZIP)
- 487
Population outlook (Crawford County) Hauer SSP2
- Today (2025)
- 62,108 people
- By 2030
- 61,519 · -0.9%
- By 2040
- 59,735 · -3.8%
- By 2050
- 57,521 · -7.4%
- By 2075
- 53,143 · -14.4%
- By 2100
- 49,596 · -20.1%
Race, ethnicity, and origin ACS 2023
- Neighborhood character
- Predominantly White (72%)
- Race & ethnicity
- White 72% Hispanic / Latino 16% Two or more races 11% Black 2%
- Hispanic origin (detail)
- Mexican 16%
- Common ancestry
- Slovak 12% Iranian 3% Scottish 2%
- Languages at home
- 99% English-only · Spanish 1%
Political lean MEDSL · Crawford
- 2024 margin
- Solid R (+58.2) · D 19.9% · R 78.1% · Other 2.0%
- 2008→2024 swing
- -12.1pp toward R · 2008: -46.0pp · 2024: -58.2pp
- All cycles
- 2024: R+58.2 2020: R+56.7 2016: R+55.0 2012: R+49.9 2008: R+46.0
Not yet ingested
- Civics
- —
Market trends
- HPI YoY
- —
- Current HPI
- —
- Rent YoY
- —
- Metro
- —
- State GDP YoY
- ▲ 3.80%
- F500 in state
- 10
Industry mix (Fortune 500 HQ in AR)
| Industry | F500 HQs | Revenue |
|---|---|---|
| Retail | 1 | $681B |
|
||
| Food / Agriculture | 1 | $53B |
|
||
| Retail / Energy | 1 | $22B |
|
||
| Transportation / Logistics | 1 | $12B |
|
||
| Energy | 1 | $4B |
|
||
Price history
+50.0% since first listed2 events — show timeline
- 2026-06-05 Listed $27,000 WRVBOR
- 1984-09-10 Sold (Public Records) $18,000 Public Records
Cash-flow waterfall
monthlySold comps — $/sqft
last 12 mo · ≤1 miLoading sold comps…