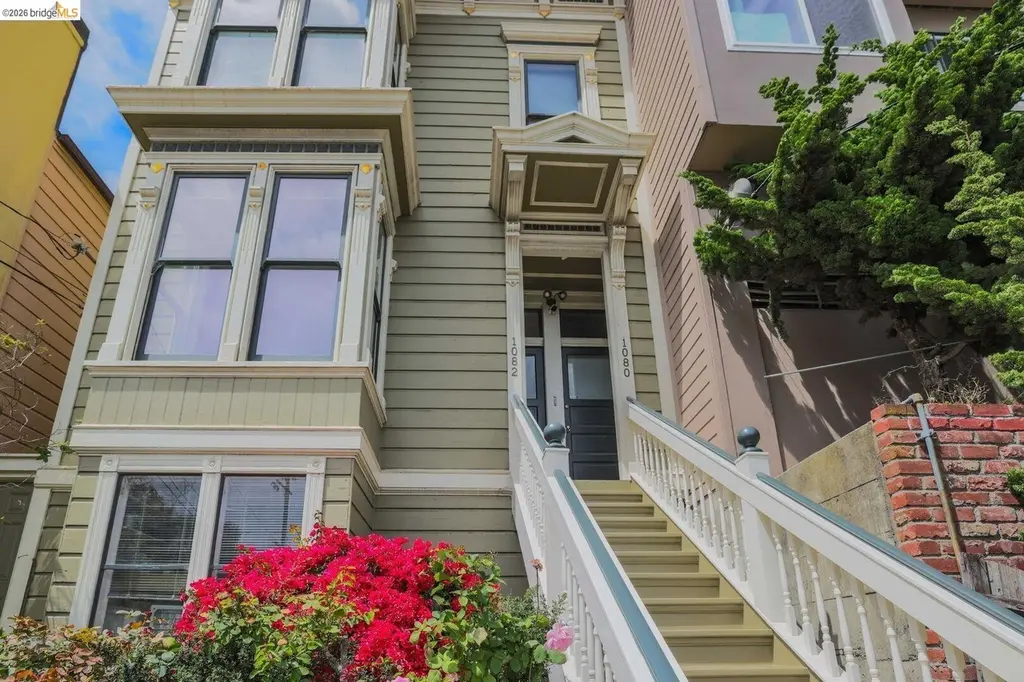
1082 Church St · San Francisco, CA
Flood risk 1/10 · Minimal
- FEMA flood zone
- X (unshaded)
- Chance of flooding over 30 yrs
- 0.0%
- Est. flood insurance / yr
- $507 – $1,088
Fire risk 1/10 · Minimal
- Est. fire insurance / yr
- $659 – $1,223
Heat risk 2/10 · Minimal
- Hot days now (above 78°F)
- 8 days/yr
- Hot days in 30 yrs
- 18 days/yr
Wind risk 1/10 · Minimal
- Chance of severe wind over 30 yrs
- —
Air-quality risk 8/10 · Major
- Unhealthy air days now
- 15 days/yr
- Unhealthy air days in 30 yrs
- 15 days/yr
Risk factors via First Street. Map © Google.
Why this score? — see what drove the D- grade
The composite is a weighted blend of 9 inputs, each scored 0–100. Each bar is that input's sub-score; the figure is the points it added to the 100-point composite (weight × sub-score).
- Appreciation +9.8/10.0
- ARV discount +6.3/15.0
- Rent growth +5.0/5.0
- Schools +5.0/10.0
- Livability +3.8/5.0
- Cash flow +3.2/30.0
- Condition / age +2.5/5.0
- 1% rule +0.1/10.0
- DSCR +0.0/10.0
$995,000
🖨 Deal sheet 📄 Offer letter ✓ Due diligence
Listing remarks
Tucked along one of Noe Valley's most beloved corridors, this beautifully updated residence at 1082 Church Street blends classic San Francisco charm with modern livability and effortless style. Step inside to a light-filled, open-concept living and dining space where soaring ceilings, rich hardwood floors, and oversized windows create an airy, welcoming atmosphere. The layout is both functional and inviting-perfect for everyday living as well as hosting. The kitchen anchors the home with warm wood cabinetry, stone countertops, stainless steel appliances, and a generous island with bar seating-ideal for casual meals, morning coffee, or gathering with friends. Toward the rear, the home offers
Key facts
- $400 HOA
- 2 garage spots
- Built 1900
Property features AI
Finance
- HOA & community: Monthly association fee of $400; Association covers reserves and insurance; Association provides laundry (laundry free)
Exterior
- Parking: 2 garage spaces; 2 covered spaces; Off-street parking; Assigned parking; Alley access; Side-by-side parking; Uncovered parking space; No garage
- Utilities: Has heating; Gas water heater
- Home design: Residential condominium; Built in 1900; Main entry at street level
- Construction: Wood siding
- Exterior features: Rear porch; Garden; Back yard; Front yard; Landscaped front and back; Storage area; Partial wood fencing
Interior
- Kitchen: Stone counters; Eat-in kitchen; Dishwasher; Disposal; Gas range / cooktop; Microwave; Refrigerator; Pantry; Updated kitchen
- Bedrooms: 2 bedrooms; Primary bedroom suite on level 1
- Flooring: Wood flooring
- Bathrooms: 2 full bathrooms
- Heating & cooling: Forced air heating; No air conditioning
- Interior features: Pantry; Updated kitchen; Main entry
- Laundry & utility: Washer and dryer; Laundry in basement; Common area laundry; Gas water heater
Neighborhood map
What this means for you Summary
Snapshot
- This is a 2-bed/2.0-bath condo listed at $995k.
Deal economics
- At list price, monthly cash flow is $-3k ($-38k/yr) — negative.
- To cash-flow at today's rent, offer at most $437k (56.1% below list).
- To meet the 1% rule (rent ≥ 1% of price), the offer needs to be $508k (48.9% below list).
- Recommended offer: $437k (56.1% below list) — sets the bar for cash-flow.
Location & tenants
- Location reads 76/100 on livability (#90 in CA, #3,143 nationally) — a middle-class / working-renter tenant base. Strengths: amenities A+, commute A+, employment A+; Watch: crime F, cost of living F.
- San Francisco Unified (urban): math 50% / reading 56% proficiency, ranked #322 of 1,400 in CA (top 23%) — acceptable for families but not a draw, mixed tenant base, ~2y average lease.
- Market conditions: Rents rising fast (+14.4%/yr); 116 active listings in the ZIP; 40 comparable units currently listed for rent nearby; rentals at typical pace (median 24d on market — plan ~3-4 weeks tenant-placement turnaround); high-income renter base; 750 units permitted in San Francisco County in 2024 (688 in 5+ unit buildings).
Forward outlook
- In year one you build about $101k of equity ($7k loan paydown + $95k appreciation (9.5% local appreciation)).
- San Francisco County population projected at +39% by 2050 — long-run rental-demand tailwind backs the buy-and-hold thesis.
- By year 2, paydown + projected appreciation supports a ~$163k cash-out refi (75% LTV) — recoverable capital for the next deal without selling this one.
Negotiation context
- It's been on market 16 days — a 2% lower offer ($980k) is reasonable based on typical stale-listing flexibility.
Risks & watch-outs
- Watch-outs: built in 1900 — expect roof / HVAC / electrical / plumbing capex.
Questions for the listing agent
- What do current leases actually rent for vs. the listed asking? Can we see a recent rent roll and the last 12 months of T-12 income?
- Built in 1900 — when were the roof, HVAC, electrical panel, plumbing, and water heater last replaced?
- What does the HOA fee cover, when was the last increase, and are there any pending special assessments or reserve-fund shortfalls?
- Any open or pending special assessments — roof, HVAC, plumbing, elevator, façade? What's the per-unit balance and payoff schedule, and is the seller paying it off at close or rolling it to the buyer?
- Is there a deadline driving the sale (1031 exchange, divorce, estate, relocation)? That informs how much negotiation room exists.
- Schools are B-rated — typically a magnet for longer-tenancy family renters. What's the average tenant stay here, and is there a school-zone premium baked into asking?
- Crime grade is F in this area — have there been break-ins, vandalism, or insurance claims at this property in the last 3 years? What carrier currently insures it and at what premium?
- The area grade is low — what's the realistic commute time and amenity access for the typical tenant pool here? Any planned neighborhood developments (good or bad) we should know about?
- What's the average days-on-market for RENTAL listings here right now (not sales)? A rising rental-DOM trend means longer vacancies and softer asking-rent achievability than the comps imply.
- What's the recent tenant-quality profile in this submarket — average credit score on applications, eviction rate, late-payment / NSF rate, and stable-employment percentage? A property-management company in the area should have these aggregated.
- How much new apartment / multifamily construction is in the pipeline within 1–3 miles? Heavy new supply (>2% of stock underway) typically softens rents 12–24 months out; light construction supports rent growth.
Investment metrics
- 1% rule
- 0.51% ✗
- Cap rate
- 2.48%
- Cash-on-cash
- -13.61%
- DSCR
- 0.39
- GRM
- 16.3
CMA / ARV
- ARV (median comp)
- $968,888
- List price
- $995,000
- Delta
- 2.70%
- Verdict
- FAIR
- Comps
- 1 within 2.0 mi
Projected returns pro-forma
9.51% appreciation · 8.0% rent growth · sell at horizon
- IRR
- 14.7%
- Equity multiple
- 2.20×
- Total profit
- $334,332
- Equity at exit
- $860,829
- IRR
- 15.4%
- Equity multiple
- 5.31×
- Total profit
- $1,201,900
- Equity at exit
- $1,819,841
Cash invested: $278,600 (down + closing). Projections, not guarantees.
Landlord ↔ Tenant lean methodology
- Overall (CITY)
- 0 Strongly Tenant-Friendly
- State California
- 18 Strongly Tenant-Friendly · D+13
- County
- — inherits STATE
- City San Francisco
- 0 Strongly Tenant-Friendly · D+57
ZIP-level market 94114
- Home prices YoY
- 4.4%
- Rents YoY
- 14.4%
- Active inventory
- 116
- Price-to-rent
- 16.3×
Monthly cashflow live
- Estimated rent
- $5,085 high interval (Pro) →
- Mortgage (P&I)
- −$5,218
- Tax from tax record
- −$1,145 /mo · $13,737/yr
- Insurance
- −$415
- HOA
- −$400
- Vacancy / Maint / Mgmt
- −$1,068
- Net cashflow
- $-3,160
Break-even live
UW: 25.0% down · 7.5% · 30yr · 1.5% tax · 5.0% vac · 8.0% maint · 8.0% mgmt
Financing live
Cash to close
- Down payment
- $248,750
- Closing costs
- $29,850
- Reserves months
- —
- Total cash needed
- —
Loan-product check · same deal, 3 products live
Conventional
25% down · 7.5% · 30yr
- Down + closing
- —
- Monthly P&I
- —
- Monthly cashflow
- —
- DSCR
- —
- Eligible?
- —
Personal DTI + credit; lowest rate.
DSCR
20% down · 8.5% · 30yr
- Down + closing
- —
- Monthly P&I
- —
- Monthly cashflow
- —
- DSCR
- —
- Eligible?
- —
No personal income docs; deal must DSCR.
Hard money
10% down · 12.0% · 12mo
- Down + closing
- —
- Monthly P&I
- —
- Monthly cashflow
- —
- DSCR
- —
- Eligible?
- —
Short-term bridge; refi at stabilization.
Rent comps 40 comps
| Address | Beds | Baths | Sqft | Rent | $/sqft | DOM | Units | Dist |
|---|---|---|---|---|---|---|---|---|
| 1043 Dolores St San Francisco, CA | 2.0 | 2.0 | 1012 | $7,500 | $7.41 | 2d | 1 | 0.18mi |
| 169 Fair Oaks St Unit 01 San Francisco, CA | 2.0 | 2.0 | 750 | $4,250 | $5.67 | 43d | 1 | 0.22mi |
| 996 Noe St San Francisco, CA | 2.0 | 1.5 | 972 | $7,500 | $7.72 | 43d | 1 | 0.24mi |
| 3410 22nd St Apt 6 San Francisco, CA | 2.0 | 1.0 | 720 | $4,500 | $6.25 | 2d | 1 | 0.26mi |
| 940 Guerrero St Unit 02 San Francisco, CA | 1.0 | 1.0 | 550 | $4,295 | $7.81 | 16d | 1 | 0.27mi |
| 332 Fair Oaks St Unit 05 San Francisco, CA | 2.0 | 1.0 | 817 | $5,195 | $6.36 | 43d | 1 | 0.28mi |
| 3375 22nd St Unit 4 San Francisco, CA | 1.0 | 1.0 | 1000 | $3,995 | $4.00 | 15d | 1 | 0.30mi |
| 35 Hill St San Francisco, CA | 1.0 | 1.0 | 674 | $3,500 | $5.19 | 7d | 1 | 0.36mi |
| 3645 25th St San Francisco, CA | 3.0 | 2.0 | 1100 | $7,000 | $6.36 | 43d | 1 | 0.41mi |
| 783 Guerrero St #779 San Francisco, CA | 2.0 | 1.0 | 1008 | $4,500 | $4.46 | 7d | 1 | 0.41mi |
| 922 Valencia St San Francisco, CA | 3.0 | 3.0 | 1100 | $8,450 | $7.68 | 43d | 1 | 0.45mi |
| 457 Jersey St Unit 5 San Francisco, CA | 2.0 | 1.0 | 700 | $4,495 | $6.42 | 5d | 1 | 0.48mi |
| 457 Jersey St Unit 5 San Francisco, CA | 2.0 | 1.0 | 700 | $4,495 | $6.42 | 12d | 1 | 0.48mi |
| 1643 Castro St Apt 6 San Francisco, CA | 1.0 | 1.0 | 563 | $3,695 | $6.56 | 7d | 1 | 0.50mi |
| 520 Bartlett St Unit 2 San Francisco, CA | 2.0 | 1.0 | 810 | $4,895 | $6.04 | 24d | 1 | 0.60mi |
| 2333 Mission St #2 San Francisco, CA | 2.0 | 2.0 | 1010 | $4,900 | $4.85 | 7d | 1 | 0.63mi |
| 1 Homestead San Francisco, CA | 2.0 | 1.0 | 750 | $6,900 | $9.20 | 24d | 1 | 0.66mi |
| 155 Eureka St San Francisco, CA | 1.0 | 1.0 | 650 | $4,300 | $6.62 | 24d | 1 | 0.68mi |
| 155 Eureka St San Francisco, CA | 1.0 | 1.0 | 750 | $5,000 | $6.67 | 43d | 1 | 0.68mi |
| 359 29th St San Francisco, CA | 1.0 | 1.0 | 800 | $4,200 | $5.25 | 21d | 1 | 0.72mi |
| 317 29th St #304 San Francisco, CA | 1.0 | 1.0 | 882 | $4,995 | $5.66 | 24d | 1 | 0.73mi |
| 3550 Market St San Francisco, CA | 2.0 | 2.0 | 1012 | $5,495 | $5.43 | 43d | 1 | 0.76mi |
| 799 S Van Ness Ave San Francisco, CA | 1.0–2.0 | 1.0 | 740 | $4,500 | $6.08 | 2d | 2 | 0.77mi |
| 2629 Folsom St Unit 105 San Francisco, CA | 1.0 | 1.0 | 546 | $3,100 | $5.68 | 18d | 1 | 0.77mi |
| 2629 Folsom St Unit 204 San Francisco, CA | 2.0 | 1.0 | 718 | $4,095 | $5.70 | 43d | 1 | 0.77mi |
| 2629 Folsom St Unit 106 San Francisco, CA | 2.0 | 1.0 | 718 | $4,395 | $6.12 | 18d | 1 | 0.77mi |
| 3550 Market St Unit 206 San Francisco, CA | 2.0 | 2.0 | 1012 | $4,950 | $4.89 | 18d | 1 | 0.77mi |
| 450 30th St San Francisco, CA | 1.0 | 1.0 | 800 | $3,450 | $4.31 | 43d | 1 | 0.83mi |
| 5285 Diamond Heights Blvd San Francisco, CA | 1.0–2.0 | 1.0–2.0 | 805 | $6,437 | $8.00 | 2d | 5 | 0.86mi |
| 257 Church St San Francisco, CA | 2.0 | 1.0 | 1100 | $5,995 | $5.45 | 43d | 1 | 0.88mi |
| 165 States St San Francisco, CA | 2.0 | 2.0 | 1100 | $6,000 | $5.45 | 43d | 1 | 0.88mi |
| 179 Caselli Ave Unit 2 San Francisco, CA | 3.0 | 1.0 | 950 | $3,750 | $3.95 | 5d | 1 | 0.88mi |
| 5160 Diamond Heights Blvd Unit 301C San Francisco, CA | 2.0 | 1.0 | 990 | $4,250 | $4.29 | 43d | 1 | 0.88mi |
| 1772 Dolores St #1 San Francisco, CA | 2.0 | 1.0 | 900 | $3,995 | $4.44 | 24d | 1 | 0.91mi |
| 2830 22nd St Unit 2830 San Francisco, CA | 2.0 | 2.0 | 1090 | $5,200 | $4.77 | 16d | 1 | 0.94mi |
| 18 Perego Ter San Francisco, CA | 2.0 | 2.0 | 1100 | $5,145 | $4.68 | 43d | 1 | 0.96mi |
| 218 Winfield St San Francisco, CA | 2.0 | 1.0 | 600 | $3,200 | $5.33 | 43d | 1 | 0.97mi |
| 1600 15th St San Francisco, CA | 1.0–2.0 | 1.0–2.0 | 792 | $5,614 | $7.08 | 3d | 5 | 0.98mi |
| 1875 Mission St #210 San Francisco, CA | 1.0 | 1.0 | 825 | $4,000 | $4.85 | 43d | 1 | 1.02mi |
| 400 Duboce Ave San Francisco, CA | 2.0 | 1.0 | 923 | $7,475 | $8.10 | 23d | 1 | 1.08mi |
HOA detail condo
- Monthly dues
- $400 · $4,800/yr
- Assessments
- None detected in remarks — confirm with the listing agent.
Listing history 24 events
-
2026-05-07$995,000 Active 1201-char remark
-
2020-12-24soldstatus $1,010,000 Closed 663-char remark
-
2020-12-24soldstatus $1,010,000
-
2020-12-15status Pending 663-char remark
-
2020-11-26historical Contingent - Show 663-char remark
-
2020-11-19price $998,000 663-char remark
-
2020-10-02$1,089,000 Active 663-char remark
-
2013-05-17soldstatus $867,000 Closed
-
2013-05-17soldstatus $867,000
-
2013-04-24status Contingent - Show
-
2013-04-19price $799,000
-
2013-04-03$855,000 Active
-
2008-06-19soldstatus $855,000 Closed
-
2008-06-19soldstatus $855,000
-
2008-06-05historical
-
2008-06-02historical
-
2008-05-14$845,000
-
2004-03-04soldstatus $652,000
-
2004-03-04soldstatus $652,000
-
2004-02-20historical
-
2004-01-15$599,000
-
1998-04-13soldstatus $265,000
-
1998-02-27historical
-
1998-02-12$269,000
ⓘ Source: listings_history table (triggers on properties + properties_extension) + one-shot
backfill from property_details.listing_events for pre-trigger history.
Tax reassessment forecast CA · Resets to sale price
- Current annual tax
- $13,737 · $1,145/mo
- Projected year-2 tax
- $13,737 · $1,145/mo
- Expected delta
- $0/yr ($0/mo · 0.0%)
ⓘ Screening estimate from a state-policy table — verify with the county assessor before closing.
Climate risk First Street
- Flood 1/10 Low FEMA zone X (unshaded) · 0% chance over 30 yrs
- Wildfire 1/10 Low
- Heat 2/10 Low 8 d/yr ≥78°F today · 18 d/yr by 30 yrs out
- Wind 1/10 Low
- Air quality 8/10 Severe 15 unhealthy d/yr today · 15 by 30 yrs out
Nearby sold comps map
Loading sold comps map…
Walkable amenities ~0.75 mi
Loading nearby amenities…
Taxation est. · year 1
- Rental income
- $61,015
- − Mortgage interest
- −$55,735
- − Property taxes
- −$13,737
- − Insurance
- −$4,975
- − Repairs & maintenance
- −$4,881
- − Management
- −$4,881
- − HOA
- −$4,800
- − Depreciation
- −$28,945
- Taxable loss
- −$56,941
- Est. tax savings @ 24.0%
- +$13,666
- After-tax cash flow
- $-24,260/yr
For passive investors: Depreciation is non-cash, so a rental often shows a tax loss while cash-flowing — sheltering income. Rental losses are passive: they offset passive income freely, and up to $25,000/yr can offset ordinary (W-2) income if you actively participate and your MAGI is under $100k (phasing out to $0 by $150k); unused losses carry forward. On sale, claimed depreciation is recaptured at up to 25%, and gains may owe capital-gains tax (a 1031 exchange can defer both). Figures are a year-1 estimate at your 24.0% rate — not tax advice; consult a CPA.
Schools (NCES district)
- District
- San Francisco Unified
- NCES district ID
- 0634410
- Math proficiency
- 50% ▬ 0.00%
- Reading proficiency
- 56% ▲ 1.00%
- Median HH income
- $81,249
- Composite
- 50.14/100
- National rank
- #4088
- State rank
- #322 of 1400 in CA
Livability — San Francisco
- Score
- 76/100
- State rank
- #90
- US rank
- #3143
Category grades
Schools grade is shown separately in the Schools card above.
Census & demographics
- Census place
- San Francisco, CA
- County
- San Francisco County · 827,552 people
- City population
- 827,552
- Metro
- San Francisco-Oakland-Berkeley, CA
- Population (ZIP)
- 33,020
- Household income
- $204,134
- Rent vs Own
- Severe rent burden
- 1336.0
Population outlook (San Francisco County) Hauer SSP2
- Today (2025)
- 1,030,936 people
- By 2030
- 1,110,409 · +7.7%
- By 2040
- 1,270,010 · +23.2%
- By 2050
- 1,435,001 · +39.2%
- By 2075
- 1,779,074 · +72.6%
- By 2100
- 1,966,767 · +90.8%
Race, ethnicity, and origin ACS 2023
- Neighborhood character
- Predominantly White (65%)
- Race & ethnicity
- White 65% Asian 14% Two or more races 12% Hispanic / Latino 10% Black 2%
- Hispanic origin (detail)
- Mexican 5%
- Common ancestry
- Lithuanian 4% Italian 4% Romanian 3%
- Foreign-born
- 20% · Canada, China, Vietnam
- Languages at home
- 77% English-only · Spanish 6% Chinese 4% Other Indo-European 4%
Political lean MEDSL · San Francisco
- 2024 margin
- Solid D (+64.8) · D 80.3% · R 15.5% · Other 4.1%
- 2008→2024 swing
- -5.7pp toward R · 2008: 70.5pp · 2024: 64.8pp
- All cycles
- 2024: D+64.8 2020: D+72.5 2016: D+76.1 2012: D+70.2 2008: D+70.5
Not yet ingested
- Civics
- —
Market trends
- HPI YoY
- ▲ 9.51%
- Current HPI
- 223.6988
- Rent YoY
- ▲ 14.40%
- Metro
- San Francisco-Oakland-Berkeley, CA
- State GDP YoY
- ▲ 3.21%
- F500 in state
- 116
Industry mix (Fortune 500 HQ in CA)
| Industry | F500 HQs | Revenue |
|---|---|---|
| Technology | 27 | $1,492B |
|
||
| Financial Services | 3 | $174B |
|
||
| Retail | 3 | $44B |
|
||
| Insurance | 3 | $26B |
|
||
| Media / Entertainment | 2 | $115B |
|
||
| Pharmaceuticals / Biotech | 2 | $62B |
|
||
Price history
+76.4% since first listed7 events — show timeline
- 2026-06-15 Sold (MLS) $1,150,000 bridgeMLS, Bay East AOR, or Contra Costa AOR
- 2026-05-23 Pending — bridgeMLS, Bay East AOR, or Contra Costa AOR
- 2026-05-07 Listed $995,000 bridgeMLS, Bay East AOR, or Contra Costa AOR
- 2020-12-24 Sold (Public Records) $1,010,000 Public Records
- 2013-05-17 Sold (Public Records) $867,000 Public Records
- 2008-06-19 Sold (Public Records) $855,000 Public Records
- 2004-03-04 Sold (Public Records) $652,000 Public Records
Property tax history
+3.0%/yrLatest (2025): $13,737 · +2.9% YoY. Source: county tax records.
Cash-flow waterfall
monthlySold comps — $/sqft
last 12 mo · ≤1 miLoading sold comps…