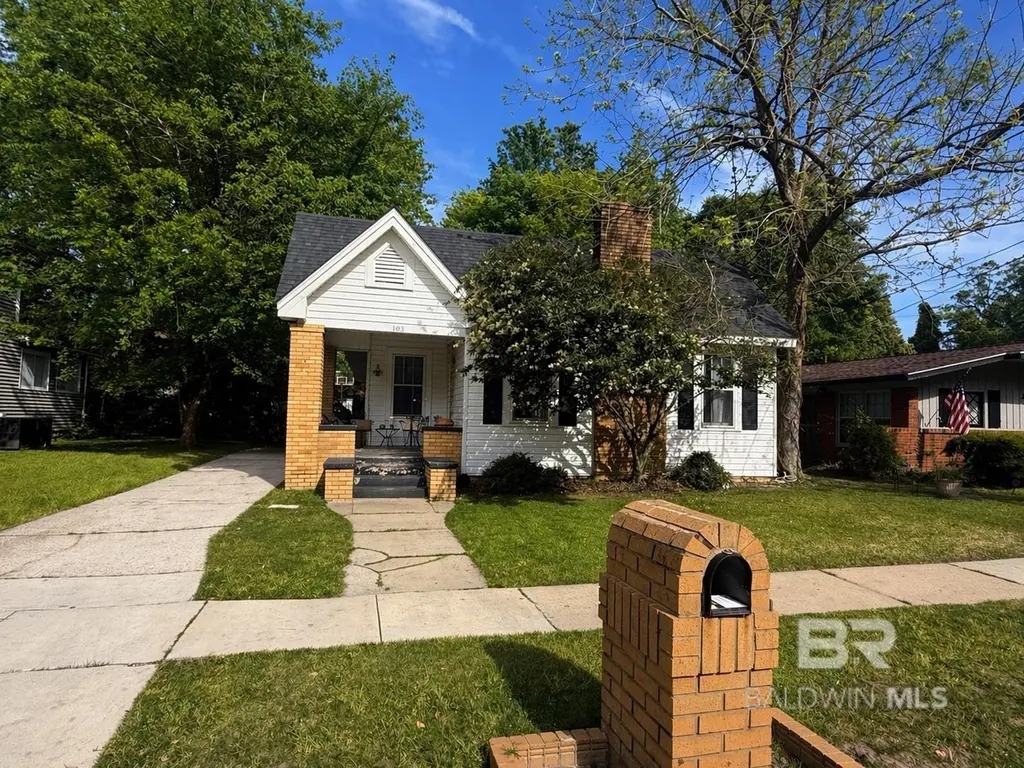
103 Glenwood St · Mobile, AL
Flood risk 8/10 · Major
- FEMA flood zone
- A
- Chance of flooding over 30 yrs
- 0.99%
- Est. flood insurance / yr
- $1,009 – $1,996
Fire risk 1/10 · Minimal
- Est. fire insurance / yr
- $916 – $1,700
Heat risk 9/10 · Severe
- Hot days now (above 105°F)
- 7 days/yr
- Hot days in 30 yrs
- 21 days/yr
Wind risk 9/10 · Severe
- Chance of severe wind over 30 yrs
- 99.0%
Air-quality risk 2/10 · Minimal
- Unhealthy air days now
- 1 days/yr
- Unhealthy air days in 30 yrs
- 1 days/yr
Risk factors via First Street. Map © Google.
Why this score? — see what drove the C grade
The composite is a weighted blend of 9 inputs, each scored 0–100. Each bar is that input's sub-score; the figure is the points it added to the 100-point composite (weight × sub-score).
- Cash flow +20.8/30.0
- ARV discount +15.0/15.0
- DSCR +6.6/10.0
- 1% rule +4.4/10.0
- Rent growth +3.8/5.0
- Livability +3.8/5.0
- Condition / age +2.5/5.0
- Schools +2.3/10.0
- Appreciation +0.0/10.0
$199,000
🖨 Deal sheet 📄 Offer letter ✓ Due diligence
Listing remarks MLS
ADDITIONAL PHOTOS COMING SOON. Located on one of the most charming streets in the heart of Midtown, this classic Craftsman cottage at 103 Glenwood Street blends historic character with strong investment potential — making it an ideal option for homeowners, investors, or those looking for a future rental property. From the moment you arrive, you’ll notice the timeless Craftsman curb appeal, inviting front porch, and mature neighborhood setting that Midtown buyers and renters actively seek out. Inside, the home offers 1,798 square feet of flexible living space with three bedrooms and two bathrooms, original hardwood floors, and plenty of room to live comfortably while also maximizing value. Homes in Midtown Mobile continue to see strong demand thanks to their walkability, proximity to downtown Mobile, local hospitals, restaurants, and shopping. The spacious layout offers a spacious living area with fireplace, generous bedrooms including a true primary suite with multiple walk-in closets and dressing area, and the kind of charm you simply can’t recreate — from architectural details to classic design elements that make Midtown homes so desirable. Properties like this also offer the opportunity to add value over time with thoughtful updates while maintaining the original character that buyers love. Midtown Mobile homes with this combination of charm, size, and investment upside are hard to find. Schedule your showing today and see the potential for yourself. PROPERTY TO BE SOLD AS-IS, WHERE-IS. No warranties to be expressed or implied. Buyer/buyers agent to verify all information that they deem important. Buyer to verify all information during due diligence.
Key facts
- Inviting front porch
- Spacious living area
- True primary suite
Tags
Neighborhood map
What this means for you Summary
Snapshot
- This is a 3-bed/2.0-bath single-family listed at $199k.
Deal economics
- At list price, monthly cash flow is $150 ($2k/yr) — positive.
- The deal already cash-flows at list — no discount required.
- To meet the 1% rule (rent ≥ 1% of price), the offer needs to be $188k (5.8% below list).
- Recommended offer: $187k (6.0% below list) — sets the bar for market timing.
- Cap rate 7.9% vs local median 4.9% in Mobile — top-decile yield for the area; either an underpriced asset or a hidden risk that comps aren't pricing in. Stress-test before assuming the spread holds.
Location & tenants
- Location reads 75/100 on livability (#20 in AL, #4,262 nationally) — a middle-class / working-renter tenant base. Strengths: commute A+, cost of living A+, housing A+; Watch: schools D-, crime F, employment D-.
- Mobile County (urban): math 15% / reading 39% proficiency, ranked #81 of 129 in AL (top 63%) — low school quality limits family demand, transient renter base, plan for 1-2y turnover; 67% free/reduced lunch — lower-income household profile, screen leases tightly.
- Market conditions: Rents rising fast (+5.1%/yr); 174 active listings in the ZIP; 26 comparable units currently listed for rent nearby; rentals at typical pace (median 21d on market — plan ~3-4 weeks tenant-placement turnaround); 42% of comp listings sitting > 30 days — soft ceiling on asking rent; 1,678 units permitted in Mobile County in 2024 (264 in 5+ unit buildings).
- This rent runs 44% of the median local income ($51k/yr) — at the standard rent-burdened threshold; future hikes will face affordability resistance.
Forward outlook
- Local home prices are declining (-3.0%/yr); year-one equity from $1k of loan paydown is wiped out by about $6k of value loss. Plan a longer hold.
- Mobile County population projected to shrink 8% by 2050 — rents likely to lag national; underwrite the cash flow, not the appreciation.
Negotiation context
- It's been on market 70 days — a 6% lower offer ($187k) is reasonable based on typical stale-listing flexibility.
- 2 sale attempts with the ask held roughly flat each time — persistent listings suggest the price (not the market) is what's stuck; bring a comps-based counter.
- Current owner paid $121k; list at $199k implies a 64% gain — meaningful room to come down on a strong offer.
Risks & watch-outs
- Watch-outs: flood insurance adds $125/mo; built in 1935 — expect roof / HVAC / electrical / plumbing capex.
- Climate carrying-cost: in FEMA flood zone A (mandatory federal flood insurance); severe wind risk, 99% chance of damaging wind over 30y; extreme-heat days projected 7→21/yr by 2055 (HVAC capex compounding) — expect insurance premiums to compound above CPI over the hold.
Questions for the listing agent
- It's been on market 70 days. Have you received any prior offers? Is the seller open to a 6% concession, seller financing, or rate buy-down credit?
- Built in 1935 — when were the roof, HVAC, electrical panel, plumbing, and water heater last replaced?
- What's the actual annual flood-insurance premium (NFIP or private), and is the property in a SFHA with mandatory coverage?
- Why hasn't it sold? Are there any deal-killer items the seller is aware of (foundation, flood, title, zoning, code violations)?
- Is there a deadline driving the sale (1031 exchange, divorce, estate, relocation)? That informs how much negotiation room exists.
- Schools are D-rated, which usually means shorter tenancies and higher turnover. Who's the typical renter profile here, and what's been the actual vacancy rate?
- Crime grade is F in this area — have there been break-ins, vandalism, or insurance claims at this property in the last 3 years? What carrier currently insures it and at what premium?
- What's the average days-on-market for RENTAL listings here right now (not sales)? A rising rental-DOM trend means longer vacancies and softer asking-rent achievability than the comps imply.
- What's the recent tenant-quality profile in this submarket — average credit score on applications, eviction rate, late-payment / NSF rate, and stable-employment percentage? A property-management company in the area should have these aggregated.
- How much new for-sale + rental construction is in the pipeline within 1–3 miles? Heavy new supply typically softens prices + rents 12–24 months out; constrained supply supports both.
Investment metrics
- 1% rule
- 0.94% ✗
- Cap rate
- 7.95%
- Cash-on-cash
- 5.92%
- DSCR
- 1.26
- GRM
- 8.8
CMA / ARV
- ARV (median comp)
- $286,820
- List price
- $199,000
- Delta
- -30.62%
- Verdict
- UNDERPRICED
- Comps
- 20 within 1.0 mi
Show comp detail 12 sales within ~0.75 mi
| Address | Dist | Beds/Ba | Sqft | Sold | Price | $/sf | Match |
|---|---|---|---|---|---|---|---|
| 56 Fulton St S | 0.10mi | 3/2.0 | 1,744 (-3%) | 3mo | $339,000 | $194 | 88 |
| 66 Houston St | 0.53mi | 3/2.0 | 1,820 (+1%) | 3mo | $355,000 | $195 | 71 |
| 109 Mohawk St | 0.07mi | 3/2.0 | 1,544 (-14%) | 3mo | $245,000 | $159 | 71 |
| 2103 Upham Pl | 0.38mi | 3/2.0 | 1,667 (-7%) | 2mo | $289,750 | $174 | 68 |
| 1747 Hunter Ave | 0.67mi | 3/2.0 | 1,788 (-1%) | 0mo | $357,000 | $200 | 68 |
| 2456 Richard Ave | 0.50mi | 4/2.0 (+1) | 1,768 (-2%) | 2mo | $229,000 | $130 | 67 |
| 136 Florence Pl | 0.49mi | 3/2.0 | 1,910 (+6%) | 0mo | $350,000 | $183 | 66 |
| 12 Carlen St S | 0.36mi | 3/2.0 | 1,604 (-11%) | 2mo | $280,000 | $175 | 63 |
| 253 Cherokee St | 0.62mi | 3/2.0 | 1,900 (+6%) | 2mo | $189,000 | $99 | 60 |
| 313 Morgan Ave | 0.63mi | 3/2.0 | 1,667 (-7%) | 2mo | $125,000 | $75 | 56 |
| 2153 Old Government St | 0.36mi | 4/2.0 (+1) | 1,558 (-13%) | 2mo | $209,900 | $135 | 54 |
| 1850 Old Shell Rd | 0.47mi | 4/2.0 (+1) | 2,020 (+12%) | 1mo | $390,000 | $193 | 52 |
Match score weights: distance 35% · size 25% · config 20% · recency 20%. Top-matched comps best support the ARV.
Projected returns pro-forma
-3.0% appreciation · 5.06% rent growth · sell at horizon
- IRR
- -9.0%
- Equity multiple
- 0.66×
- Total profit
- $-18,753
- Equity at exit
- $29,672
- IRR
- 3.0%
- Equity multiple
- 1.23×
- Total profit
- $12,920
- Equity at exit
- $17,206
Cash invested: $55,720 (down + closing). Projections, not guarantees.
Landlord ↔ Tenant lean methodology
- Overall (STATE)
- 90 Strongly Landlord-Friendly
- State Alabama
- 90 Strongly Landlord-Friendly · R+15
- County
- — inherits STATE
- City
- — inherits STATE
ZIP-level market 36606
- Rents YoY
- 5.1%
- Active inventory
- 174
- Price-to-rent
- 8.8×
Monthly cashflow live
- Estimated rent
- $1,875 high interval (Pro) →
- Mortgage (P&I)
- −$1,044
- Tax from tax record
- −$80 /mo · $962/yr
- Insurance
- −$83
- Flood insurance flood zone
- −$125 /mo · $1,502/yr
- HOA
- −$0
- Vacancy / Maint / Mgmt
- −$394
- Net cashflow
- $150
Break-even live
UW: 25.0% down · 7.5% · 30yr · 1.5% tax · 5.0% vac · 8.0% maint · 8.0% mgmt
Financing live
Cash to close
- Down payment
- $49,750
- Closing costs
- $5,970
- Reserves months
- —
- Total cash needed
- —
Loan-product check · same deal, 3 products live
Conventional
25% down · 7.5% · 30yr
- Down + closing
- —
- Monthly P&I
- —
- Monthly cashflow
- —
- DSCR
- —
- Eligible?
- —
Personal DTI + credit; lowest rate.
DSCR
20% down · 8.5% · 30yr
- Down + closing
- —
- Monthly P&I
- —
- Monthly cashflow
- —
- DSCR
- —
- Eligible?
- —
No personal income docs; deal must DSCR.
Hard money
10% down · 12.0% · 12mo
- Down + closing
- —
- Monthly P&I
- —
- Monthly cashflow
- —
- DSCR
- —
- Eligible?
- —
Short-term bridge; refi at stabilization.
Rent comps 26 comps
| Address | Beds | Baths | Sqft | Rent | $/sqft | DOM | Units | Dist |
|---|---|---|---|---|---|---|---|---|
| 182 Williams St Unit 1043570P Mobile, AL | 3.0 | 1.0 | 1399 | $2,476 | $1.77 | 13d | 1 | 0.23mi |
| 209 S Fulton St Mobile, AL | 2.0 | 1.5 | 1255 | $1,750 | $1.39 | 21d | 1 | 0.24mi |
| 122 Demouy Ave Unit 1/2 Mobile, AL | 2.0 | 1.0 | 1300 | $1,530 | $1.18 | 43d | 1 | 0.39mi |
| 2507 Taylor Ave Mobile, AL | 3.0 | 1.0 | 1230 | $1,495 | $1.22 | 13d | 1 | 0.55mi |
| 129 Shell Road Pl Unit 1043713P Mobile, AL | 4.0 | 2.0 | 1496 | $3,389 | $2.27 | 21d | 1 | 0.65mi |
| 1704 McGill Ave Unit B Mobile, AL | 3.0 | 2.5 | 1500 | $1,750 | $1.17 | 43d | 1 | 0.69mi |
| 1660 Laurel St Mobile, AL | 3.0 | 2.0 | 1768 | $2,200 | $1.24 | 13d | 1 | 0.70mi |
| 186 Stanton Rd Mobile, AL | 1.0–3.0 | 1.0–2.5 | 1263 | $2,450 | $1.94 | 43d | 1 | 0.78mi |
| 561 Dauphin Island Pkwy Mobile, AL | 4.0 | 2.0 | 1389 | $1,050 | $0.76 | 43d | 1 | 0.85mi |
| 107 Macy Pl Mobile, AL | 3.0 | 2.0 | 1800 | $2,250 | $1.25 | 43d | 1 | 0.86mi |
| 412 Pinehill Dr Mobile, AL | 2.0 | 2.0 | 2000 | $2,450 | $1.23 | 13d | 1 | 0.87mi |
| 611 Dauphin Island Pkwy Mobile, AL | 3.0 | 2.0 | 1450 | $1,300 | $0.90 | 43d | 1 | 0.94mi |
| 1566 Dauphin St Unit Back Carriage House Mobile, AL | 3.0 | 1.0 | 1300 | $1,200 | $0.92 | 43d | 1 | 0.94mi |
| 305 Indian Creek Dr E Unit 1043809P Mobile, AL | 3.0 | 2.5 | 1496 | $3,985 | $2.66 | 13d | 1 | 0.96mi |
| 618 Clarke St Mobile, AL | 3.0 | 1.0 | 1427 | $1,200 | $0.84 | 43d | 1 | 0.97mi |
| 2500 Dauphinwood Dr Mobile, AL | 2.0–3.0 | 1.0–2.0 | 1250 | $1,395 | $1.12 | 13d | 19 | 0.99mi |
| 84 S Lafayette St Unit 1043577P Mobile, AL | 3.0 | 2.0 | 1496 | $3,116 | $2.08 | 13d | 1 | 1.09mi |
| 706 Cherokee St Mobile, AL | 3.0 | 1.0 | 1260 | $1,375 | $1.09 | 21d | 1 | 1.16mi |
| 418 Durande Dr Mobile, AL | 3.0 | 2.0 | 1456 | $1,350 | $0.93 | 13d | 1 | 1.16mi |
| 150 Dunn Ave Mobile, AL | 3.0 | 2.0 | 1455 | $1,250 | $0.86 | 21d | 1 | 1.20mi |
| 713 Iris Ave Mobile, AL | 3.0 | 1.0 | 1617 | $1,300 | $0.80 | 21d | 1 | 1.27mi |
| 315 Hadrian St Mobile, AL | 3.0 | 2.0 | 1843 | $1,800 | $0.98 | 43d | 1 | 1.31mi |
| 2861 Ralston Rd Mobile, AL | 3.0 | 2.0 | 1617 | $1,650 | $1.02 | 43d | 1 | 1.32mi |
| 2861 Potter Dr Unit 1043844P Mobile, AL | 3.0 | 2.0 | 1496 | $2,492 | $1.67 | 21d | 1 | 1.33mi |
| 2863 Potter Dr Unit 1043693P Mobile, AL | 4.0 | 2.0 | 1496 | $3,049 | $2.04 | 13d | 1 | 1.34mi |
| 2068 Victory Ct Mobile, AL | 4.0 | 1.0 | 1259 | $1,225 | $0.97 | 43d | 1 | 1.49mi |
Listing history 19 events
-
2026-06-18days on market $199,000 Active 70 DOM
-
2026-06-17days on market $199,000 Active 69 DOM
-
2026-06-16days on market $199,000 Active 68 DOM
-
2026-06-15days on market $199,000 Active 67 DOM
-
2026-06-14days on market $199,000 Active 65 DOM
-
2026-06-13days on market $199,000 Active 64 DOM
-
2026-06-10days on market $199,000 Active 62 DOM
-
2026-06-09days on market $199,000 Active 61 DOM
-
2026-06-08days on market $199,000 Active 60 DOM
-
2026-06-07days on market $199,000 Active 59 DOM
-
2026-06-05days on market $199,000 Active 56 DOM
-
2026-06-03days on market $199,000 Active 55 DOM
-
2026-06-02days on market $199,000 Active 54 DOM
-
2026-06-01days on market $199,000 Active 53 DOM
-
2026-05-31days on market $199,000 Active 52 DOM
-
2026-05-30days on market $199,000 Active 51 DOM
-
2026-04-09$199,000 Active 1705-char remark
Show marketing remark (1705 chars)
ADDITIONAL PHOTOS COMING SOON. Located on one of the most charming streets in the heart of Midtown, this classic Craftsman cottage at 103 Glenwood Street blends historic character with strong investment potential — making it an ideal option for homeowners, investors, or those looking for a future rental property. From the moment you arrive, you’ll notice the timeless Craftsman curb appeal, inviting front porch, and mature neighborhood setting that Midtown buyers and renters actively seek out. Inside, the home offers 1,798 square feet of flexible living space with three bedrooms and two bathrooms, original hardwood floors, and plenty of room to live comfortably while also maximizing value. Homes in Midtown Mobile continue to see strong demand thanks to their walkability, proximity to downtown Mobile, local hospitals, restaurants, and shopping. The spacious layout offers a spacious living area with fireplace, generous bedrooms including a true primary suite with multiple walk-in closets and dressing area, and the kind of charm you simply can’t recreate — from architectural details to classic design elements that make Midtown homes so desirable. Properties like this also offer the opportunity to add value over time with thoughtful updates while maintaining the original character that buyers love. Midtown Mobile homes with this combination of charm, size, and investment upside are hard to find. Schedule your showing today and see the potential for yourself. PROPERTY TO BE SOLD AS-IS, WHERE-IS. No warranties to be expressed or implied. Buyer/buyers agent to verify all information that they deem important. Buyer to verify all information during due diligence.
-
2004-08-04soldstatus $121,130
ⓘ Source: listings_history table (triggers on properties + properties_extension) + one-shot
backfill from property_details.listing_events for pre-trigger history.
Tax reassessment forecast AL · Resets to sale price
- Current annual tax
- $962 · $80/mo
- Projected year-2 tax
- $962 · $80/mo
- Expected delta
- $0/yr ($0/mo · -0.0%)
ⓘ Screening estimate from a state-policy table — verify with the county assessor before closing.
Climate risk First Street
- Flood 8/10 Severe FEMA zone A · 99% chance over 30 yrs
- Wildfire 1/10 Low
- Heat 9/10 Extreme 7 d/yr ≥105°F today · 21 d/yr by 30 yrs out
- Wind 9/10 Extreme 99% chance of damaging wind over 30 yrs
- Air quality 2/10 Low 1 unhealthy d/yr today · 1 by 30 yrs out
Nearby sold comps map
Loading sold comps map…
Walkable amenities ~0.75 mi
Loading nearby amenities…
Taxation est. · year 1
- Rental income
- $22,502
- − Mortgage interest
- −$11,147
- − Property taxes
- −$962
- − Insurance
- −$2,498
- − Repairs & maintenance
- −$1,800
- − Management
- −$1,800
- − Depreciation
- −$5,789
- Taxable loss
- −$1,493
- Est. tax savings @ 24.0%
- +$358
- After-tax cash flow
- $2,153/yr
For passive investors: Depreciation is non-cash, so a rental often shows a tax loss while cash-flowing — sheltering income. Rental losses are passive: they offset passive income freely, and up to $25,000/yr can offset ordinary (W-2) income if you actively participate and your MAGI is under $100k (phasing out to $0 by $150k); unused losses carry forward. On sale, claimed depreciation is recaptured at up to 25%, and gains may owe capital-gains tax (a 1031 exchange can defer both). Figures are a year-1 estimate at your 24.0% rate — not tax advice; consult a CPA.
Schools (NCES district)
- District
- Mobile County
- NCES district ID
- 0102370
- Math proficiency
- 15% ▼ -28.00%
- Reading proficiency
- 39% ▬ 0.00%
- Median HH income
- $42,455
- Composite
- 22.9/100
- National rank
- #8002
- State rank
- #81 of 129 in AL
Livability — Mobile
- Score
- 75/100
- State rank
- #20
- US rank
- #4262
Category grades
Schools grade is shown separately in the Schools card above.
Census & demographics
- Census place
- Mobile, AL
- County
- Mobile County · 246,577 people
- City population
- 205,729
- Metro
- Mobile, AL
- Population (ZIP)
- 18,728
- Household income
- $51,303
- Rent vs Own
- Severe rent burden
- 999.0
Population outlook (Mobile County) Hauer SSP2
- Today (2025)
- 415,303 people
- By 2030
- 411,755 · -0.9%
- By 2040
- 399,670 · -3.8%
- By 2050
- 382,616 · -7.9%
- By 2075
- 337,353 · -18.8%
- By 2100
- 283,391 · -31.8%
Race, ethnicity, and origin ACS 2023
- Neighborhood character
- Majority Black (56%)
- Race & ethnicity
- Black 56% White 37% Two or more races 5% Hispanic / Latino 4%
- Common ancestry
- Italian 2% Scottish 2% Lithuanian 1%
- Foreign-born
- 3% · Canada
- Languages at home
- 96% English-only · Spanish 3%
Political lean MEDSL · Mobile
- 2024 margin
- R (+16.4) · D 41.3% · R 57.7%
- 2008→2024 swing
- -7.7pp toward R · 2008: -8.7pp · 2024: -16.4pp
- All cycles
- 2024: R+16.4 2020: R+11.9 2016: R+13.9 2012: R+9.3 2008: R+8.7
Not yet ingested
- Civics
- —
Market trends
- HPI YoY
- ▼ -232.19%
- Current HPI
- 145.9025
- Rent YoY
- ▲ 5.06%
- Metro
- Mobile, AL
- State GDP YoY
- ▲ 2.94%
- F500 in state
- 4
Industry mix (Fortune 500 HQ in AL)
| Industry | F500 HQs | Revenue |
|---|---|---|
| Financial Services | 1 | $8B |
|
||
| Healthcare | 1 | $5B |
|
||
Price history
+64.3% since first listed3 events — show timeline
- 2026-04-09 Listed $199,000 GCMLS AL
- 2026-04-09 Listed $199,000 BCAR
- 2004-08-04 Sold (Public Records) $121,130 Public Records
Property tax history
+0.0%/yrLatest (2025): $962 · +4.4% YoY. Source: county tax records.
Cash-flow waterfall
monthlySold comps — $/sqft
last 12 mo · ≤1 miLoading sold comps…