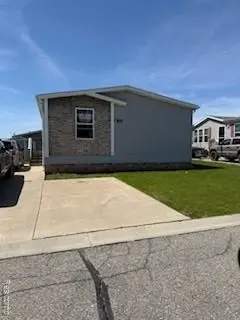
9885 Bellcrest Blvd · Hartland, MI
Flood risk No data
- FEMA flood zone
- —
- Chance of flooding over 30 yrs
- —
- Est. flood insurance / yr
- —
Fire risk No data
- Est. fire insurance / yr
- —
Heat risk No data
- Hot days now (above threshold)
- —
- Hot days in 30 yrs
- —
Wind risk No data
- Chance of severe wind over 30 yrs
- —
Air-quality risk No data
- Unhealthy air days now
- —
- Unhealthy air days in 30 yrs
- —
Risk factors via First Street. Map © Google.
Why this score? — see what drove the D grade
The composite is a weighted blend of 9 inputs, each scored 0–100. Each bar is that input's sub-score; the figure is the points it added to the 100-point composite (weight × sub-score).
- Cash flow +14.0/30.0
- 1% rule +10.0/10.0
- Schools +5.2/10.0
- DSCR +4.2/10.0
- Condition / age +4.0/5.0
- Rent growth +3.1/5.0
- Livability +2.5/5.0
- ARV discount +0.0/15.0
- Appreciation +0.0/10.0
$116,900
🖨 Deal sheet (PDF) 📄 Offer letter ✓ Due diligence
Listing remarks MLS
Welcome to 9885 Bell Crest Blvd in the desirable Cider Mills Crossing community of Fenton! This beautifully updated 4-bedroom, 2-bath home offers 1,539 square feet of comfortable living space with a fresh, modern feel throughout. Step inside to discover brand-new flooring, updated bathrooms, and a refreshed kitchen that blends style and functionality - perfect for everyday living and entertaining. The spacious layout provides flexibility for growing households, guests, or a home office setup. Enjoy the charm of a well-maintained neighborhood while being conveniently located near shopping, dining, and local amenities. This move-in ready home is a fantastic opportunity to enjoy both comfort and convenience in a great location. Schedule your showing today and come see all this home has to offer!
Key facts
- Community pool
- Built 2012
- Listed 46 days
Property features AI
Finance
- Other: Lot approximately 10 x 10 acres
- HOA & community: Homeowners association with clubhouse, pool and fitness center; HOA fee $762 monthly
Exterior
- Parking: No garage
- Utilities: Public water; Public sewer
- Home design: Single-family residence; One level; Ground-level entry with steps; Vinyl siding; Facing not specified
- Construction: Asphalt roof; Built on slab foundation
- Exterior features: Deck; Basketball court; Shed(s); Community pool; Clubhouse; Fitness center; Paved road access
Interior
- Kitchen: Dishwasher; Microwave; Free-standing gas range; Free-standing refrigerator
- Bathrooms: 2 full bathrooms
- Interior features: Dishwasher; Microwave; Free-standing gas range; Free-standing refrigerator; Ceiling fan(s); Central air; Forced air heating; Natural gas heating; 8 total rooms
- Laundry & utility: Laundry room; Washer; Dryer
Neighborhood map
What this means for you Summary
Snapshot
- This is a 4-bed/2.0-bath single-family listed at $117k. Condition is rated good.
Deal economics
- At list price, monthly cash flow is $15 ($184/yr) — positive.
- The deal already cash-flows at list — no discount required.
- Meets the 1% rule at list price ($2k rent vs $117k).
- Recommended offer: $113k (3.0% below list) — sets the bar for market timing.
- Cap rate 6.5% vs local median 2.9% in Hartland — top-decile yield for the area; either an underpriced asset or a hidden risk that comps aren't pricing in. Stress-test before assuming the spread holds.
Location & tenants
- Location reads: area grade D — affects rentability + tenant quality, not the cash-flow math above.
- Hartland Consolidated Schools (suburban): math 52% / reading 62% proficiency, ranked #41 of 540 in MI (top 8%) — acceptable for families but not a draw, mixed tenant base, ~2y average lease; only 11% free/reduced lunch — higher-income household profile.
- Zoned schools: Hartland Village Elementary School (math 37% / reading 42%, grade F, #606 of 1,397 statewide, top 48%, 474 students, 29% FRL); Hartland Ms At Ore Creek (math 57% / reading 66%, grade B+, #47 of 493 statewide, top 10%, 766 students, 17% FRL); Hartland High School (math 47% / reading 69%, grade C, #92 of 713 statewide, top 13%, 1,738 students, 16% FRL).
- Market conditions: Rents rising (+2.6%/yr); 315 active listings in the ZIP; 1 comparable units currently listed for rent nearby; solid renter incomes; 488 units permitted in Livingston County in 2024 (0 in 5+ unit buildings).
Forward outlook
- Local home prices are declining (-3.0%/yr); year-one equity from $808 of loan paydown is wiped out by about $4k of value loss. Plan a longer hold.
- Livingston County population projected at +7% by 2050 — modest demand growth; plan on rents tracking national, not racing it.
Negotiation context
- It's been on market 46 days — a 3% lower offer ($113k) is reasonable based on typical stale-listing flexibility.
- 2 sale attempts with the ask held roughly flat each time — persistent listings suggest the price (not the market) is what's stuck; bring a comps-based counter.
Risks & watch-outs
- Watch-outs: HOA is 38% of rent.
Questions for the listing agent
- It's been on market 46 days. Have you received any prior offers? Is the seller open to a 3% concession, seller financing, or rate buy-down credit?
- What does the HOA fee cover, when was the last increase, and are there any pending special assessments or reserve-fund shortfalls?
- Is there a deadline driving the sale (1031 exchange, divorce, estate, relocation)? That informs how much negotiation room exists.
- The area grade is low — what's the realistic commute time and amenity access for the typical tenant pool here? Any planned neighborhood developments (good or bad) we should know about?
- What's the average days-on-market for RENTAL listings here right now (not sales)? A rising rental-DOM trend means longer vacancies and softer asking-rent achievability than the comps imply.
- What's the recent tenant-quality profile in this submarket — average credit score on applications, eviction rate, late-payment / NSF rate, and stable-employment percentage? A property-management company in the area should have these aggregated.
- How much new for-sale + rental construction is in the pipeline within 1–3 miles? Heavy new supply typically softens prices + rents 12–24 months out; constrained supply supports both.
Investment metrics
- 1% rule
- 1.72% ✓
- Cap rate
- 6.45%
- Cash-on-cash
- 0.56%
- DSCR
- 1.02
- GRM
- 4.9
CMA / ARV
- ARV (median comp)
- $91,931
- List price
- $116,900
- Delta
- 27.16%
- Verdict
- OVERPRICED
- Comps
- 20 within 1.0 mi
Show comp detail 12 sales within ~0.75 mi
| Address | Dist | Beds/Ba | Sqft | Sold | Price | $/sf | Match |
|---|---|---|---|---|---|---|---|
| 9817 Bellcrest Blvd | 0.15mi | 3/2.0 (-1) | 1,500 (-2%) | 12mo | $58,000 | $39 | 74 |
| 6256 Chadwick Ave | 0.06mi | 3/2.0 (-1) | 1,456 (-5%) | 12mo | $56,000 | $38 | 73 |
| 9854 Townsquare Blvd | 0.12mi | 3/2.0 (-1) | 1,456 (-5%) | 10mo | $70,000 | $48 | 72 |
| 6309 Chadwick Ave | 0.10mi | 3/2.0 (-1) | 1,456 (-5%) | 12mo | $70,000 | $48 | 71 |
| 6149 Andora Ave | 0.22mi | 3/2.0 (-1) | 1,568 (+2%) | 16mo | $83,000 | $53 | 68 |
| 6157 Addison Way | 0.20mi | 3/2.0 (-1) | 1,568 (+2%) | 23mo | $77,500 | $49 | 63 |
| 9655 Besants Ct | 0.45mi | 3/2.0 (-1) | 1,560 (+1%) | 13mo | $128,000 | $82 | 61 |
| 6283 Leigh Ct | 0.12mi | 3/2.0 (-1) | 1,736 (+13%) | 9mo | $68,000 | $39 | 61 |
| 9705 Townsquare Blvd | 0.34mi | 3/2.0 (-1) | 1,624 (+6%) | 22mo | $85,500 | $53 | 52 |
| 9674 Townsquare Blvd | 0.39mi | 4/2.0 | 1,680 (+9%) | 20mo | $122,000 | $73 | 50 |
| 10056 Carlee June Dr | 0.72mi | 3/2.0 (-1) | 1,425 (-7%) | 1mo | $310,000 | $218 | 49 |
| 10095 Carlee June Dr | 0.70mi | 3/1.5 (-1) | 1,696 (+10%) | 13mo | $355,000 | $209 | 32 |
Match score weights: distance 35% · size 25% · config 20% · recency 20%. Top-matched comps best support the ARV.
Projected returns pro-forma
-3.0% appreciation · 2.59% rent growth · sell at horizon
- IRR
- -15.8%
- Equity multiple
- 0.44×
- Total profit
- $-18,293
- Equity at exit
- $17,430
- IRR
- -7.9%
- Equity multiple
- 0.51×
- Total profit
- $-16,003
- Equity at exit
- $10,107
Cash invested: $32,732 (down + closing). Projections, not guarantees.
Landlord ↔ Tenant lean methodology
- Overall (STATE)
- 62 Landlord-Friendly
- State Michigan
- 62 Landlord-Friendly · EVEN
- County
- — inherits STATE
- City
- — inherits STATE
ZIP-level market 48430
- Rents YoY
- 2.6%
- Active inventory
- 315
- Price-to-rent
- 4.9×
Monthly cashflow live
- Estimated rent
- $2,007 medium interval (Pro) →
- Mortgage (P&I)
- −$613
- Tax est. 1.5%
- −$146 /mo · $1,754/yr
- Insurance
- −$49
- HOA
- −$762
- Vacancy / Maint / Mgmt
- −$421
- Net cashflow
- $15
Break-even live
Sensitivity live
| Price | -10% $96 | -5% $56 | +0% $15 | +5% $-25 | +10% $-65 |
|---|---|---|---|---|---|
| Rent | -10% $-143 | -5% $-64 | +0% $15 | +5% $95 | +10% $174 |
| Rate | -1.0pp $74 | -0.5pp $45 | base $15 | +0.5pp $-15 | +1.0pp $-46 |
UW: 25.0% down · 7.5% · 30yr · 1.5% tax · 5.0% vac · 8.0% maint · 8.0% mgmt
Financing live
Cash to close
- Down payment
- $29,225
- Closing costs
- $3,507
- Reserves months
- —
- Total cash needed
- —
Loan-product check · same deal, 3 products live
Conventional
25% down · 7.5% · 30yr
- Down + closing
- —
- Monthly P&I
- —
- Monthly cashflow
- —
- DSCR
- —
- Eligible?
- —
Personal DTI + credit; lowest rate.
DSCR
20% down · 8.5% · 30yr
- Down + closing
- —
- Monthly P&I
- —
- Monthly cashflow
- —
- DSCR
- —
- Eligible?
- —
No personal income docs; deal must DSCR.
Hard money
10% down · 12.0% · 12mo
- Down + closing
- —
- Monthly P&I
- —
- Monthly cashflow
- —
- DSCR
- —
- Eligible?
- —
Short-term bridge; refi at stabilization.
Rent comps 1 comps
| Address | Beds | Baths | Sqft | Rent | $/sqft | DOM | Units | Dist |
|---|---|---|---|---|---|---|---|---|
| 9900 Townsquare Blvd Fenton, MI | 3.0 | 2.0 | 1456 | $1,449 | $1.00 | 0d | 1 | 0.10mi |
HOA detail
- Monthly dues
- $762 · $9,144/yr
Listing history 17 events
-
2026-06-21days on market $116,900 Active 46 DOM
-
2026-06-18days on market $116,900 Active 43 DOM
-
2026-06-17days on market $116,900 Active 42 DOM
-
2026-06-16days on market $116,900 Active 41 DOM
-
2026-06-15days on market $116,900 Active 40 DOM
-
2026-06-13days on market $116,900 Active 38 DOM
-
2026-06-13days on market $116,900 Active 37 DOM
-
2026-06-09days on market $116,900 Active 34 DOM
-
2026-06-08days on market $116,900 Active 33 DOM
-
2026-06-07days on market $116,900 Active 32 DOM
-
2026-06-04days on market $116,900 Active 29 DOM
-
2026-06-03days on market $116,900 Active 28 DOM
-
2026-06-02days on market $116,900 Active 27 DOM
-
2026-06-01days on market $116,900 Active 26 DOM
-
2026-05-31days on market $116,900 Active 25 DOM
-
2026-05-05$119,000 Active 807-char remark
Show marketing remark (803 chars)
Welcome to 9885 Bell Crest Blvd in the desirable Cider Mills Crossing community of Fenton! This beautifully updated 4-bedroom, 2-bath home offers 1,539 square feet of comfortable living space with a fresh, modern feel throughout. Step inside to discover brand-new flooring, updated bathrooms, and a refreshed kitchen that blends style and functionality - perfect for everyday living and entertaining. The spacious layout provides flexibility for growing households, guests, or a home office setup. Enjoy the charm of a well-maintained neighborhood while being conveniently located near shopping, dining, and local amenities. This move-in ready home is a fantastic opportunity to enjoy both comfort and convenience in a great location. Schedule your showing today and come see all this home has to offer!
-
2026-05-05$119,000 Active 803-char remark
Show marketing remark (803 chars)
Welcome to 9885 Bell Crest Blvd in the desirable Cider Mills Crossing community of Fenton! This beautifully updated 4-bedroom, 2-bath home offers 1,539 square feet of comfortable living space with a fresh, modern feel throughout. Step inside to discover brand-new flooring, updated bathrooms, and a refreshed kitchen that blends style and functionality - perfect for everyday living and entertaining. The spacious layout provides flexibility for growing households, guests, or a home office setup. Enjoy the charm of a well-maintained neighborhood while being conveniently located near shopping, dining, and local amenities. This move-in ready home is a fantastic opportunity to enjoy both comfort and convenience in a great location. Schedule your showing today and come see all this home has to offer!
ⓘ Source: listings_history table (triggers on properties + properties_extension) + one-shot
backfill from property_details.listing_events for pre-trigger history.
Nearby sold comps map
Loading sold comps map…
Walkable amenities ~0.75 mi
Loading nearby amenities…
Taxation est. · year 1
- Rental income
- $24,079
- − Mortgage interest
- −$6,548
- − Property taxes
- −$1,754
- − Insurance
- −$584
- − Repairs & maintenance
- −$1,926
- − Management
- −$1,926
- − HOA
- −$9,144
- − Depreciation
- −$3,401
- Taxable loss
- −$1,205
- Est. tax savings @ 24.0%
- +$289
- After-tax cash flow
- $473/yr
For passive investors: Depreciation is non-cash, so a rental often shows a tax loss while cash-flowing — sheltering income. Rental losses are passive: they offset passive income freely, and up to $25,000/yr can offset ordinary (W-2) income if you actively participate and your MAGI is under $100k (phasing out to $0 by $150k); unused losses carry forward. On sale, claimed depreciation is recaptured at up to 25%, and gains may owe capital-gains tax (a 1031 exchange can defer both). Figures are a year-1 estimate at your 24.0% rate — not tax advice; consult a CPA.
Condition & rehab AI · 1 photo
This move-in ready home offers a fresh, modern feel with updated bathrooms and kitchen, and is located in a desirable neighborhood.
Value-add opportunities
- Both Painting exterior and interior walls — Enhances curb appeal and interior aesthetics.
- Both Landscaping improvements — Enhances curb appeal and adds value.
- Both Add a small front porch — Improves curb appeal and provides a welcoming entrance.
Renovation cost estimate screening
Value-add ROI direction
- Both Painting exterior and interior walls — Enhances curb appeal and interior aesthetics. ↑
- Both Landscaping improvements — Enhances curb appeal and adds value. ↑
- Both Add a small front porch — Improves curb appeal and provides a welcoming entrance. ↑
ⓘ Cost ranges are severity-bucket heuristics (US national rule-of-thumb). Get contractor quotes + a written scope before underwriting a rehab budget.
Schools (NCES district)
- District
- Hartland Consolidated Schools
- NCES district ID
- 2617910
- Math proficiency
- 52% ▼ -8.00%
- Reading proficiency
- 62% ▼ -7.00%
- Median HH income
- $85,269
- Composite
- 51.93/100
- National rank
- #1647
- State rank
- #41 of 540 in MI
Livability — Hartland
No livability data for this city. (Only ~50 U.S. cities are tracked.)
Census & demographics
- County
- Livingston County · 121,626 people
- City population
- 7,014
- Metro
- Detroit-Warren-Dearborn, MI
- Population (ZIP)
- 39,309
- Household income
- $100,193
- Rent vs Own
- Severe rent burden
- 642.0
Population outlook (Livingston County) Hauer SSP2
- Today (2025)
- 202,920 people
- By 2030
- 209,173 · +3.1%
- By 2040
- 216,878 · +6.9%
- By 2050
- 217,485 · +7.2%
- By 2075
- 217,590 · +7.2%
- By 2100
- 197,095 · -2.9%
Race, ethnicity, and origin ACS 2023
- Neighborhood character
- Predominantly White (91%)
- Race & ethnicity
- White 91% Two or more races 4% Hispanic / Latino 3% Asian 1% Black 1%
- Common ancestry
- Romanian 10% Lithuanian 5% Slovak 3%
- Foreign-born
- 2% · Canada
- Languages at home
- 97% English-only · Spanish 1% Other Asian/Pacific 1% Other Indo-European 1%
Political lean MEDSL · Livingston
- 2024 margin
- Strong R (+23.9) · D 37.4% · R 61.3% · Other 1.3%
- 2008→2024 swing
- -10.7pp toward R · 2008: -13.3pp · 2024: -23.9pp
- All cycles
- 2024: R+23.9 2020: R+22.6 2016: R+29.6 2012: R+23.3 2008: R+13.3
Not yet ingested
- Civics
- —
Market trends
- HPI YoY
- ▼ -298.66%
- Current HPI
- 238.8371
- Rent YoY
- ▲ 2.59%
- Metro
- Detroit-Warren-Dearborn, MI
- State GDP YoY
- ▲ 1.37%
- F500 in state
- 28
Industry mix (Fortune 500 HQ in MI)
| Industry | F500 HQs | Revenue |
|---|---|---|
| Automotive Parts | 3 | $48B |
|
||
| Automotive | 2 | $372B |
|
||
| Chemicals | 1 | $45B |
|
||
| Automotive Retail | 1 | $29B |
|
||
| Healthcare / Medical Devices | 1 | $23B |
|
||
| Automotive Technology | 1 | $20B |
|
||
Price history
-1.8% since first listed4 events — show timeline
- 2026-05-21 Price Changed $116,900 MiRealSource-MiMLS
- 2026-05-20 Price Changed $116,900 REALCOMP
- 2026-05-05 Listed $119,000 REALCOMP
- 2026-05-05 Listed $119,000 MiRealSource-MiMLS
Cash-flow waterfall
monthlySold comps — $/sqft
last 12 mo · ≤1 miLoading sold comps…