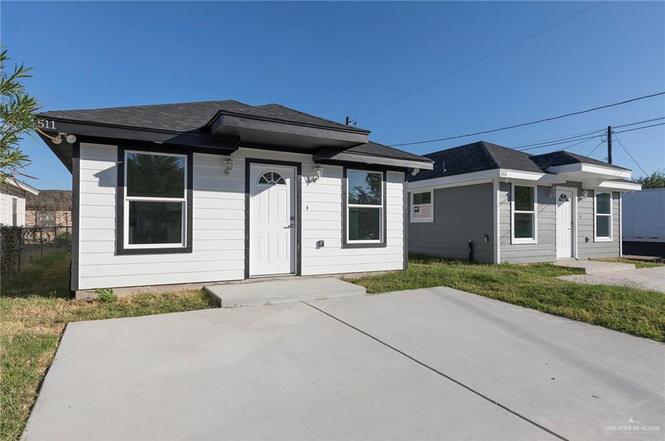
515 E Huisache St · Weslaco, TX
Flood risk 1/10 · Minimal
- FEMA flood zone
- X
- Chance of flooding over 30 yrs
- 0.0%
- Est. flood insurance / yr
- $507 – $1,088
Fire risk 1/10 · Minimal
- Est. fire insurance / yr
- $1,222 – $2,270
Heat risk 9/10 · Severe
- Hot days now (above 111°F)
- 7 days/yr
- Hot days in 30 yrs
- 23 days/yr
Wind risk 8/10 · Major
- Chance of severe wind over 30 yrs
- 99.0%
Air-quality risk 1/10 · Minimal
- Unhealthy air days now
- 0 days/yr
- Unhealthy air days in 30 yrs
- 0 days/yr
Risk factors via First Street. Map © Google.
Why this score? — see what drove the D- grade
The composite is a weighted blend of 9 inputs, each scored 0–100. Each bar is that input's sub-score; the figure is the points it added to the 100-point composite (weight × sub-score).
- Cash flow +10.0/30.0
- ARV discount +5.7/15.0
- Appreciation +4.7/10.0
- Livability +3.6/5.0
- 1% rule +3.0/10.0
- DSCR +2.8/10.0
- Rent growth +2.5/5.0
- Condition / age +2.5/5.0
- Schools +2.2/10.0
$155,000
🖨 Deal sheet (PDF) 📄 Offer letter ✓ Due diligence
Listing remarks
Discover modern living in this brand-new construction home in the heart of Weslaco! This beautiful 3-bedroom, 2-bath home offers 1,000 sq ft of well-designed living space, perfect for first-time buyers, downsizers, or investors. Enjoy the bright and open layout with stylish finishes, energy-efficient features, and attention to detail throughout. Located just minutes from the expressway, this home offers unbeatable convenience. You’ll be close to popular fast food restaurants, local shops, and essential amenities—making daily errands a breeze. Whether you’re commuting for work or enjoying weekend outings, everything you need is within reach. Don’t miss this opportunit
Key facts
- 3,000 sq ft lot
- Garage
- Built 2025
Property features AI
Finance
- Other: Escrow amount listed
- HOA & community: No homeowners association
Exterior
- Parking: Detached garage or carport (no recorded garage/carport spaces)
- Security: Smoke detectors
- Utilities: Public water; City sewer; Electric service
- Home design: Single-story property; Not new construction; Living area based on blueprints
- Construction: Siding exterior; Shingle roof; Slab foundation; Approximately 1,000 building square feet
- Exterior features: Mature trees; Corner lot; Patio; Chain link and partial fencing; Paved road access; Curbs in the community
Interior
- Kitchen: Electric water heater; No conveying appliances
- Bedrooms: Master bedroom with walk-in closet
- Flooring: Tile flooring
- Bathrooms: 2 full bathrooms
- Heating & cooling: Central heating; Central air conditioning; Thermostat (energy efficient feature)
- Interior features: Quartz countertops; Ceiling fans; Decorative/high ceilings; No window coverings
- Laundry & utility: Laundry room with washer/dryer connection; Water heater located in laundry room
Neighborhood map
What this means for you Summary
Snapshot
- This is a 3-bed/2.0-bath single-family listed at $155k.
Deal economics
- At list price, monthly cash flow is $-94 ($-1k/yr) — negative.
- To cash-flow at today's rent, offer at most $141k (8.8% below list).
- To meet the 1% rule (rent ≥ 1% of price), the offer needs to be $124k (20.2% below list).
- Recommended offer: $124k (20.2% below list) — sets the bar for 1% rule.
- Cap rate 5.6% vs local median 4.1% in Weslaco — top-decile yield for the area; either an underpriced asset or a hidden risk that comps aren't pricing in. Stress-test before assuming the spread holds.
Location & tenants
- Location reads 72/100 on livability (#277 in TX) — a middle-class / working-renter tenant base. Strengths: cost of living A+, housing A+, health & safety A+; Watch: employment D+, crime F, amenities F.
- Weslaco ISD (suburban): math 23% / reading 31% proficiency, ranked #705 of 826 in TX (top 85%) — low school quality limits family demand, transient renter base, plan for 1-2y turnover.
- Zoned schools: Sam Houston El (math 22% / reading 37%, grade F, #2,525 of 4,322 statewide, top 62%, 745 students, 87% FRL); Armando Cuellar Middle (math 22% / reading 31%, grade F, #1,200 of 1,662 statewide, top 73%, 626 students, 88% FRL); Weslaco East H S (math 24% / reading 26%, grade F, #1,250 of 1,632 statewide, top 77%, 2,004 students, 86% FRL) — zoned schools average 87% FRL vs 59% district-wide (28 pts higher); higher-poverty schools than district average — tighter screening recommended.
- Market conditions: 712 active listings in the ZIP; 20 comparable units currently listed for rent nearby; rentals lingering (median 46d on market — plan ~5-8 weeks vacancy on turnover, expect pricing pressure); 100% of comp listings sitting > 30 days — soft ceiling on asking rent; 7,378 units permitted in Hidalgo County in 2024 (641 in 5+ unit buildings).
Forward outlook
- In year one you build about $166 of equity ($1k loan paydown + $-906 appreciation (-0.6% local appreciation)).
- Hidalgo County population projected at +28% by 2050 — long-run rental-demand tailwind backs the buy-and-hold thesis.
Negotiation context
- It's been on market 44 days — a 3% lower offer ($150k) is reasonable based on typical stale-listing flexibility.
- 3 sale attempts with the ask held roughly flat each time — persistent listings suggest the price (not the market) is what's stuck; bring a comps-based counter.
Risks & watch-outs
- Climate carrying-cost: severe wind risk, 99% chance of damaging wind over 30y; extreme-heat days projected 7→23/yr by 2055 (HVAC capex compounding) — expect insurance premiums to compound above CPI over the hold.
Questions for the listing agent
- What do current leases actually rent for vs. the listed asking? Can we see a recent rent roll and the last 12 months of T-12 income?
- It's been on market 44 days. Have you received any prior offers? Is the seller open to a 20% concession, seller financing, or rate buy-down credit?
- Is there a deadline driving the sale (1031 exchange, divorce, estate, relocation)? That informs how much negotiation room exists.
- Crime grade is F in this area — have there been break-ins, vandalism, or insurance claims at this property in the last 3 years? What carrier currently insures it and at what premium?
- The area grade is low — what's the realistic commute time and amenity access for the typical tenant pool here? Any planned neighborhood developments (good or bad) we should know about?
- What's the average days-on-market for RENTAL listings here right now (not sales)? A rising rental-DOM trend means longer vacancies and softer asking-rent achievability than the comps imply.
- What's the recent tenant-quality profile in this submarket — average credit score on applications, eviction rate, late-payment / NSF rate, and stable-employment percentage? A property-management company in the area should have these aggregated.
- How much new for-sale + rental construction is in the pipeline within 1–3 miles? Heavy new supply typically softens prices + rents 12–24 months out; constrained supply supports both.
Investment metrics
- 1% rule
- 0.80% ✗
- Cap rate
- 5.56%
- Cash-on-cash
- -2.61%
- DSCR
- 0.88
- GRM
- 10.4
CMA / ARV
- ARV (on-the-fly)
- $149,000
- Comps found
- 12
Show comp detail 12 sales within ~0.75 mi
| Address | Dist | Beds/Ba | Sqft | Sold | Price | $/sf | Match |
|---|---|---|---|---|---|---|---|
| 511 E Huisache St | 0.00mi | 3/2.0 | 1,000 (0%) | 2mo | $155,000 | $155 | 98 |
| 504 N Cantu St | 0.05mi | 2/1.0 (-1) | 987 (-1%) | 2mo | $49,000 | $50 | 85 |
| 710 N Illinois Ave | 0.19mi | 3/2.0 | 1,000 (0%) | 11mo | $159,000 | $159 | 82 |
| 814 N Martinez Ave | 0.19mi | 3/2.0 | 1,074 (+7%) | 8mo | $159,900 | $149 | 72 |
| 835 N Martinez Ave | 0.22mi | 3/2.0 | 1,074 (+7%) | 10mo | $160,000 | $149 | 69 |
| 725 E Los Torritos St | 0.20mi | 3/1.0 | 1,080 (+8%) | 6mo | $166,000 | $154 | 68 |
| 103 Grace Ave | 0.38mi | 2/1.0 (-1) | 1,068 (+7%) | 8mo | $60,000 | $56 | 55 |
| 603 Witmer St | 0.48mi | 3/1.0 | 1,094 (+9%) | 10mo | $109,000 | $100 | 50 |
| 1308 E 2nd St | 0.64mi | 3/2.0 | 1,088 (+9%) | 7mo | $145,000 | $133 | 49 |
| 409 Hidalgo St | 0.59mi | 2/2.0 (-1) | 900 (-10%) | 2mo | $157,000 | $174 | 49 |
| 601 W Huisache St | 0.51mi | 3/2.0 | 1,140 (+14%) | 13mo | $158,000 | $139 | 42 |
| 611 San Benito St | 0.75mi | 3/1.0 | 1,148 (+15%) | 3mo | $84,900 | $74 | 34 |
Match score weights: distance 35% · size 25% · config 20% · recency 20%. Top-matched comps best support the ARV.
Projected returns pro-forma
-0.58% appreciation · 3.0% rent growth · sell at horizon
- IRR
- -7.6%
- Equity multiple
- 0.66×
- Total profit
- $-14,725
- Equity at exit
- $40,532
- IRR
- -1.1%
- Equity multiple
- 0.89×
- Total profit
- $-4,771
- Equity at exit
- $45,280
Cash invested: $43,400 (down + closing). Projections, not guarantees.
Landlord ↔ Tenant lean methodology
- Overall (STATE)
- 87 Strongly Landlord-Friendly
- State Texas
- 87 Strongly Landlord-Friendly · R+5
- County
- — inherits STATE
- City
- — inherits STATE
ZIP-level market 78596
- Home prices YoY
- -0.2%
- Active inventory
- 712
- Price-to-rent
- 10.4×
Monthly cashflow live
- Estimated rent
- $1,237 high interval (Pro) →
- Mortgage (P&I)
- −$813
- Tax est. 1.5%
- −$194 /mo · $2,325/yr
- Insurance
- −$65
- HOA
- −$0
- Lot rent
- −$0
- Vacancy / Maint / Mgmt
- −$260
- Net cashflow
- $-94
Break-even live
Sensitivity live
| Price | -10% $13 | -5% $-41 | +0% $-94 | +5% $-148 | +10% $-201 |
|---|---|---|---|---|---|
| Rent | -10% $-192 | -5% $-143 | +0% $-94 | +5% $-45 | +10% $3 |
| Rate | -1.0pp $-16 | -0.5pp $-55 | base $-94 | +0.5pp $-134 | +1.0pp $-175 |
UW: 25.0% down · 7.5% · 30yr · 1.5% tax · 5.0% vac · 8.0% maint · 8.0% mgmt
Financing live
Cash to close
- Down payment
- $38,750
- Closing costs
- $4,650
- Reserves months
- —
- Total cash needed
- —
Loan-product check · same deal, 3 products live
Conventional
25% down · 7.5% · 30yr
- Down + closing
- —
- Monthly P&I
- —
- Monthly cashflow
- —
- DSCR
- —
- Eligible?
- —
Personal DTI + credit; lowest rate.
DSCR
20% down · 8.5% · 30yr
- Down + closing
- —
- Monthly P&I
- —
- Monthly cashflow
- —
- DSCR
- —
- Eligible?
- —
No personal income docs; deal must DSCR.
Hard money
10% down · 12.0% · 12mo
- Down + closing
- —
- Monthly P&I
- —
- Monthly cashflow
- —
- DSCR
- —
- Eligible?
- —
Short-term bridge; refi at stabilization.
Rent comps 20 comps
| Address | Beds | Baths | Sqft | Rent | $/sqft | DOM | Units | Dist |
|---|---|---|---|---|---|---|---|---|
| 309 E Mesquite St Weslaco, TX | 3.0 | 2.0 | 1100 | $1,400 | $1.27 | 46d | 1 | 0.15mi |
| 622 E Llano Grande St Weslaco, TX | 3.0 | 2.0 | 1100 | $1,500 | $1.36 | 46d | 1 | 0.24mi |
| 3707 Las Vistas Ln Apt 1 Weslaco, TX | 2.0 | 2.0 | 987 | $1,025 | $1.04 | 46d | 1 | 0.56mi |
| 3814 Bella Costa Dr Unit 3 Weslaco, TX | 2.0 | 2.0 | 987 | $1,025 | $1.04 | 46d | 1 | 0.56mi |
| 1601 S Airport Dr Unit 261 Weslaco, TX | 2.0 | 2.0 | 912 | $1,500 | $1.64 | 46d | 1 | 0.77mi |
| 1601 S Airport Dr Unit 283 Weslaco, TX | 3.0 | 2.0 | 1033 | $1,600 | $1.55 | 46d | 1 | 0.77mi |
| 1723 Davenport St Unit 2 Weslaco, TX | 3.0 | 2.0 | 1140 | $1,175 | $1.03 | 46d | 1 | 0.89mi |
| 1804 Davenport St Unit 4 Weslaco, TX | 2.0 | 2.0 | 938 | $1,125 | $1.20 | 46d | 1 | 0.92mi |
| 1805 Stauffers St Unit 3 Weslaco, TX | 3.0 | 2.0 | 1116 | $1,150 | $1.03 | 46d | 1 | 0.93mi |
| 1804 Stauffers St #3 Weslaco, TX | 2.0 | 2.0 | 840 | $1,000 | $1.19 | 46d | 1 | 0.96mi |
| 1722 E Davenport St Unit 4 Weslaco, TX | 2.0 | 2.0 | 938 | $1,100 | $1.17 | 46d | 1 | 0.96mi |
| 1909 Davenport St Unit 3 Weslaco, TX | 3.0 | 2.0 | 1140 | $1,175 | $1.03 | 46d | 1 | 0.97mi |
| 1817 Stauffer St Weslaco, TX | 3.0 | 2.0 | 1116 | $1,200 | $1.08 | 46d | 1 | 0.97mi |
| 1917 Davenport St Unit 1 Weslaco, TX | 2.0 | 2.0 | 938 | $1,100 | $1.17 | 46d | 1 | 0.99mi |
| 1812 Redbud Ln Unit 1 Weslaco, TX | 2.0 | 2.0 | 874 | $1,025 | $1.17 | 46d | 1 | 1.01mi |
| 2108 Redbud Ln Unit 4 Weslaco, TX | 2.0 | 2.0 | 920 | $1,050 | $1.14 | 46d | 1 | 1.10mi |
| 607 E Washington St Weslaco, TX | 3.0 | 2.0 | 1000 | $900 | $0.90 | 46d | 1 | 1.17mi |
| 617 E Washington St Unit 4 Weslaco, TX | 3.0 | 2.0 | 1000 | $900 | $0.90 | 46d | 1 | 1.17mi |
| 815 E Sugarcane Dr Unit E4 Weslaco, TX | 2.0 | 1.5 | 1124 | $1,200 | $1.07 | 46d | 1 | 1.24mi |
| 1306 E 11th St Unit 11 Weslaco, TX | 2.0 | 2.0 | 900 | $875 | $0.97 | 46d | 1 | 1.37mi |
Listing history 9 events
-
2026-05-04status Pending
-
2026-04-30historical Option
-
2026-03-20status Active
-
2026-01-13status Pending
-
2026-01-12historical Option
-
2026-01-12status Pending
-
2026-01-12historical Option
-
2026-01-09$155,000 Active
-
2025-11-18$157,000 Active
ⓘ Source: listings_history table (triggers on properties + properties_extension) + one-shot
backfill from property_details.listing_events for pre-trigger history.
Climate risk First Street
- Flood 1/10 Low FEMA zone X · 0% chance over 30 yrs
- Wildfire 1/10 Low
- Heat 9/10 Extreme 7 d/yr ≥111°F today · 23 d/yr by 30 yrs out
- Wind 8/10 Severe 99% chance of damaging wind over 30 yrs
- Air quality 1/10 Low 0 unhealthy d/yr today · 0 by 30 yrs out
Nearby sold comps map
Loading sold comps map…
Walkable amenities ~0.75 mi
Loading nearby amenities…
Taxation est. · year 1
- Rental income
- $14,839
- − Mortgage interest
- −$8,682
- − Property taxes
- −$2,325
- − Insurance
- −$775
- − Repairs & maintenance
- −$1,187
- − Management
- −$1,187
- − Depreciation
- −$4,509
- Taxable loss
- −$3,827
- Est. tax savings @ 24.0%
- +$918
- After-tax cash flow
- $-213/yr
For passive investors: Depreciation is non-cash, so a rental often shows a tax loss while cash-flowing — sheltering income. Rental losses are passive: they offset passive income freely, and up to $25,000/yr can offset ordinary (W-2) income if you actively participate and your MAGI is under $100k (phasing out to $0 by $150k); unused losses carry forward. On sale, claimed depreciation is recaptured at up to 25%, and gains may owe capital-gains tax (a 1031 exchange can defer both). Figures are a year-1 estimate at your 24.0% rate — not tax advice; consult a CPA.
Schools (NCES district)
- District
- Weslaco ISD
- NCES district ID
- 4844960
- Math proficiency
- 23% ▼ -29.00%
- Reading proficiency
- 31% ▼ -9.00%
- Median HH income
- $32,867
- Composite
- 22.05/100
- National rank
- #8196
- State rank
- #705 of 826 in TX
Livability — Weslaco
- Score
- 72/100
- State rank
- #277
- US rank
- #6469
Category grades
Schools grade is shown separately in the Schools card above.
Census & demographics
- Census place
- Weslaco, TX
- Population (ZIP)
- 38,942
Population outlook (Hidalgo County) Hauer SSP2
- Today (2025)
- 955,232 people
- By 2030
- 1,009,774 · +5.7%
- By 2040
- 1,120,332 · +17.3%
- By 2050
- 1,225,036 · +28.2%
- By 2075
- 1,439,189 · +50.7%
- By 2100
- 1,533,429 · +60.5%
Race, ethnicity, and origin ACS 2023
- Neighborhood character
- Predominantly Hispanic (86%)
- Race & ethnicity
- Hispanic / Latino 86% Two or more races 38% White 13%
- Hispanic origin (detail)
- Mexican 82%
- Common ancestry
- Slovak 1%
- Foreign-born
- 17% · Canada
- Languages at home
- 27% English-only · Spanish 72%
Political lean MEDSL · Hidalgo
- 2024 margin
- Toss-up / Even · D 48.1% · R 51.0%
- 2008→2024 swing
- -41.6pp toward R · 2008: 38.7pp · 2024: -2.9pp
- All cycles
- 2024: R+2.9 2020: D+17.1 2016: D+40.5 2012: D+41.8 2008: D+38.7
Not yet ingested
- Civics
- —
Market trends
- HPI YoY
- ▼ -0.58%
- Current HPI
- 261.5117
- Rent YoY
- —
- Metro
- —
- State GDP YoY
- ▲ 3.95%
- F500 in state
- 110
Industry mix (Fortune 500 HQ in TX)
| Industry | F500 HQs | Revenue |
|---|---|---|
| Energy | 16 | $1,198B |
|
||
| Technology | 5 | $198B |
|
||
| Engineering / Construction | 4 | $72B |
|
||
| Energy Services | 3 | $60B |
|
||
| Utilities | 3 | $41B |
|
||
| Healthcare | 2 | $330B |
|
||
Price history
-1.3% since first listed9 events — show timeline
- 2026-05-04 Pending — MCALLENMLS
- 2026-04-30 Contingent — MCALLENMLS
- 2026-03-20 Relisted — MCALLENMLS
- 2026-01-13 Pending — MCALLENMLS
- 2026-01-12 Contingent — MCALLENMLS
- 2026-01-12 Pending — MCALLENMLS
- 2026-01-12 Contingent — MCALLENMLS
- 2026-01-09 Listed $155,000 MCALLENMLS
- 2025-11-18 Listed $157,000 MCALLENMLS
Cash-flow waterfall
monthlySold comps — $/sqft
last 12 mo · ≤1 miLoading sold comps…