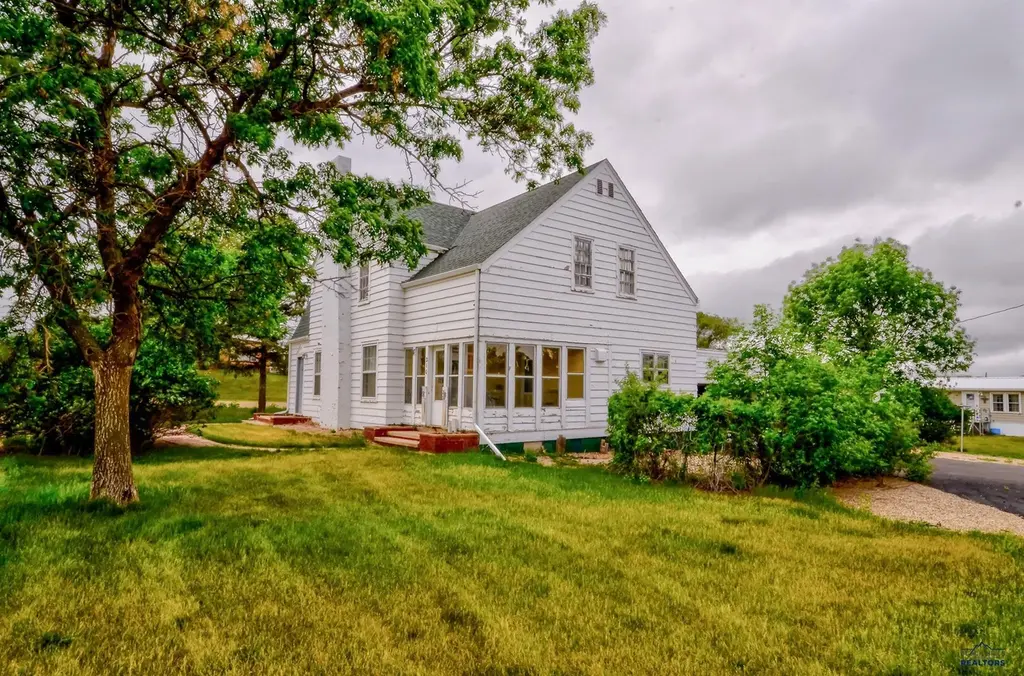
210 W 2nd St · Presho, SD
Flood risk 1/10 · Minimal
- FEMA flood zone
- —
- Chance of flooding over 30 yrs
- 0.0%
- Est. flood insurance / yr
- —
Fire risk 5/10 · Moderate
- Est. fire insurance / yr
- $1,342 – $2,492
Heat risk 3/10 · Minor
- Hot days now (above 102°F)
- 7 days/yr
- Hot days in 30 yrs
- 14 days/yr
Wind risk 2/10 · Minimal
- Chance of severe wind over 30 yrs
- —
Air-quality risk 2/10 · Minimal
- Unhealthy air days now
- 1 days/yr
- Unhealthy air days in 30 yrs
- 1 days/yr
Risk factors via First Street. Map © Google.
Why this score? — see what drove the B grade
The composite is a weighted blend of 9 inputs, each scored 0–100. Each bar is that input's sub-score; the figure is the points it added to the 100-point composite (weight × sub-score).
- Cash flow +30.0/30.0
- DSCR +10.0/10.0
- 1% rule +9.6/10.0
- ARV discount +7.5/15.0
- Appreciation +5.0/10.0
- Schools +4.2/10.0
- Livability +3.5/5.0
- Rent growth +2.5/5.0
- Condition / age +2.2/5.0
$85,000
🖨 Deal sheet 📄 Offer letter ✓ Due diligence
Key facts
- 8,712 sq ft lot
- 2 garage spots
- Built 1910
Property features AI
Finance
- HOA & community: No association amenities
Exterior
- Parking: Attached garage with 2 spaces
- Utilities: Electric service with circuit breakers and 220 volts
- Home design: Single-family residence; 2 stories
- Construction: Frame construction; Composition roof; Basement
- Exterior features: Corner lot; Level lot; Has a view; No fencing
Interior
- Kitchen: Electric oven; Oven; Refrigerator; Dishwasher not listed
- Flooring: Carpet
- Bathrooms: 1 full bathroom; 1 half bathroom
- Heating & cooling: Forced air heating (propane); Central air conditioning
- Interior features: Fireplace (1)
- Laundry & utility: Washer; Dryer
Neighborhood map
What this means for you Summary
Snapshot
- This is a 4-bed/1.5-bath single-family listed at $85k. Condition is rated fair.
Deal economics
- At list price, monthly cash flow is $396 ($5k/yr) — positive.
- The deal already cash-flows at list — no discount required.
- Meets the 1% rule at list price ($1k rent vs $85k).
- Recommended offer: $84k (1.5% below list) — sets the bar for market timing.
Location & tenants
- Location reads 69/100 on livability (#77 in SD) — a middle-class / working-renter tenant base. Strengths: cost of living A+, housing A+, employment A-; Watch: health & safety C-, crime D+, amenities F.
- Lyman School District 42-1 (rural): math 40% / reading 55% proficiency, ranked #92 of 148 in SD (top 62%) — families likely to look elsewhere, expect single-tenant / working-renter base with shorter leases.
- Market conditions: 6 active listings in the ZIP; 2 units permitted in Lyman County in 2024 (0 in 5+ unit buildings).
Forward outlook
- In year one you build about $3k of equity ($588 loan paydown + $3k appreciation (3.0% local appreciation)).
- At projected returns (3.0% appreciation + 3.0% rent growth), your $24k cash investment doubles in ~3 years — after that, you're playing with house money.
- By year 10, paydown + projected appreciation supports a ~$30k cash-out refi (75% LTV) — recoverable capital for the next deal without selling this one.
Negotiation context
- It's been on market 16 days — a 2% lower offer ($84k) is reasonable based on typical stale-listing flexibility.
Risks & watch-outs
- Watch-outs: built in 1910 — expect roof / HVAC / electrical / plumbing capex.
- Climate carrying-cost: moderate wildfire risk — expect insurance premiums to compound above CPI over the hold.
Questions for the listing agent
- Have any recent inspections been done? Can we get a copy of the seller's disclosures and any deferred-maintenance estimates?
- Built in 1910 — when were the roof, HVAC, electrical panel, plumbing, and water heater last replaced?
- Is there a deadline driving the sale (1031 exchange, divorce, estate, relocation)? That informs how much negotiation room exists.
- Schools are B-rated — typically a magnet for longer-tenancy family renters. What's the average tenant stay here, and is there a school-zone premium baked into asking?
- Crime grade is D in this area — have there been break-ins, vandalism, or insurance claims at this property in the last 3 years? What carrier currently insures it and at what premium?
- What's the average days-on-market for RENTAL listings here right now (not sales)? A rising rental-DOM trend means longer vacancies and softer asking-rent achievability than the comps imply.
- What's the recent tenant-quality profile in this submarket — average credit score on applications, eviction rate, late-payment / NSF rate, and stable-employment percentage? A property-management company in the area should have these aggregated.
- How much new for-sale + rental construction is in the pipeline within 1–3 miles? Heavy new supply typically softens prices + rents 12–24 months out; constrained supply supports both.
Investment metrics
- 1% rule
- 1.46% ✓
- Cap rate
- 11.89%
- Cash-on-cash
- 19.97%
- DSCR
- 1.89
- GRM
- 5.7
CMA / ARV
No comps found within radius.
Projected returns pro-forma
3.0% appreciation · 3.0% rent growth · sell at horizon
- IRR
- 26.3%
- Equity multiple
- 2.49×
- Total profit
- $35,488
- Equity at exit
- $38,220
- IRR
- 27.0%
- Equity multiple
- 4.82×
- Total profit
- $91,014
- Equity at exit
- $58,901
Cash invested: $23,800 (down + closing). Projections, not guarantees.
Landlord ↔ Tenant lean methodology
- Overall (STATE)
- 83 Strongly Landlord-Friendly
- State South Dakota
- 83 Strongly Landlord-Friendly · R+16
- County
- — inherits STATE
- City
- — inherits STATE
ZIP-level market 57568
- Active inventory
- 6
- Price-to-rent
- 5.7×
Monthly cashflow live
- Estimated rent
- $1,245 medium interval (Pro) →
- Mortgage (P&I)
- −$446
- Tax est. 1.5%
- −$106 /mo · $1,275/yr
- Insurance
- −$35
- HOA
- −$0
- Vacancy / Maint / Mgmt
- −$261
- Net cashflow
- $396
Break-even live
UW: 25.0% down · 7.5% · 30yr · 1.5% tax · 5.0% vac · 8.0% maint · 8.0% mgmt
Financing live
Cash to close
- Down payment
- $21,250
- Closing costs
- $2,550
- Reserves months
- —
- Total cash needed
- —
Loan-product check · same deal, 3 products live
Conventional
25% down · 7.5% · 30yr
- Down + closing
- —
- Monthly P&I
- —
- Monthly cashflow
- —
- DSCR
- —
- Eligible?
- —
Personal DTI + credit; lowest rate.
DSCR
20% down · 8.5% · 30yr
- Down + closing
- —
- Monthly P&I
- —
- Monthly cashflow
- —
- DSCR
- —
- Eligible?
- —
No personal income docs; deal must DSCR.
Hard money
10% down · 12.0% · 12mo
- Down + closing
- —
- Monthly P&I
- —
- Monthly cashflow
- —
- DSCR
- —
- Eligible?
- —
Short-term bridge; refi at stabilization.
Listing history 11 events
-
2026-06-18days on market $85,000 Active 16 DOM
-
2026-06-17days on market $85,000 Active 15 DOM
-
2026-06-16days on market $85,000 Active 14 DOM
-
2026-06-15days on market $85,000 Active 13 DOM
-
2026-06-13days on market $85,000 Active 11 DOM
-
2026-06-12days on market $85,000 Active 10 DOM
-
2026-06-09days on market $85,000 Active 7 DOM
-
2026-06-08days on market $85,000 Active 6 DOM
-
2026-06-08days on market $85,000 Active 5 DOM
-
2026-06-05days on market $85,000 Active 3 DOM
-
2026-06-03$85,000 Active 1 DOM
ⓘ Source: listings_history table (triggers on properties + properties_extension) + one-shot
backfill from property_details.listing_events for pre-trigger history.
Climate risk First Street
- Flood 1/10 Low 0% chance over 30 yrs
- Wildfire 5/10 Major
- Heat 3/10 Moderate 7 d/yr ≥102°F today · 14 d/yr by 30 yrs out
- Wind 2/10 Low
- Air quality 2/10 Low 1 unhealthy d/yr today · 1 by 30 yrs out
Nearby sold comps map
Loading sold comps map…
Walkable amenities ~0.75 mi
Loading nearby amenities…
Taxation est. · year 1
- Rental income
- $14,940
- − Mortgage interest
- −$4,761
- − Property taxes
- −$1,275
- − Insurance
- −$425
- − Repairs & maintenance
- −$1,195
- − Management
- −$1,195
- − Depreciation
- −$2,473
- Taxable income
- $3,615
- Est. tax owed @ 24.0%
- −$868
- After-tax cash flow
- $3,886/yr
For passive investors: Depreciation is non-cash, so a rental often shows a tax loss while cash-flowing — sheltering income. Rental losses are passive: they offset passive income freely, and up to $25,000/yr can offset ordinary (W-2) income if you actively participate and your MAGI is under $100k (phasing out to $0 by $150k); unused losses carry forward. On sale, claimed depreciation is recaptured at up to 25%, and gains may owe capital-gains tax (a 1031 exchange can defer both). Figures are a year-1 estimate at your 24.0% rate — not tax advice; consult a CPA.
Condition & rehab AI · 13 photos
This property requires significant repairs and updates to improve its condition and value. The roof, exterior siding, and interior walls are in poor condition and need major repairs. Upgrading the kitchen cabinets, replacing the carpet, and updating the bathrooms can significantly increase its value.
Repairs flagged
- Major roof — Significant wear and tear
- Major exterior siding — Weathered and peeling
- Major interior walls — Worn paint and wallpaper
- Major kitchen cabinets — Outdated and worn
- Major bathroom fixtures — Small and outdated
- Major flooring — Worn carpet throughout
- Major HVAC units — Older units with visible wear
Value-add opportunities
- Both Paint interior walls — Fresh paint can improve the overall appearance and value
- Both Replace carpet — New carpet can improve comfort and value
- Both Upgrade kitchen cabinets — Modern cabinets can increase both resale and rental value
- Both Replace bathroom fixtures — New fixtures can improve functionality and value
- Both Landscaping and lawn maintenance — A well-maintained yard can improve curb appeal and value
Renovation cost estimate screening
| Repair item | Severity | Est. cost |
|---|---|---|
| roof · Significant wear and tear | Major | $15,000–50,000 |
| exterior siding · Weathered and peeling | Major | $15,000–50,000 |
| interior walls · Worn paint and wallpaper | Major | $15,000–50,000 |
| kitchen cabinets · Outdated and worn | Major | $15,000–50,000 |
| bathroom fixtures · Small and outdated | Major | $15,000–50,000 |
| flooring · Worn carpet throughout | Major | $15,000–50,000 |
| HVAC units · Older units with visible wear | Major | $15,000–50,000 |
| Total estimated repair cost · 7 items | $105,000–350,000 |
Value-add ROI direction
- Both Paint interior walls — Fresh paint can improve the overall appearance and value ↑
- Both Replace carpet — New carpet can improve comfort and value ↑
- Both Upgrade kitchen cabinets — Modern cabinets can increase both resale and rental value ↑
- Both Replace bathroom fixtures — New fixtures can improve functionality and value ↑
- Both Landscaping and lawn maintenance — A well-maintained yard can improve curb appeal and value ↑
ⓘ Cost ranges are severity-bucket heuristics (US national rule-of-thumb). Get contractor quotes + a written scope before underwriting a rehab budget.
Schools (NCES district)
- District
- Lyman School District 42-1
- NCES district ID
- 4644770
- Math proficiency
- 40% ▼ -5.00%
- Reading proficiency
- 55% ▲ 5.00%
- Median HH income
- $42,975
- Composite
- 42.13/100
- National rank
- #7034
- State rank
- #92 of 148 in SD
Livability — Presho
- Score
- 69/100
- State rank
- #77
- US rank
- #8850
Category grades
Schools grade is shown separately in the Schools card above.
Census & demographics
- Census place
- Presho, SD
- Population (ZIP)
- 682
Population outlook (Lyman County) Hauer SSP2
- Today (2025)
- 3,955 people
- By 2030
- 3,978 · +0.6%
- By 2040
- 4,009 · +1.4%
- By 2050
- 4,001 · +1.2%
- By 2075
- 4,248 · +7.4%
- By 2100
- 4,678 · +18.3%
Race, ethnicity, and origin ACS 2023
- Neighborhood character
- Predominantly White (99%)
- Race & ethnicity
- White 99% Two or more races 1%
- Common ancestry
- Portuguese 15% Serbian 4% Slovak 1%
- Languages at home
- 94% English-only · Spanish 6%
Political lean MEDSL · Lyman
- 2024 margin
- Solid R (+39.5) · D 29.2% · R 68.6% · Other 2.2%
- 2008→2024 swing
- -28.2pp toward R · 2008: -11.2pp · 2024: -39.5pp
- All cycles
- 2024: R+39.5 2020: R+32.4 2016: R+42.8 2012: R+20.9 2008: R+11.2
Not yet ingested
- Civics
- —
Market trends
- HPI YoY
- —
- Current HPI
- —
- Rent YoY
- —
- Metro
- —
- State GDP YoY
- ▲ 0.70%
- F500 in state
- 2
Industry mix (Fortune 500 HQ in SD)
| Industry | F500 HQs | Revenue |
|---|---|---|
| Utilities | 1 | $1B |
|
||
Price history
1 event — show timeline
- 2026-06-02 Listed $85,000 BHMLS
Cash-flow waterfall
monthlySold comps — $/sqft
last 12 mo · ≤1 miLoading sold comps…