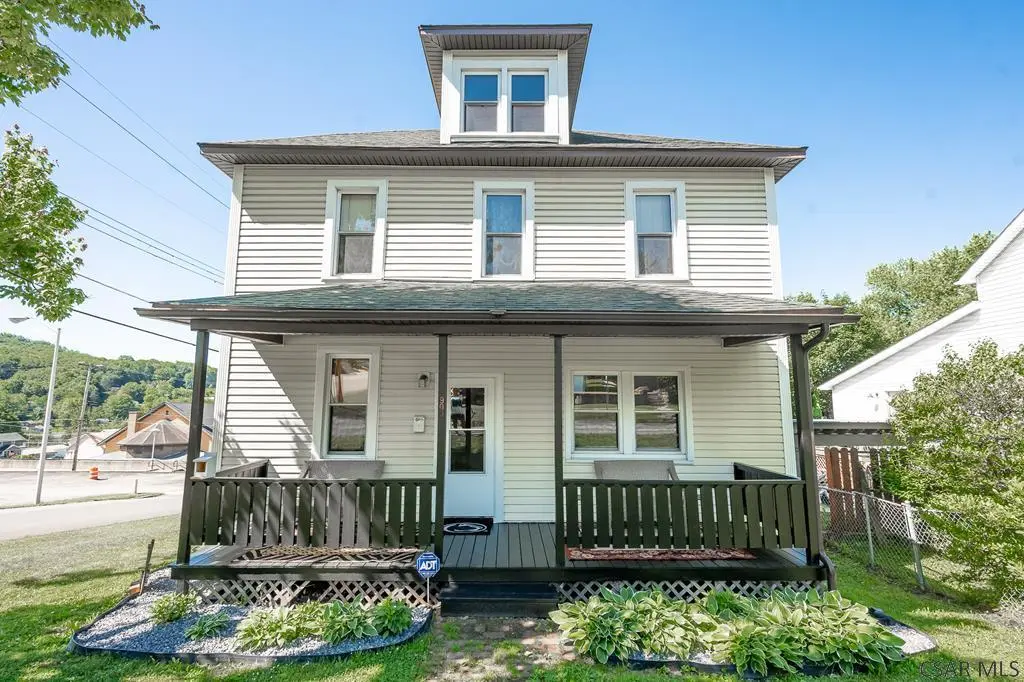
900 Elder Ave · Northern Cambria, PA
Flood risk 1/10 · Minimal
- FEMA flood zone
- X (unshaded)
- Chance of flooding over 30 yrs
- 0.0%
- Est. flood insurance / yr
- $473 – $860
Fire risk 2/10 · Minimal
- Est. fire insurance / yr
- $511 – $949
Heat risk 3/10 · Minor
- Hot days now (above 92°F)
- 7 days/yr
- Hot days in 30 yrs
- 19 days/yr
Wind risk 2/10 · Minimal
- Chance of severe wind over 30 yrs
- —
Air-quality risk 3/10 · Minor
- Unhealthy air days now
- 2 days/yr
- Unhealthy air days in 30 yrs
- 4 days/yr
Risk factors via First Street. Map © Google.
Why this score? — see what drove the B- grade
The composite is a weighted blend of 9 inputs, each scored 0–100. Each bar is that input's sub-score; the figure is the points it added to the 100-point composite (weight × sub-score).
- Cash flow +30.0/30.0
- DSCR +10.0/10.0
- 1% rule +8.3/10.0
- Appreciation +7.1/10.0
- Schools +3.4/10.0
- Livability +3.4/5.0
- Rent growth +2.5/5.0
- Condition / age +2.5/5.0
- ARV discount +0.8/15.0
$79,900
🖨 Deal sheet 📄 Offer letter ✓ Due diligence
Listing remarks MLS
Charming 2-story home on a corner lot in Northern Cambria featuring 3 bedrooms and 1 full bath. Move-in ready and sewer compliant. This home offers a remodeled hickory kitchen, brand new bathroom, new flooring throughout the main living areas, fresh paint, and updated lighting. Recent improvements, including a newer furnace, exterior doors, and landscaping, enhance both comfort and curb appeal. The inviting front porch provides a great place to relax, while the storage shed offers additional space for tools, equipment, or seasonal items. With its many updates and well-maintained condition, this home is an excellent opportunity for buyers seeking modern conveniences and small-town charm.
Key facts
- New bathroom
- Fresh paint
- New flooring
Tags
Property features AI
Exterior
- Parking: On-street parking; Total of 2 parking spaces
- Utilities: Public water; Public sewer
- Home design: Two-story home; Resale property
- Construction: Vinyl siding; Asphalt roof
- Exterior features: Walk-out basement access; Lot dimensions approximately 50 x 80
Interior
- Kitchen: Kitchen on main level (approximately 13x16); Dishwasher; Microwave; Refrigerator; Stove
- Bedrooms: Three bedrooms (two on upper level; includes one 10x13, one 8x15, and one 14x15)
- Flooring: Laminate; Window treatments noted as interior feature
- Bathrooms: One full bathroom
- Heating & cooling: Forced air heating; Oil heating
- Interior features: Window treatments
- Laundry & utility: Washer; Dryer; Some electric appliances
Neighborhood map
What this means for you Summary
Snapshot
- This is a 3-bed/1.0-bath single-family listed at $80k.
Deal economics
- At list price, monthly cash flow is $306 ($4k/yr) — positive.
- The deal already cash-flows at list — no discount required.
- Meets the 1% rule at list price ($1k rent vs $80k).
Location & tenants
- Location reads 67/100 on livability (#991 in PA) — a middle-class / working-renter tenant base. Strengths: cost of living A+, housing A+, crime A; Watch: amenities F, commute F, employment D-.
- Northern Cambria SD (town): math 32% / reading 48% proficiency, ranked #358 of 539 in PA (top 66%) — families likely to look elsewhere, expect single-tenant / working-renter base with shorter leases.
- Market conditions: 16 active listings in the ZIP; 64 units permitted in Cambria County in 2024 (0 in 5+ unit buildings).
Forward outlook
- In year one you build about $4k of equity ($552 loan paydown + $3k appreciation (4.2% local appreciation)).
- Cambria County population projected at -28% by 2050 — secular population decline; favor cash flow + early exit over multi-decade hold.
- At projected returns (4.2% appreciation + 3.0% rent growth), your $22k cash investment doubles in ~3 years — after that, you're playing with house money.
- By year 9, paydown + projected appreciation supports a ~$33k cash-out refi (75% LTV) — recoverable capital for the next deal without selling this one.
Negotiation context
- Only 2 days on market — expect competitive offers; lowballing is unlikely to land.
- 2 sale attempts with the ask held roughly flat each time — persistent listings suggest the price (not the market) is what's stuck; bring a comps-based counter.
- Current owner paid $13k; list at $80k implies a 515% gain — meaningful room to come down on a strong offer.
Questions for the listing agent
- Is there a deadline driving the sale (1031 exchange, divorce, estate, relocation)? That informs how much negotiation room exists.
- Schools are B-rated — typically a magnet for longer-tenancy family renters. What's the average tenant stay here, and is there a school-zone premium baked into asking?
- What's the average days-on-market for RENTAL listings here right now (not sales)? A rising rental-DOM trend means longer vacancies and softer asking-rent achievability than the comps imply.
- What's the recent tenant-quality profile in this submarket — average credit score on applications, eviction rate, late-payment / NSF rate, and stable-employment percentage? A property-management company in the area should have these aggregated.
- How much new for-sale + rental construction is in the pipeline within 1–3 miles? Heavy new supply typically softens prices + rents 12–24 months out; constrained supply supports both.
Investment metrics
- 1% rule
- 1.33% ✓
- Cap rate
- 10.89%
- Cash-on-cash
- 16.41%
- DSCR
- 1.73
- GRM
- 6.3
CMA / ARV
- ARV (on-the-fly)
- $69,564
- Comps found
- 6
Show comp detail 6 sales within ~0.75 mi
| Address | Dist | Beds/Ba | Sqft | Sold | Price | $/sf | Match |
|---|---|---|---|---|---|---|---|
| 533 Philadelphia Ave | 0.22mi | 4/1.0 (+1) | 1,080 (+2%) | 20mo | $114,900 | $106 | 64 |
| 165 Ash St | 0.65mi | 3/1.0 | 1,024 (-3%) | 5mo | $68,000 | $66 | 61 |
| 810 39th St | 0.34mi | 3/1.0 | 1,098 (+4%) | 19mo | $25,000 | $23 | 61 |
| 1786 Empire Ave | 0.67mi | 4/1.0 (+1) | 1,090 (+3%) | 2mo | $69,900 | $64 | 56 |
| 183 James St | 0.64mi | 3/2.0 | 1,040 (-1%) | 17mo | $89,900 | $86 | 50 |
| 414 Juniper St | 0.56mi | 2/1.0 (-1) | 1,192 (+13%) | 18mo | $15,000 | $13 | 32 |
Match score weights: distance 35% · size 25% · config 20% · recency 20%. Top-matched comps best support the ARV.
Projected returns pro-forma
4.17% appreciation · 3.0% rent growth · sell at horizon
- IRR
- 25.4%
- Equity multiple
- 2.53×
- Total profit
- $34,184
- Equity at exit
- $41,321
- IRR
- 25.1%
- Equity multiple
- 4.95×
- Total profit
- $88,456
- Equity at exit
- $68,240
Cash invested: $22,372 (down + closing). Projections, not guarantees.
Landlord ↔ Tenant lean methodology
- Overall (STATE)
- 62 Landlord-Friendly
- State Pennsylvania
- 62 Landlord-Friendly · EVEN
- County
- — inherits STATE
- City
- — inherits STATE
ZIP-level market 15714
- Home prices YoY
- 5.0%
- Active inventory
- 16
- Price-to-rent
- 6.3×
Monthly cashflow live
- Estimated rent
- $1,064 medium interval (Pro) →
- Mortgage (P&I)
- −$419
- Tax from tax record
- −$82 /mo · $989/yr
- Insurance
- −$33
- HOA
- −$0
- Vacancy / Maint / Mgmt
- −$223
- Net cashflow
- $306
Break-even live
UW: 25.0% down · 7.5% · 30yr · 1.5% tax · 5.0% vac · 8.0% maint · 8.0% mgmt
Financing live
Cash to close
- Down payment
- $19,975
- Closing costs
- $2,397
- Reserves months
- —
- Total cash needed
- —
Loan-product check · same deal, 3 products live
Conventional
25% down · 7.5% · 30yr
- Down + closing
- —
- Monthly P&I
- —
- Monthly cashflow
- —
- DSCR
- —
- Eligible?
- —
Personal DTI + credit; lowest rate.
DSCR
20% down · 8.5% · 30yr
- Down + closing
- —
- Monthly P&I
- —
- Monthly cashflow
- —
- DSCR
- —
- Eligible?
- —
No personal income docs; deal must DSCR.
Hard money
10% down · 12.0% · 12mo
- Down + closing
- —
- Monthly P&I
- —
- Monthly cashflow
- —
- DSCR
- —
- Eligible?
- —
Short-term bridge; refi at stabilization.
Listing history 3 events
-
2026-06-18days on market $79,900 Active 2 DOM
-
2026-06-17remarks 695-char remark
-
2026-06-17$79,900 Active 1 DOM
ⓘ Source: listings_history table (triggers on properties + properties_extension) + one-shot
backfill from property_details.listing_events for pre-trigger history.
Tax reassessment forecast PA · Partial reset (capped growth)
- Current annual tax
- $989 · $82/mo
- Projected year-2 tax
- $1,126 · $94/mo
- Expected delta
- +$137/yr (+$11/mo · 13.8%)
ⓘ Screening estimate from a state-policy table — verify with the county assessor before closing.
Climate risk First Street
- Flood 1/10 Low FEMA zone X (unshaded) · 0% chance over 30 yrs
- Wildfire 2/10 Low
- Heat 3/10 Moderate 7 d/yr ≥92°F today · 19 d/yr by 30 yrs out
- Wind 2/10 Low
- Air quality 3/10 Moderate 2 unhealthy d/yr today · 4 by 30 yrs out
Nearby sold comps map
Loading sold comps map…
Walkable amenities ~0.75 mi
Loading nearby amenities…
Taxation est. · year 1
- Rental income
- $12,768
- − Mortgage interest
- −$4,476
- − Property taxes
- −$989
- − Insurance
- −$400
- − Repairs & maintenance
- −$1,021
- − Management
- −$1,021
- − Depreciation
- −$2,324
- Taxable income
- $2,537
- Est. tax owed @ 24.0%
- −$609
- After-tax cash flow
- $3,062/yr
For passive investors: Depreciation is non-cash, so a rental often shows a tax loss while cash-flowing — sheltering income. Rental losses are passive: they offset passive income freely, and up to $25,000/yr can offset ordinary (W-2) income if you actively participate and your MAGI is under $100k (phasing out to $0 by $150k); unused losses carry forward. On sale, claimed depreciation is recaptured at up to 25%, and gains may owe capital-gains tax (a 1031 exchange can defer both). Figures are a year-1 estimate at your 24.0% rate — not tax advice; consult a CPA.
Schools (NCES district)
- District
- Northern Cambria SD
- NCES district ID
- 4217610
- Math proficiency
- 32% ▼ -6.00%
- Reading proficiency
- 48% ▼ -11.00%
- Median HH income
- $44,142
- Composite
- 33.87/100
- National rank
- #5350
- State rank
- #358 of 539 in PA
Livability — Northern Cambria
- Score
- 67/100
- State rank
- #991
- US rank
- #10925
Category grades
Schools grade is shown separately in the Schools card above.
Census & demographics
- Census place
- Northern Cambria, PA
- Population (ZIP)
- 5,215
Population outlook (Cambria County) Hauer SSP2
- Today (2025)
- 122,754 people
- By 2030
- 115,827 · -5.6%
- By 2040
- 101,309 · -17.5%
- By 2050
- 88,379 · -28.0%
- By 2075
- 65,237 · -46.9%
- By 2100
- 46,909 · -61.8%
Race, ethnicity, and origin ACS 2023
- Neighborhood character
- Predominantly White (97%)
- Race & ethnicity
- White 97% Two or more races 2%
- Common ancestry
- Romanian 9% Polish 3% Serbian 2%
- Foreign-born
- 0%
- Languages at home
- 95% English-only · German/W. Germanic 3% French/Haitian/Cajun 1%
Political lean MEDSL · Cambria
- 2024 margin
- Solid R (+39.7) · D 29.8% · R 69.5%
- 2008→2024 swing
- -40.4pp toward R · 2008: 0.7pp · 2024: -39.7pp
- All cycles
- 2024: R+39.7 2020: R+37.3 2016: R+37.8 2012: R+17.8 2008: D+0.7
Not yet ingested
- Civics
- —
Market trends
- HPI YoY
- ▲ 4.17%
- Current HPI
- 88.2969
- Rent YoY
- —
- Metro
- —
- State GDP YoY
- ▲ 1.68%
- F500 in state
- 34
Industry mix (Fortune 500 HQ in PA)
| Industry | F500 HQs | Revenue |
|---|---|---|
| Healthcare | 2 | $309B |
|
||
| Insurance | 2 | $27B |
|
||
| Telecommunications / Media | 1 | $124B |
|
||
| Industrial Distribution | 1 | $22B |
|
||
| Financial Services | 1 | $20B |
|
||
| Chemicals / Materials | 1 | $18B |
|
||
Price history
+514.6% since first listed3 events — show timeline
- 2026-06-16 Listed $79,900 CSMLS
- 2026-06-15 Listed $79,900 West Penn MLS
- 2014-10-09 Sold (Public Records) $13,000 Public Records
Property tax history
+1.6%/yrLatest (2026): $989 · +0.0% YoY. Source: county tax records.
Cash-flow waterfall
monthlySold comps — $/sqft
last 12 mo · ≤1 miLoading sold comps…