14401 Commodores Dr #101 · Corpus Christi, TX
Flood risk No data
- FEMA flood zone
- —
- Chance of flooding over 30 yrs
- —
- Est. flood insurance / yr
- —
Fire risk No data
- Est. fire insurance / yr
- —
Heat risk No data
- Hot days now (above threshold)
- —
- Hot days in 30 yrs
- —
Wind risk No data
- Chance of severe wind over 30 yrs
- —
Air-quality risk No data
- Unhealthy air days now
- —
- Unhealthy air days in 30 yrs
- —
Risk factors via First Street. Map © Google.
Why this score? — see what drove the D- grade
The composite is a weighted blend of 9 inputs, each scored 0–100. Each bar is that input's sub-score; the figure is the points it added to the 100-point composite (weight × sub-score).
- ARV discount +15.0/15.0
- Cash flow +6.9/30.0
- Schools +4.1/10.0
- Livability +3.9/5.0
- 1% rule +3.8/10.0
- Condition / age +2.5/5.0
- Rent growth +2.4/5.0
- DSCR +1.1/10.0
- Appreciation +0.0/10.0
$179,000
🖨 Deal sheet 📄 Offer letter ✓ Due diligence
Listing remarks MLS
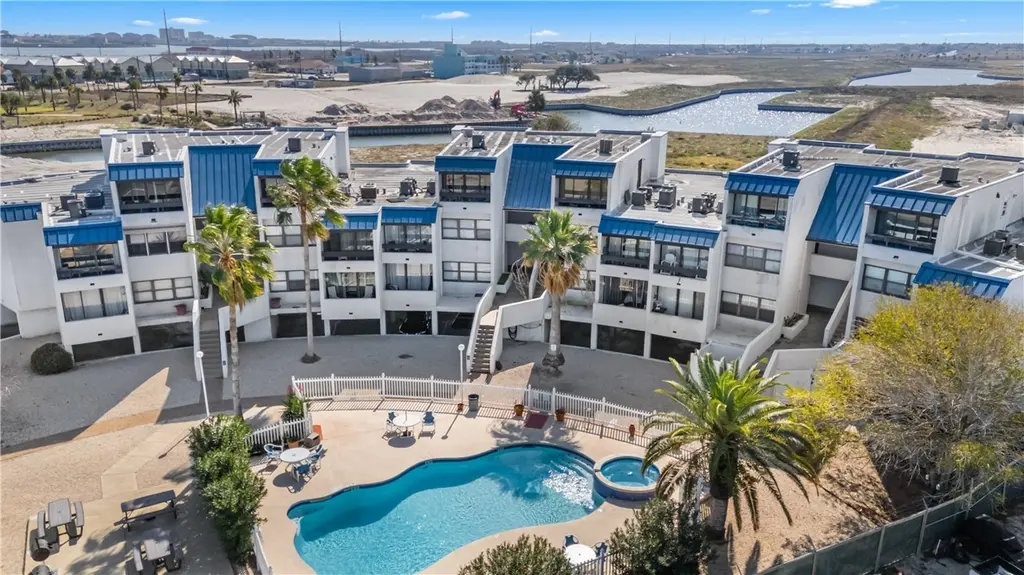
Welcome to Fairway Villas, where coastal living meets effortless ownership. This 1-bedroom, 1-bath condo is perfectly positioned to enjoy the very best of Padre Island living, offering a crisp blue resort-style pool, a canal behind the complex, and close proximity to the beach, dining, shopping, and outdoor recreation the island is known for. Inside, the condo is filled with natural light thanks to floor-to-ceiling windows/sliding glass patio doors installed in 2025, enhancing both energy efficiency and seamless indoor-outdoor living. The unit also includes one assigned parking space, adding convenience and ease for full-time residents or guests. Fairway Villas offers additional amenities including a grilling area and picnic space, perfect for relaxing after a day at the beach or entertaining friends. Designed for low-maintenance living, this condo is ideal as an income-producing investment, weekend getaway, or full-time island retreat. Located in a rapidly growing area of Padre Island with new construction nearby, this property offers both immediate enjoyment and long-term upside. Whether you’re seeking rental income or a laid-back coastal lifestyle, this is your opportunity to live—or invest in—the island life.
Key facts
- Picnic space
- Resort style pool
- Canal behind complex
Tags
Neighborhood map
What this means for you Summary
Snapshot
- This is a 1-bed/1.0-bath townhouse listed at $179k.
Deal economics
- At list price, monthly cash flow is $-273 ($-3k/yr) — negative.
- To cash-flow at today's rent, offer at most $131k (27.0% below list).
- To meet the 1% rule (rent ≥ 1% of price), the offer needs to be $157k (12.1% below list).
- Recommended offer: $131k (27.0% below list) — sets the bar for cash-flow.
- Cap rate 4.5% vs local median 3.6% in Corpus Christi — meaningfully above typical; check what's discounted (condition, days-on-market, listing class) to confirm the premium yield is real.
Location & tenants
- Location reads 78/100 on livability (#66 in TX, #2,404 nationally) — a middle-class / working-renter tenant base. Strengths: commute A+, cost of living A+, housing A+; Watch: crime F.
- Flour Bluff ISD (urban): math 43% / reading 51% proficiency, ranked #209 of 826 in TX (top 25%) — families likely to look elsewhere, expect single-tenant / working-renter base with shorter leases.
- Market conditions: Rents soft (-0.6%/yr); 685 active listings in the ZIP; 3 comparable units currently listed for rent nearby; rentals at typical pace (median 21d on market — plan ~3-4 weeks tenant-placement turnaround); solid renter incomes; 1,397 units permitted in Nueces County in 2024 (47 in 5+ unit buildings).
Forward outlook
- Local home prices are declining (-3.0%/yr); year-one equity from $1k of loan paydown is wiped out by about $5k of value loss. Plan a longer hold.
- Nueces County population projected at +36% by 2050 — long-run rental-demand tailwind backs the buy-and-hold thesis.
Negotiation context
- It's been on market 135 days — a 12% lower offer ($158k) is reasonable based on typical stale-listing flexibility.
- 8 sale attempts since 6y ago with the ask held roughly flat each time — persistent listings suggest the price (not the market) is what's stuck; bring a comps-based counter.
Questions for the listing agent
- What do current leases actually rent for vs. the listed asking? Can we see a recent rent roll and the last 12 months of T-12 income?
- It's been on market 135 days. Have you received any prior offers? Is the seller open to a 27% concession, seller financing, or rate buy-down credit?
- Built in 1978 — when were the roof, HVAC, electrical panel, plumbing, and water heater last replaced?
- What does the HOA fee cover, when was the last increase, and are there any pending special assessments or reserve-fund shortfalls?
- Why hasn't it sold? Are there any deal-killer items the seller is aware of (foundation, flood, title, zoning, code violations)?
- Is there a deadline driving the sale (1031 exchange, divorce, estate, relocation)? That informs how much negotiation room exists.
- Crime grade is F in this area — have there been break-ins, vandalism, or insurance claims at this property in the last 3 years? What carrier currently insures it and at what premium?
- The area grade is low — what's the realistic commute time and amenity access for the typical tenant pool here? Any planned neighborhood developments (good or bad) we should know about?
- What's the average days-on-market for RENTAL listings here right now (not sales)? A rising rental-DOM trend means longer vacancies and softer asking-rent achievability than the comps imply.
- What's the recent tenant-quality profile in this submarket — average credit score on applications, eviction rate, late-payment / NSF rate, and stable-employment percentage? A property-management company in the area should have these aggregated.
- How much new for-sale + rental construction is in the pipeline within 1–3 miles? Heavy new supply typically softens prices + rents 12–24 months out; constrained supply supports both.
Investment metrics
- 1% rule
- 0.88% ✗
- Cap rate
- 4.46%
- Cash-on-cash
- -6.55%
- DSCR
- 0.71
- GRM
- 9.5
CMA / ARV
- ARV (median comp)
- $218,433
- List price
- $179,000
- Delta
- -18.05%
- Verdict
- UNDERPRICED
- Comps
- 20 within 1.0 mi
Show comp detail 5 sales within ~0.75 mi
| Address | Dist | Beds/Ba | Sqft | Sold | Price | $/sf | Match |
|---|---|---|---|---|---|---|---|
| 14514 E Cabana E #103 | 0.07mi | 1/1.0 | 663 (+5%) | 14mo | $225,000 | $339 | 77 |
| 14428 Compass St #105 | 0.25mi | 1/1.0 | 641 (+1%) | 15mo | $204,900 | $320 | 74 |
| 14428 Compass St #206 | 0.25mi | 1/1.0 | 630 (-0%) | 18mo | $224,000 | $356 | 73 |
| 14434 E East Cabana St #107 | 0.20mi | 1/1.0 | 674 (+7%) | 11mo | $223,500 | $332 | 70 |
| 14434 E Cabana St #116 | 0.15mi | 1/1.0 | 674 (+7%) | 19mo | $244,000 | $362 | 66 |
Match score weights: distance 35% · size 25% · config 20% · recency 20%. Top-matched comps best support the ARV.
Projected returns pro-forma
-3.0% appreciation · 0.0% rent growth · sell at horizon
- IRR
- -31.8%
- Equity multiple
- -0.01×
- Total profit
- $-50,842
- Equity at exit
- $26,689
- IRR
- -64.8%
- Equity multiple
- -0.67×
- Total profit
- $-83,735
- Equity at exit
- $15,477
Cash invested: $50,120 (down + closing). Projections, not guarantees.
Landlord ↔ Tenant lean methodology
- Overall (STATE)
- 87 Strongly Landlord-Friendly
- State Texas
- 87 Strongly Landlord-Friendly · R+5
- County
- — inherits STATE
- City
- — inherits STATE
ZIP-level market 78418
- Rents YoY
- -0.6%
- Active inventory
- 685
- Price-to-rent
- 9.5×
Monthly cashflow live
- Estimated rent
- $1,574 medium interval (Pro) →
- Mortgage (P&I)
- −$939
- Tax from tax record
- −$250 /mo · $2,998/yr
- Insurance
- −$75
- HOA
- −$254
- Vacancy / Maint / Mgmt
- −$331
- Net cashflow
- $-273
Break-even live
UW: 25.0% down · 7.5% · 30yr · 1.5% tax · 5.0% vac · 8.0% maint · 8.0% mgmt
Financing live
Cash to close
- Down payment
- $44,750
- Closing costs
- $5,370
- Reserves months
- —
- Total cash needed
- —
Loan-product check · same deal, 3 products live
Conventional
25% down · 7.5% · 30yr
- Down + closing
- —
- Monthly P&I
- —
- Monthly cashflow
- —
- DSCR
- —
- Eligible?
- —
Personal DTI + credit; lowest rate.
DSCR
20% down · 8.5% · 30yr
- Down + closing
- —
- Monthly P&I
- —
- Monthly cashflow
- —
- DSCR
- —
- Eligible?
- —
No personal income docs; deal must DSCR.
Hard money
10% down · 12.0% · 12mo
- Down + closing
- —
- Monthly P&I
- —
- Monthly cashflow
- —
- DSCR
- —
- Eligible?
- —
Short-term bridge; refi at stabilization.
Rent comps 3 comps
| Address | Beds | Baths | Sqft | Rent | $/sqft | DOM | Units | Dist |
|---|---|---|---|---|---|---|---|---|
| 14873 Granada Dr #13 Corpus Christi, TX | 1.0 | 1.0 | 390 | $950 | $2.44 | 13d | 1 | 0.97mi |
| 14898 Granada Dr Unit 1268412P Corpus Christi, TX | 1.0 | 1.0 | 441 | $1,984 | $4.50 | 43d | 1 | 1.05mi |
| 14721 Whitecap Blvd #323 Corpus Christi, TX | 1.0 | 1.0 | 565 | $1,800 | $3.19 | 21d | 1 | 1.36mi |
HOA detail
- Monthly dues
- $254 · $3,048/yr
- Likely covers
- poolparking
Listing history 32 events
-
2026-06-18days on market $179,000 Active 135 DOM
-
2026-06-17days on market $179,000 Active 134 DOM
-
2026-06-16days on market $179,000 Active 133 DOM
-
2026-06-15days on market $179,000 Active 132 DOM
-
2026-06-14days on market $179,000 Active 130 DOM
-
2026-06-13days on market $179,000 Active 129 DOM
-
2026-06-10days on market $179,000 Active 127 DOM
-
2026-06-09days on market $179,000 Active 126 DOM
-
2026-06-08days on market $179,000 Active 125 DOM
-
2026-06-07days on market $179,000 Active 124 DOM
-
2026-06-03days on market $179,000 Active 120 DOM
-
2026-06-02days on market $179,000 Active 119 DOM
-
2026-06-01days on market $179,000 Active 118 DOM
-
2026-05-31days on market $179,000 Active 117 DOM
-
2026-05-30days on market $179,000 Active 116 DOM
-
2026-02-03$179,000 Active 1250-char remark
Show marketing remark (1250 chars)
Welcome to Fairway Villas, where coastal living meets effortless ownership. This 1-bedroom, 1-bath condo is perfectly positioned to enjoy the very best of Padre Island living, offering a crisp blue resort-style pool, a canal behind the complex, and close proximity to the beach, dining, shopping, and outdoor recreation the island is known for. Inside, the condo is filled with natural light thanks to floor-to-ceiling windows/sliding glass patio doors installed in 2025, enhancing both energy efficiency and seamless indoor-outdoor living. The unit also includes one assigned parking space, adding convenience and ease for full-time residents or guests. Fairway Villas offers additional amenities including a grilling area and picnic space, perfect for relaxing after a day at the beach or entertaining friends. Designed for low-maintenance living, this condo is ideal as an income-producing investment, weekend getaway, or full-time island retreat. Located in a rapidly growing area of Padre Island with new construction nearby, this property offers both immediate enjoyment and long-term upside. Whether you’re seeking rental income or a laid-back coastal lifestyle, this is your opportunity to live—or invest in—the island life.
-
2025-05-30historical $1,300
-
2025-05-27$1,300
-
2025-05-20price $179,000
-
2025-04-12historical $1,300
-
2025-01-15$1,300
-
2025-01-13$184,900 Active
-
2024-06-07$155,000 Active
-
2022-11-22$185,000 Active
-
2021-09-26historical
-
2021-09-24soldstatus Closed
-
2021-09-11status Pending
-
2021-08-31historical Active Under Contract
-
2021-05-17price $121,000
-
2020-12-16status Active
-
2020-12-12historical Active Under Contract
-
2020-12-10$118,000 Active
ⓘ Source: listings_history table (triggers on properties + properties_extension) + one-shot
backfill from property_details.listing_events for pre-trigger history.
Tax reassessment forecast TX · Resets to sale price
- Current annual tax
- $2,998 · $250/mo
- Projected year-2 tax
- $3,276 · $273/mo
- Expected delta
- +$278/yr (+$23/mo · 9.3%)
ⓘ Screening estimate from a state-policy table — verify with the county assessor before closing.
Nearby sold comps map
Loading sold comps map…
Walkable amenities ~0.75 mi
Loading nearby amenities…
Taxation est. · year 1
- Rental income
- $18,890
- − Mortgage interest
- −$10,027
- − Property taxes
- −$2,998
- − Insurance
- −$895
- − Repairs & maintenance
- −$1,511
- − Management
- −$1,511
- − HOA
- −$3,048
- − Depreciation
- −$5,207
- Taxable loss
- −$6,307
- Est. tax savings @ 24.0%
- +$1,514
- After-tax cash flow
- $-1,768/yr
For passive investors: Depreciation is non-cash, so a rental often shows a tax loss while cash-flowing — sheltering income. Rental losses are passive: they offset passive income freely, and up to $25,000/yr can offset ordinary (W-2) income if you actively participate and your MAGI is under $100k (phasing out to $0 by $150k); unused losses carry forward. On sale, claimed depreciation is recaptured at up to 25%, and gains may owe capital-gains tax (a 1031 exchange can defer both). Figures are a year-1 estimate at your 24.0% rate — not tax advice; consult a CPA.
Schools (NCES district)
- District
- Flour Bluff ISD
- NCES district ID
- 4819380
- Math proficiency
- 43% ▼ -12.00%
- Reading proficiency
- 51% ▼ -2.00%
- Median HH income
- $57,162
- Composite
- 40.96/100
- National rank
- #3604
- State rank
- #209 of 826 in TX
Livability — Corpus Christi
- Score
- 78/100
- State rank
- #66
- US rank
- #2404
Category grades
Schools grade is shown separately in the Schools card above.
Census & demographics
- Census place
- Corpus Christi, TX
- County
- Nueces County · 296,836 people
- City population
- 296,836
- Metro
- Corpus Christi, TX
- Population (ZIP)
- 29,790
- Household income
- $92,445
- Rent vs Own
- Severe rent burden
- 808.0
Population outlook (Nueces County) Hauer SSP2
- Today (2025)
- 418,037 people
- By 2030
- 447,123 · +7.0%
- By 2040
- 505,911 · +21.0%
- By 2050
- 567,522 · +35.8%
- By 2075
- 729,686 · +74.6%
- By 2100
- 847,087 · +102.6%
Race, ethnicity, and origin ACS 2023
- Neighborhood character
- Majority White (61%)
- Race & ethnicity
- White 61% Hispanic / Latino 29% Two or more races 19% Asian 3% Black 3%
- Hispanic origin (detail)
- Mexican 25%
- Common ancestry
- Romanian 2% Lithuanian 2% Slovak 2%
- Foreign-born
- 7% · Canada, China
- Languages at home
- 83% English-only · Spanish 14% Tagalog/Filipino 2%
Political lean MEDSL · Nueces
- 2024 margin
- R (+11.5) · D 43.8% · R 55.3%
- 2008→2024 swing
- -7.1pp toward R · 2008: -4.4pp · 2024: -11.5pp
- All cycles
- 2024: R+11.5 2020: R+2.9 2016: R+1.5 2012: R+3.2 2008: R+4.4
Not yet ingested
- Civics
- —
Market trends
- HPI YoY
- ▼ -168.81%
- Current HPI
- 193.902
- Rent YoY
- ▼ -0.57%
- Metro
- Corpus Christi, TX
- State GDP YoY
- ▲ 3.95%
- F500 in state
- 110
Industry mix (Fortune 500 HQ in TX)
| Industry | F500 HQs | Revenue |
|---|---|---|
| Energy | 16 | $1,198B |
|
||
| Technology | 5 | $198B |
|
||
| Engineering / Construction | 4 | $72B |
|
||
| Energy Services | 3 | $60B |
|
||
| Utilities | 3 | $41B |
|
||
| Healthcare | 2 | $330B |
|
||
Price history
+51.7% since first listed17 events — show timeline
- 2026-02-03 Listed $179,000 CBMLS
- 2025-05-30 Rental Removed $1,300 CBMLS
- 2025-05-27 Listed for Rent $1,300 CBMLS
- 2025-05-20 Price Changed $179,000 CBMLS
- 2025-04-12 Rental Removed $1,300 CBMLS
- 2025-01-15 Listed for Rent $1,300 CBMLS
- 2025-01-13 Listed $184,900 CBMLS
- 2024-06-07 Listed $155,000 CBMLS
- 2022-11-22 Listed $185,000 CBMLS
- 2021-09-26 Delisted — CBMLS
- 2021-09-24 Sold (MLS) — CBMLS
- 2021-09-11 Pending — CBMLS
- 2021-08-31 Contingent — CBMLS
- 2021-05-17 Price Changed $121,000 CBMLS
- 2020-12-16 Relisted — CBMLS
- 2020-12-12 Contingent — CBMLS
- 2020-12-10 Listed $118,000 CBMLS
Property tax history
+7.6%/yrLatest (2025): $2,998 · -1.9% YoY. Source: county tax records.
Cash-flow waterfall
monthlySold comps — $/sqft
last 12 mo · ≤1 miLoading sold comps…