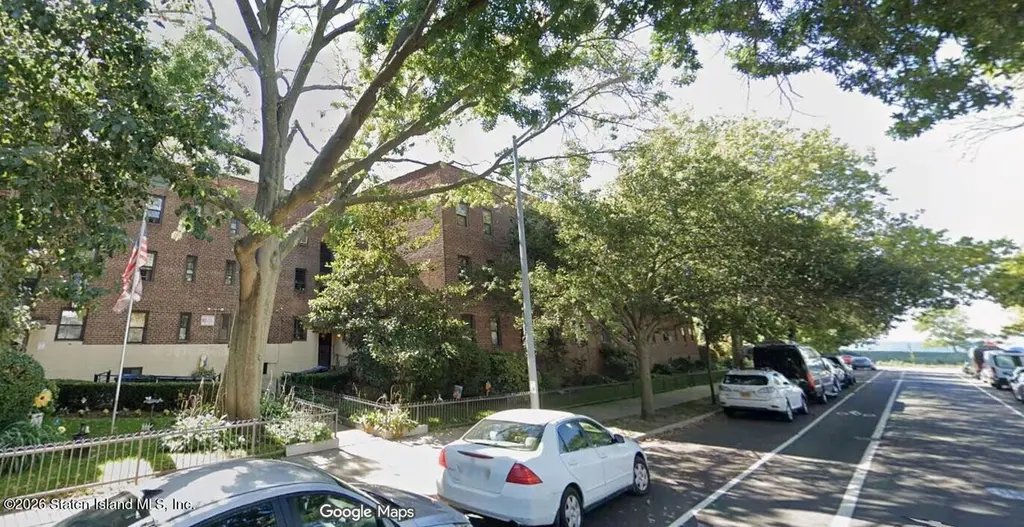
8895 Bay 16th St Unit 2b · New York, NY
Flood risk 1/10 · Minimal
- FEMA flood zone
- X (unshaded)
- Chance of flooding over 30 yrs
- 0.0%
- Est. flood insurance / yr
- $507 – $1,088
Fire risk 1/10 · Minimal
- Est. fire insurance / yr
- $691 – $1,283
Heat risk 6/10 · Moderate
- Hot days now (above 97°F)
- 6 days/yr
- Hot days in 30 yrs
- 14 days/yr
Wind risk 6/10 · Moderate
- Chance of severe wind over 30 yrs
- 68.0%
Air-quality risk 4/10 · Minor
- Unhealthy air days now
- 5 days/yr
- Unhealthy air days in 30 yrs
- 7 days/yr
Risk factors via First Street. Map © Google.
Why this score? — see what drove the C grade
The composite is a weighted blend of 9 inputs, each scored 0–100. Each bar is that input's sub-score; the figure is the points it added to the 100-point composite (weight × sub-score).
- Cash flow +17.3/30.0
- ARV discount +15.0/15.0
- DSCR +5.4/10.0
- Rent growth +5.0/5.0
- Schools +5.0/10.0
- 1% rule +4.7/10.0
- Livability +3.8/5.0
- Condition / age +2.2/5.0
- Appreciation +0.0/10.0
$274,900
🖨 Deal sheet 📄 Offer letter ✓ Due diligence
Listing remarks
Welcome to 8895 Bay 16th Street, Unit 2B - a bright and airy end unit nestled in a peaceful location down the block from Shore Parkway. ! This unit offers an updated kitchen with hardwood flooring throughout. A tiled bathroom, a large bedroom with 2 closets for extra storage, and plenty of windows bringing in natural light. Separate dinette and living room for comfortable living. You have your own washer/dryer hookup. Enjoy the quiet setting while being just minutes from Shore Parkway, shopping, and public transportation! Priced to sell for a cash deal.
Key facts
- Hardwood flooring
- 2 closets
- Large bedroom
Tags
Property features AI
Finance
- HOA & community: Part of Bayview Owners association; Monthly association dues; Pets allowed; Association covers taxes, snow removal, and exterior maintenance
Exterior
- Parking: On-street parking
- Utilities: 220-volt electrical service
- Home design: Single-story property; Built around 2020
- Construction: Brick construction; Built approximately in 2020
- Exterior features: Brick exterior; Located in the R-5 zone
Interior
- Bathrooms: One full bathroom
- Heating & cooling: Natural gas heating; Hot water heating
- Interior features: Central air conditioning (units); Good overall condition
Neighborhood map
What this means for you Summary
Snapshot
- This is a 1-bed/1.0-bath single-family listed at $275k. Condition is rated fair.
Deal economics
- At list price, monthly cash flow is $203 ($2k/yr) — positive.
- The deal already cash-flows at list — no discount required.
- To meet the 1% rule (rent ≥ 1% of price), the offer needs to be $266k (3.2% below list).
- Recommended offer: $266k (3.2% below list) — sets the bar for 1% rule.
- Cap rate 7.2% vs local median 2.6% in New York — top-decile yield for the area; either an underpriced asset or a hidden risk that comps aren't pricing in. Stress-test before assuming the spread holds.
Location & tenants
- Location reads 75/100 on livability (#268 in NY, #4,188 nationally) — a middle-class / working-renter tenant base. Strengths: amenities A+, commute A+, health & safety A; Watch: crime F, cost of living F.
- Market conditions: Rents rising fast (+12.9%/yr); 167 active listings in the ZIP; 2 comparable units currently listed for rent nearby; 10,063 units permitted in Kings County in 2024 (9,789 in 5+ unit buildings).
- At $2,661/mo this rent would consume 46% of the median local household income ($69k/yr) (locally 4963% of renters already pay >50% of income on rent) — very limited rent-growth headroom before tenants either downsize or default.
Forward outlook
- Local home prices are declining (-3.0%/yr); year-one equity from $2k of loan paydown is wiped out by about $8k of value loss. Plan a longer hold.
- Kings County population projected at +13% by 2050 — modest demand growth; plan on rents tracking national, not racing it.
- At projected returns (-3.0% appreciation + 8.0% rent growth), your $77k cash investment doubles in ~10 years — after that, you're playing with house money.
Negotiation context
- It's been on market 55 days — a 3% lower offer ($267k) is reasonable based on typical stale-listing flexibility.
- 2 sale attempts with the ask held roughly flat each time — persistent listings suggest the price (not the market) is what's stuck; bring a comps-based counter.
Risks & watch-outs
- Watch-outs: built in 1949 — expect roof / HVAC / electrical / plumbing capex.
- Climate carrying-cost: major wind risk, 68% chance of damaging wind over 30y; extreme-heat days projected 6→14/yr by 2055 (HVAC capex compounding) — expect insurance premiums to compound above CPI over the hold.
Questions for the listing agent
- It's been on market 55 days. Have you received any prior offers? Is the seller open to a 3% concession, seller financing, or rate buy-down credit?
- Have any recent inspections been done? Can we get a copy of the seller's disclosures and any deferred-maintenance estimates?
- Built in 1949 — when were the roof, HVAC, electrical panel, plumbing, and water heater last replaced?
- Is there a deadline driving the sale (1031 exchange, divorce, estate, relocation)? That informs how much negotiation room exists.
- Schools are B-rated — typically a magnet for longer-tenancy family renters. What's the average tenant stay here, and is there a school-zone premium baked into asking?
- Crime grade is F in this area — have there been break-ins, vandalism, or insurance claims at this property in the last 3 years? What carrier currently insures it and at what premium?
- What's the average days-on-market for RENTAL listings here right now (not sales)? A rising rental-DOM trend means longer vacancies and softer asking-rent achievability than the comps imply.
- What's the recent tenant-quality profile in this submarket — average credit score on applications, eviction rate, late-payment / NSF rate, and stable-employment percentage? A property-management company in the area should have these aggregated.
- How much new for-sale + rental construction is in the pipeline within 1–3 miles? Heavy new supply typically softens prices + rents 12–24 months out; constrained supply supports both.
Investment metrics
- 1% rule
- 0.97% ✗
- Cap rate
- 7.18%
- Cash-on-cash
- 3.16%
- DSCR
- 1.14
- GRM
- 8.6
CMA / ARV
- ARV (on-the-fly)
- $343,000
- Comps found
- 4
Show comp detail 4 sales within ~0.75 mi
| Address | Dist | Beds/Ba | Sqft | Sold | Price | $/sf | Match |
|---|---|---|---|---|---|---|---|
| 8895 Bay 16th St Unit 2b | 0.00mi | 1/1.0 | 700 (0%) | 0mo | $250,000 | $357 | 100 |
| 153 Bay 26 St Unit 3f | 0.56mi | 2/1.0 (+1) | 730 (+4%) | 4mo | $358,000 | $490 | 59 |
| 258 Bay 19th St Unit B | 0.14mi | 1/1.0 | 800 (+14%) | 16mo | $313,425 | $392 | 56 |
| 8800 Bay Pkwy Unit 4a | 0.69mi | 2/1.0 (+1) | 739 (+6%) | 8mo | $475,000 | $643 | 47 |
Match score weights: distance 35% · size 25% · config 20% · recency 20%. Top-matched comps best support the ARV.
Projected returns pro-forma
-3.0% appreciation · 8.0% rent growth · sell at horizon
- IRR
- -5.8%
- Equity multiple
- 0.77×
- Total profit
- $-17,531
- Equity at exit
- $40,988
- IRR
- 9.0%
- Equity multiple
- 1.85×
- Total profit
- $65,536
- Equity at exit
- $23,768
Cash invested: $76,972 (down + closing). Projections, not guarantees.
Landlord ↔ Tenant lean methodology
- Overall (CITY)
- 0 Strongly Tenant-Friendly
- State New York
- 15 Strongly Tenant-Friendly · D+10
- County
- — inherits STATE
- City New York
- 0 Strongly Tenant-Friendly · D+34
ZIP-level market 11204
- Home prices YoY
- -32.9%
- Rents YoY
- 12.9%
- Active inventory
- 167
- Price-to-rent
- 8.6×
Monthly cashflow live
- Estimated rent
- $2,661 medium interval (Pro) →
- Mortgage (P&I)
- −$1,442
- Tax est. 1.5%
- −$344 /mo · $4,124/yr
- Insurance
- −$115
- HOA
- −$0
- Vacancy / Maint / Mgmt
- −$559
- Net cashflow
- $203
Break-even live
UW: 25.0% down · 7.5% · 30yr · 1.5% tax · 5.0% vac · 8.0% maint · 8.0% mgmt
Financing live
Cash to close
- Down payment
- $68,725
- Closing costs
- $8,247
- Reserves months
- —
- Total cash needed
- —
Loan-product check · same deal, 3 products live
Conventional
25% down · 7.5% · 30yr
- Down + closing
- —
- Monthly P&I
- —
- Monthly cashflow
- —
- DSCR
- —
- Eligible?
- —
Personal DTI + credit; lowest rate.
DSCR
20% down · 8.5% · 30yr
- Down + closing
- —
- Monthly P&I
- —
- Monthly cashflow
- —
- DSCR
- —
- Eligible?
- —
No personal income docs; deal must DSCR.
Hard money
10% down · 12.0% · 12mo
- Down + closing
- —
- Monthly P&I
- —
- Monthly cashflow
- —
- DSCR
- —
- Eligible?
- —
Short-term bridge; refi at stabilization.
Rent comps 2 comps
| Address | Beds | Baths | Sqft | Rent | $/sqft | DOM | Units | Dist |
|---|---|---|---|---|---|---|---|---|
| 2286 Cropsey Ave Unit 19C Brooklyn, NY | 1.0 | 1.0 | 544 | $3,600 | $6.62 | 18d | 1 | 0.82mi |
| 1131 86th St #4 Brooklyn, NY | 1.0 | 1.0 | 550 | $2,350 | $4.27 | 24d | 1 | 1.06mi |
Listing history 13 events
-
2026-06-10days on market $274,900 Active 55 DOM
-
2026-06-08days on market $274,900 Active 54 DOM
-
2026-06-08days on market $274,900 Active 53 DOM
-
2026-06-04days on market $274,900 Active 50 DOM
-
2026-06-03days on market $274,900 Active 49 DOM
-
2026-06-01days on market $274,900 Active 47 DOM
-
2026-05-31days on market $274,900 Active 46 DOM
-
2026-04-15$274,900 Active
-
2025-07-31historical
-
2025-05-15price $274,900
-
2025-04-02price $285,000
-
2025-02-27price $290,000
-
2025-02-05$299,000 Active
ⓘ Source: listings_history table (triggers on properties + properties_extension) + one-shot
backfill from property_details.listing_events for pre-trigger history.
Climate risk First Street
- Flood 1/10 Low FEMA zone X (unshaded) · 0% chance over 30 yrs
- Wildfire 1/10 Low
- Heat 6/10 Major 6 d/yr ≥97°F today · 14 d/yr by 30 yrs out
- Wind 6/10 Major 68% chance of damaging wind over 30 yrs
- Air quality 4/10 Moderate 5 unhealthy d/yr today · 7 by 30 yrs out
Nearby sold comps map
Loading sold comps map…
Walkable amenities ~0.75 mi
Loading nearby amenities…
Taxation est. · year 1
- Rental income
- $31,936
- − Mortgage interest
- −$15,399
- − Property taxes
- −$4,124
- − Insurance
- −$1,374
- − Repairs & maintenance
- −$2,555
- − Management
- −$2,555
- − Depreciation
- −$7,997
- Taxable loss
- −$2,067
- Est. tax savings @ 24.0%
- +$496
- After-tax cash flow
- $2,929/yr
For passive investors: Depreciation is non-cash, so a rental often shows a tax loss while cash-flowing — sheltering income. Rental losses are passive: they offset passive income freely, and up to $25,000/yr can offset ordinary (W-2) income if you actively participate and your MAGI is under $100k (phasing out to $0 by $150k); unused losses carry forward. On sale, claimed depreciation is recaptured at up to 25%, and gains may owe capital-gains tax (a 1031 exchange can defer both). Figures are a year-1 estimate at your 24.0% rate — not tax advice; consult a CPA.
Condition & rehab AI · 12 photos
This unit is in fair condition with moderate rehab needs. It offers an updated kitchen and hardwood flooring, but requires some cleaning and minor repairs.
Repairs flagged
- Minor ceiling fan — slightly dusty
- Minor light fixture — slightly dusty
Value-add opportunities
- Both paint interior walls — fresh paint enhances curb appeal and interior aesthetics
- Both replace ceiling fan — newer, more efficient fan improves air circulation and reduces energy consumption
- Both replace light fixture — newer, more efficient light fixture improves lighting and reduces energy consumption
Renovation cost estimate screening
| Repair item | Severity | Est. cost |
|---|---|---|
| ceiling fan · slightly dusty | Minor | $500–3,000 |
| light fixture · slightly dusty | Minor | $500–3,000 |
| Total estimated repair cost · 2 items | $1,000–6,000 |
Value-add ROI direction
- Both paint interior walls — fresh paint enhances curb appeal and interior aesthetics ↑
- Both replace ceiling fan — newer, more efficient fan improves air circulation and reduces energy consumption ↑
- Both replace light fixture — newer, more efficient light fixture improves lighting and reduces energy consumption ↑
ⓘ Cost ranges are severity-bucket heuristics (US national rule-of-thumb). Get contractor quotes + a written scope before underwriting a rehab budget.
Schools (NCES district)
No district data.
Livability — New York
- Score
- 75/100
- State rank
- #268
- US rank
- #4188
Category grades
Schools grade is shown separately in the Schools card above.
Census & demographics
- Census place
- New York, NY
- County
- Kings County · 2,614,986 people
- City population
- 7,731,280
- Metro
- New York-Newark-Jersey City, NY-NJ-PA
- Population (ZIP)
- 79,800
- Household income
- $69,479
- Rent vs Own
- Severe rent burden
- 4963.0
Population outlook (Kings County) Hauer SSP2
- Today (2025)
- 2,847,441 people
- By 2030
- 2,937,006 · +3.1%
- By 2040
- 3,095,491 · +8.7%
- By 2050
- 3,228,968 · +13.4%
- By 2075
- 3,321,723 · +16.7%
- By 2100
- 3,111,387 · +9.3%
Race, ethnicity, and origin ACS 2023
- Neighborhood character
- Diverse neighborhood (Simpson 0.62)
- Race & ethnicity
- White 53% Asian 29% Hispanic / Latino 13% Two or more races 4%
- Hispanic origin (detail)
- Mexican 5% Puerto Rican 2%
- Common ancestry
- Subsaharan African 3% Scotch-Irish 3% Romanian 2%
- Foreign-born
- 44% · China, Canada, Vietnam
- Languages at home
- 23% English-only · Chinese 23% German/W. Germanic 19% Spanish 10%
Political lean MEDSL · Kings
- 2024 margin
- Solid D (+44.0) · D 72.0% · R 28.0%
- 2008→2024 swing
- -15.5pp toward R · 2008: 59.4pp · 2024: 44.0pp
- All cycles
- 2024: D+44.0 2020: D+54.8 2016: D+61.8 2012: D+63.9 2008: D+59.4
Not yet ingested
- Civics
- —
Market trends
- HPI YoY
- ▼ -217.07%
- Current HPI
- 443.1608
- Rent YoY
- ▲ 12.87%
- Metro
- New York-Newark-Jersey City, NY-NJ-PA
- State GDP YoY
- ▲ 2.60%
- F500 in state
- 92
Industry mix (Fortune 500 HQ in NY)
| Industry | F500 HQs | Revenue |
|---|---|---|
| Financial Services | 10 | $950B |
|
||
| Consumer Goods | 9 | $162B |
|
||
| Insurance | 4 | $225B |
|
||
| Telecommunications | 2 | $144B |
|
||
| Pharmaceuticals | 2 | $112B |
|
||
| Media / Entertainment | 2 | $69B |
|
||
Price history
-8.1% since first listed6 events — show timeline
- 2026-04-15 Listed $274,900 SIBORMLS
- 2025-07-31 Listing Removed — SIBORMLS
- 2025-05-15 Price Changed $274,900 SIBORMLS
- 2025-04-02 Price Changed $285,000 SIBORMLS
- 2025-02-27 Price Changed $290,000 SIBORMLS
- 2025-02-05 Listed $299,000 SIBORMLS
Cash-flow waterfall
monthlySold comps — $/sqft
last 12 mo · ≤1 miLoading sold comps…