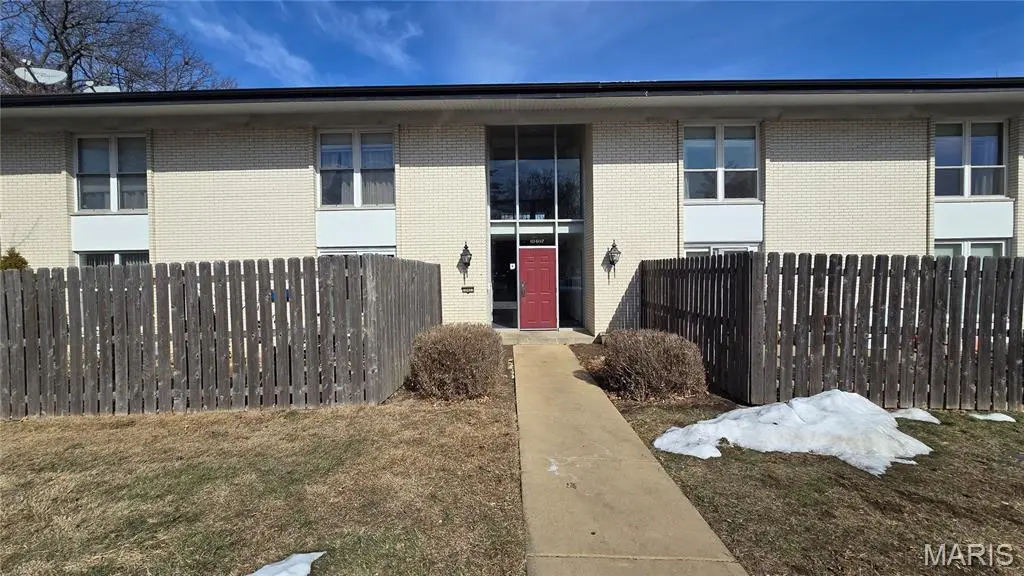
10407 Briarbend Dr #3 · Creve Coeur, MO
Flood risk 1/10 · Minimal
- FEMA flood zone
- X (unshaded)
- Chance of flooding over 30 yrs
- 0.0%
- Est. flood insurance / yr
- $507 – $1,088
Fire risk 1/10 · Minimal
- Est. fire insurance / yr
- $1,054 – $1,958
Heat risk 5/10 · Moderate
- Hot days now (above 106°F)
- 7 days/yr
- Hot days in 30 yrs
- 21 days/yr
Wind risk 2/10 · Minimal
- Chance of severe wind over 30 yrs
- 1.0%
Air-quality risk 2/10 · Minimal
- Unhealthy air days now
- 1 days/yr
- Unhealthy air days in 30 yrs
- 3 days/yr
Risk factors via First Street. Map © Google.
Why this score? — see what drove the C grade
The composite is a weighted blend of 9 inputs, each scored 0–100. Each bar is that input's sub-score; the figure is the points it added to the 100-point composite (weight × sub-score).
- Cash flow +14.0/30.0
- Appreciation +10.0/10.0
- ARV discount +7.5/15.0
- 1% rule +6.9/10.0
- Schools +6.3/10.0
- DSCR +4.3/10.0
- Livability +4.0/5.0
- Condition / age +2.5/5.0
- Rent growth +1.8/5.0
$114,999
🖨 Deal sheet 📄 Offer letter ✓ Due diligence
Listing remarks MLS
Welcome to this beautifully updated 2-bedroom, 1-bath main floor condo offering 836 sq ft of comfortable living space in the highly sought-after Pattonville School District. This move-in-ready unit features brand new vinyl flooring, fresh paint throughout, and new windows in both the spacious living room and rear bedroom, providing abundant natural light and energy efficiency. Enjoy a cozy kitchen with a charming breakfast area, perfect for casual dining, and a generously sized living room ideal for relaxing or entertaining. Convenient main-floor access makes everyday living easy, while the basement provides additional space for laundry. Residents also enjoy access to the community pool — just in time for summer! A fantastic opportunity for first-time buyers, downsizers, or investors alike.
Key facts
- $328 HOA
- Community pool
- Built 1963
Neighborhood map
What this means for you Summary
Snapshot
- This is a 2-bed/1.0-bath condo listed at $115k.
Deal economics
- At list price, monthly cash flow is $16 ($189/yr) — positive.
- The deal already cash-flows at list — no discount required.
- Meets the 1% rule at list price ($1k rent vs $115k).
- Recommended offer: $101k (12.0% below list) — sets the bar for market timing.
- Cap rate 6.5% vs local median 2.7% in Creve Coeur — top-decile yield for the area; either an underpriced asset or a hidden risk that comps aren't pricing in. Stress-test before assuming the spread holds.
Location & tenants
- Location reads 81/100 on livability (#16 in MO, #1,519 nationally) — a professional / high-income tenant draw. Strengths: employment A+, housing A+, schools A-; Watch: amenities C-, cost of living F.
- Ladue (suburban): math 64% / reading 70% proficiency, ranked #2 of 324 in MO (top 1%) — acceptable for families but not a draw, mixed tenant base, ~2y average lease; only 9% free/reduced lunch — higher-income household profile.
- Market conditions: Rents soft (-3.0%/yr); 170 active listings in the ZIP; 12 comparable units currently listed for rent nearby; rentals lingering (median 44d on market — plan ~5-8 weeks vacancy on turnover, expect pricing pressure); 58% of comp listings sitting > 30 days — soft ceiling on asking rent; solid renter incomes; 920 units permitted in St. Louis County in 2024 (250 in 5+ unit buildings).
Forward outlook
- In year one you build about $12k of equity ($795 loan paydown + $12k appreciation (10.0% local appreciation)).
- At projected returns (10.0% appreciation + 0.0% rent growth), your $32k cash investment doubles in ~3 years — after that, you're playing with house money.
- By year 3, paydown + projected appreciation supports a ~$31k cash-out refi (75% LTV) — recoverable capital for the next deal without selling this one.
Negotiation context
- It's been on market 126 days — a 12% lower offer ($101k) is reasonable based on typical stale-listing flexibility.
- 6 sale attempts since 3y ago with the ask held roughly flat each time — persistent listings suggest the price (not the market) is what's stuck; bring a comps-based counter.
Risks & watch-outs
- Watch-outs: HOA is 24% of rent.
- Climate carrying-cost: extreme-heat days projected 7→21/yr by 2055 (HVAC capex compounding) — expect insurance premiums to compound above CPI over the hold.
Questions for the listing agent
- It's been on market 126 days. Have you received any prior offers? Is the seller open to a 12% concession, seller financing, or rate buy-down credit?
- Built in 1963 — when were the roof, HVAC, electrical panel, plumbing, and water heater last replaced?
- What does the HOA fee cover, when was the last increase, and are there any pending special assessments or reserve-fund shortfalls?
- Any open or pending special assessments — roof, HVAC, plumbing, elevator, façade? What's the per-unit balance and payoff schedule, and is the seller paying it off at close or rolling it to the buyer?
- Why hasn't it sold? Are there any deal-killer items the seller is aware of (foundation, flood, title, zoning, code violations)?
- Is there a deadline driving the sale (1031 exchange, divorce, estate, relocation)? That informs how much negotiation room exists.
- Schools are A-rated — typically a magnet for longer-tenancy family renters. What's the average tenant stay here, and is there a school-zone premium baked into asking?
- What's the average days-on-market for RENTAL listings here right now (not sales)? A rising rental-DOM trend means longer vacancies and softer asking-rent achievability than the comps imply.
- What's the recent tenant-quality profile in this submarket — average credit score on applications, eviction rate, late-payment / NSF rate, and stable-employment percentage? A property-management company in the area should have these aggregated.
- How much new apartment / multifamily construction is in the pipeline within 1–3 miles? Heavy new supply (>2% of stock underway) typically softens rents 12–24 months out; light construction supports rent growth.
Investment metrics
- 1% rule
- 1.19% ✓
- Cap rate
- 6.46%
- Cash-on-cash
- 0.59%
- DSCR
- 1.03
- GRM
- 7.0
CMA / ARV
- ARV (median comp)
- $115,105
- List price
- $114,999
- Delta
- -0.09%
- Verdict
- FAIR
- Comps
- 20 within 1.0 mi
Projected returns pro-forma
10.0% appreciation · 0.0% rent growth · sell at horizon
- IRR
- 23.4%
- Equity multiple
- 2.86×
- Total profit
- $59,799
- Equity at exit
- $103,600
- IRR
- 20.0%
- Equity multiple
- 6.23×
- Total profit
- $168,477
- Equity at exit
- $223,418
Cash invested: $32,200 (down + closing). Projections, not guarantees.
Landlord ↔ Tenant lean methodology
- Overall (STATE)
- 81 Strongly Landlord-Friendly
- State Missouri
- 81 Strongly Landlord-Friendly · R+10
- County
- — inherits STATE
- City
- — inherits STATE
ZIP-level market 63146
- Home prices YoY
- 4.9%
- Rents YoY
- -3.0%
- Active inventory
- 170
- Price-to-rent
- 7.0×
Monthly cashflow live
- Estimated rent
- $1,374 high interval (Pro) →
- Mortgage (P&I)
- −$603
- Tax from tax record
- −$91 /mo · $1,087/yr
- Insurance
- −$48
- HOA
- −$328
- Vacancy / Maint / Mgmt
- −$289
- Net cashflow
- $16
Break-even live
UW: 25.0% down · 7.5% · 30yr · 1.5% tax · 5.0% vac · 8.0% maint · 8.0% mgmt
Financing live
Cash to close
- Down payment
- $28,750
- Closing costs
- $3,450
- Reserves months
- —
- Total cash needed
- —
Loan-product check · same deal, 3 products live
Conventional
25% down · 7.5% · 30yr
- Down + closing
- —
- Monthly P&I
- —
- Monthly cashflow
- —
- DSCR
- —
- Eligible?
- —
Personal DTI + credit; lowest rate.
DSCR
20% down · 8.5% · 30yr
- Down + closing
- —
- Monthly P&I
- —
- Monthly cashflow
- —
- DSCR
- —
- Eligible?
- —
No personal income docs; deal must DSCR.
Hard money
10% down · 12.0% · 12mo
- Down + closing
- —
- Monthly P&I
- —
- Monthly cashflow
- —
- DSCR
- —
- Eligible?
- —
Short-term bridge; refi at stabilization.
Rent comps 12 comps
| Address | Beds | Baths | Sqft | Rent | $/sqft | DOM | Units | Dist |
|---|---|---|---|---|---|---|---|---|
| 10427 Briarbend Dr #8 Saint Louis, MO | 2.0 | 1.5 | 858 | $1,350 | $1.57 | 23d | 1 | 0.08mi |
| 10364 Forest Brook Ln Saint Louis, MO | 2.0 | 2.0 | 1053 | $1,400 | $1.33 | 43d | 1 | 0.11mi |
| 10368 Forest Brook Ln Unit F Saint Louis, MO | 2.0 | 2.0 | 1053 | $1,350 | $1.28 | 43d | 1 | 0.13mi |
| 10352 Forest Brook Ln Unit G Saint Louis, MO | 1.0 | 1.0 | 600 | $1,400 | $2.33 | 43d | 1 | 0.14mi |
| 10304 Oxford Hill Dr St. Louis, MO | 1.0–3.0 | 1.0–2.0 | 925 | $1,489 | $1.61 | 2d | 47 | 0.33mi |
| 1380 Willow Brook Cove Ct St. Louis, MO | 2.0 | 1.5 | 910 | $1,550 | $1.70 | 14d | 1 | 0.63mi |
| 1434 Willow Brook Cove Ct St. Louis, MO | 2.0 | 1.5 | 910 | $1,395 | $1.53 | 43d | 1 | 0.65mi |
| 9826 Greenery Ln Saint Louis, MO | 2.0 | 1.0 | 900 | $1,275 | $1.42 | 43d | 1 | 0.85mi |
| 9814 Greenery Ln Unit D Saint Louis, MO | 2.0 | 1.0 | 875 | $1,250 | $1.43 | 23d | 1 | 0.85mi |
| 9882 Greenery Ln Saint Louis, MO | 2.0 | 1.0 | 900 | $1,400 | $1.56 | 43d | 1 | 0.85mi |
| 9814 Greenery Ln Saint Louis, MO | 2.0 | 1.0 | 900 | $1,475 | $1.64 | 43d | 1 | 0.85mi |
| 10900 Oak Forest Pkwy Dr St. Louis, MO | 1.0–2.0 | 1.0 | 800 | $1,600 | $2.00 | 3d | 6 | 0.88mi |
HOA detail condo
- Monthly dues
- $328 · $3,936/yr
- Likely covers
- pool
- Assessments
- None detected in remarks — confirm with the listing agent.
Listing history 29 events
-
2026-06-18days on market $114,999 Active 126 DOM
-
2026-06-17days on market $114,999 Active 125 DOM
-
2026-06-16days on market $114,999 Active 124 DOM
-
2026-06-15days on market $114,999 Active 123 DOM
-
2026-06-13days on market $114,999 Active 121 DOM
-
2026-06-13days on market $114,999 Active 120 DOM
-
2026-06-09days on market $114,999 Active 117 DOM
-
2026-06-08days on market $114,999 Active 116 DOM
-
2026-06-07pricedays on market $114,999 Active 115 DOM
-
2026-06-03days on market $120,000 Active 111 DOM
-
2026-06-02days on market $120,000 Active 110 DOM
-
2026-06-01days on market $120,000 Active 109 DOM
-
2026-05-31days on market $120,000 Active 108 DOM
-
2026-02-13$120,000 Active 807-char remark
Show marketing remark (807 chars)
Welcome to this beautifully updated 2-bedroom, 1-bath main floor condo offering 836 sq ft of comfortable living space in the highly sought-after Pattonville School District. This move-in-ready unit features brand new vinyl flooring, fresh paint throughout, and new windows in both the spacious living room and rear bedroom, providing abundant natural light and energy efficiency. Enjoy a cozy kitchen with a charming breakfast area, perfect for casual dining, and a generously sized living room ideal for relaxing or entertaining. Convenient main-floor access makes everyday living easy, while the basement provides additional space for laundry. Residents also enjoy access to the community pool — just in time for summer! A fantastic opportunity for first-time buyers, downsizers, or investors alike.
-
2026-02-12historical $120,000 807-char remark
Show marketing remark (807 chars)
Welcome to this beautifully updated 2-bedroom, 1-bath main floor condo offering 836 sq ft of comfortable living space in the highly sought-after Pattonville School District. This move-in-ready unit features brand new vinyl flooring, fresh paint throughout, and new windows in both the spacious living room and rear bedroom, providing abundant natural light and energy efficiency. Enjoy a cozy kitchen with a charming breakfast area, perfect for casual dining, and a generously sized living room ideal for relaxing or entertaining. Convenient main-floor access makes everyday living easy, while the basement provides additional space for laundry. Residents also enjoy access to the community pool — just in time for summer! A fantastic opportunity for first-time buyers, downsizers, or investors alike.
-
2025-12-09$1,150 Active
-
2025-05-09$1,300
-
2025-04-30historical
-
2025-04-01price $124,900
-
2025-02-24$129,900 Active
-
2025-02-20historical
-
2023-11-27historical
-
2023-11-27$119,000 Active
-
2023-11-06historical
-
2023-11-03soldstatus Closed
-
2023-10-14status Pending
-
2023-10-12$89,900 Active
-
2001-11-09soldstatus
-
1988-03-01soldstatus
ⓘ Source: listings_history table (triggers on properties + properties_extension) + one-shot
backfill from property_details.listing_events for pre-trigger history.
Tax reassessment forecast MO · Resets to sale price
- Current annual tax
- $1,087 · $91/mo
- Projected year-2 tax
- $1,115 · $93/mo
- Expected delta
- +$29/yr (+$2/mo · 2.6%)
ⓘ Screening estimate from a state-policy table — verify with the county assessor before closing.
Climate risk First Street
- Flood 1/10 Low FEMA zone X (unshaded) · 0% chance over 30 yrs
- Wildfire 1/10 Low
- Heat 5/10 Major 7 d/yr ≥106°F today · 21 d/yr by 30 yrs out
- Wind 2/10 Low 100% chance of damaging wind over 30 yrs
- Air quality 2/10 Low 1 unhealthy d/yr today · 3 by 30 yrs out
Nearby sold comps map
Loading sold comps map…
Walkable amenities ~0.75 mi
Loading nearby amenities…
Taxation est. · year 1
- Rental income
- $16,486
- − Mortgage interest
- −$6,442
- − Property taxes
- −$1,087
- − Insurance
- −$575
- − Repairs & maintenance
- −$1,319
- − Management
- −$1,319
- − HOA
- −$3,936
- − Depreciation
- −$3,345
- Taxable loss
- −$1,537
- Est. tax savings @ 24.0%
- +$369
- After-tax cash flow
- $558/yr
For passive investors: Depreciation is non-cash, so a rental often shows a tax loss while cash-flowing — sheltering income. Rental losses are passive: they offset passive income freely, and up to $25,000/yr can offset ordinary (W-2) income if you actively participate and your MAGI is under $100k (phasing out to $0 by $150k); unused losses carry forward. On sale, claimed depreciation is recaptured at up to 25%, and gains may owe capital-gains tax (a 1031 exchange can defer both). Figures are a year-1 estimate at your 24.0% rate — not tax advice; consult a CPA.
Schools (NCES district)
- District
- Ladue
- NCES district ID
- 2917820
- Math proficiency
- 64% ▼ -6.00%
- Reading proficiency
- 70% ▼ -2.00%
- Median HH income
- $109,713
- Composite
- 62.57/100
- National rank
- #681
- State rank
- #2 of 324 in MO
Livability — Creve Coeur
- Score
- 81/100
- State rank
- #16
- US rank
- #1519
Category grades
Schools grade is shown separately in the Schools card above.
Census & demographics
- County
- Saint Louis County · 888,823 people
- City population
- 20,932
- Metro
- St. Louis, MO-IL
- Population (ZIP)
- 30,678
- Household income
- $84,756
- Rent vs Own
- Severe rent burden
- 1156.0
Population outlook (St. Louis County) Hauer SSP2
- Today (2025)
- 1,025,227 people
- By 2030
- 1,028,023 · +0.3%
- By 2040
- 1,020,940 · -0.4%
- By 2050
- 1,007,280 · -1.8%
- By 2075
- 987,277 · -3.7%
- By 2100
- 921,984 · -10.1%
Race, ethnicity, and origin ACS 2023
- Neighborhood character
- Diverse neighborhood (Simpson 0.56)
- Race & ethnicity
- White 63% Asian 17% Black 13% Two or more races 4% Hispanic / Latino 3%
- Common ancestry
- Scotch-Irish 3% Romanian 3% Italian 2%
- Foreign-born
- 19% · China, South Korea, Canada
- Languages at home
- 79% English-only · Other Asian/Pacific 7% Other Indo-European 4% Chinese 3%
Political lean MEDSL · St. Louis
- 2024 margin
- Strong D (+23.4) · D 60.8% · R 37.4% · Other 1.7%
- 2008→2024 swing
- +3.5pp toward D · 2008: 19.9pp · 2024: 23.4pp
- All cycles
- 2024: D+23.4 2020: D+24.0 2016: D+16.2 2012: D+13.7 2008: D+19.9
Not yet ingested
- Civics
- —
Market trends
- HPI YoY
- ▲ 33.10%
- Current HPI
- 711.49
- Rent YoY
- ▼ -2.96%
- Metro
- St. Louis, MO-IL
- State GDP YoY
- ▲ 1.84%
- F500 in state
- 20
Industry mix (Fortune 500 HQ in MO)
| Industry | F500 HQs | Revenue |
|---|---|---|
| Healthcare | 1 | $163B |
|
||
| Insurance | 1 | $21B |
|
||
| Industrial Technology | 1 | $17B |
|
||
| Retail | 1 | $16B |
|
||
| Industrial Distribution | 1 | $10B |
|
||
| Utilities | 1 | $9B |
|
||
Price history
+33.5% since first listed16 events — show timeline
- 2026-02-13 Listed $120,000 MARIS as Distributed by MLS Grid
- 2026-02-12 Coming Soon $120,000 MARIS as Distributed by MLS Grid
- 2025-12-09 Listed $1,150 MARIS as Distributed by MLS Grid
- 2025-05-09 Listed for Rent $1,300 REDFIN
- 2025-04-30 Delisted — MARIS as Distributed by MLS Grid
- 2025-04-01 Price Changed $124,900 MARIS as Distributed by MLS Grid
- 2025-02-24 Listed $129,900 MARIS as Distributed by MLS Grid
- 2025-02-20 Coming Soon — MARIS as Distributed by MLS Grid
- 2023-11-27 Delisted — MARIS as Distributed by MLS Grid
- 2023-11-27 Listed $119,000 MARIS as Distributed by MLS Grid
- 2023-11-06 Coming Soon — MARIS as Distributed by MLS Grid
- 2023-11-03 Sold (MLS) — MARIS as Distributed by MLS Grid
- 2023-10-14 Pending — MARIS as Distributed by MLS Grid
- 2023-10-12 Listed $89,900 MARIS as Distributed by MLS Grid
- 2001-11-09 Sold (Public Records) — Public Records
- 1988-03-01 Sold (Public Records) — Public Records
Property tax history
+2.5%/yrLatest (2022): $1,087 · +0.5% YoY. Source: county tax records.
Cash-flow waterfall
monthlySold comps — $/sqft
last 12 mo · ≤1 miLoading sold comps…