3658 Georgia Trce · San Antonio, TX
Flood risk No data
- FEMA flood zone
- —
- Chance of flooding over 30 yrs
- —
- Est. flood insurance / yr
- —
Fire risk No data
- Est. fire insurance / yr
- —
Heat risk No data
- Hot days now (above threshold)
- —
- Hot days in 30 yrs
- —
Wind risk No data
- Chance of severe wind over 30 yrs
- —
Air-quality risk No data
- Unhealthy air days now
- —
- Unhealthy air days in 30 yrs
- —
Risk factors via First Street. Map © Google.
Why this score? — see what drove the D+ grade
The composite is a weighted blend of 9 inputs, each scored 0–100. Each bar is that input's sub-score; the figure is the points it added to the 100-point composite (weight × sub-score).
- ARV discount +15.0/15.0
- Cash flow +12.7/30.0
- Livability +4.0/5.0
- 1% rule +3.8/10.0
- DSCR +3.8/10.0
- Condition / age +2.5/5.0
- Rent growth +2.2/5.0
- Schools +1.9/10.0
- Appreciation +0.0/10.0
$231,999
🖨 Deal sheet 📄 Offer letter ✓ Due diligence
Listing remarks
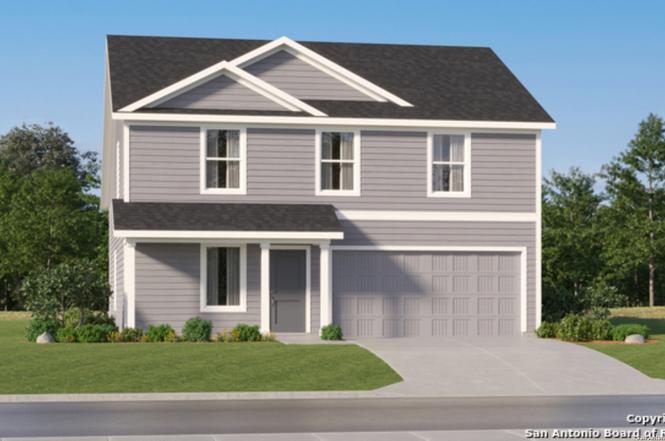
The Littleton - On the first floor of this spacious two-story home is a convenient and modern layout seamlessly connecting the kitchen, dining room and family room together. In a private corner is the tranquil owner's suite with an attached bathroom and walk-in closet. Upstairs is a sprawling central game room made for gatherings of all sizes, along with three secondary bedrooms to provide sleeping accommodations. Estimated Completion April 2026. The completion date, prices and features may vary and are subject to change. Please verify with Lennar directly. Photos are for illustrative purposes only.
Key facts
- Central game room
- Attached bathroom
- Walk-in closet
Tags
Neighborhood map
What this means for you Summary
Snapshot
- This is a 4-bed/2.5-bath single-family listed at $232k.
Deal economics
- At list price, monthly cash flow is $-26 ($-311/yr) — negative.
- To cash-flow at today's rent, offer at most $228k (1.6% below list).
- To meet the 1% rule (rent ≥ 1% of price), the offer needs to be $204k (12.0% below list).
- Recommended offer: $204k (12.0% below list) — sets the bar for 1% rule.
- Cap rate 6.2% vs local median 3.8% in San Antonio — top-decile yield for the area; either an underpriced asset or a hidden risk that comps aren't pricing in. Stress-test before assuming the spread holds.
Location & tenants
- Location reads 80/100 on livability (#31 in TX, #1,616 nationally) — a professional / high-income tenant draw. Strengths: amenities A+, commute A+, cost of living A+; Watch: schools C-, crime F.
- East Central ISD (rural): math 16% / reading 25% proficiency, ranked #758 of 826 in TX (top 92%) — low school quality limits family demand, transient renter base, plan for 1-2y turnover; 61% free/reduced lunch — lower-income household profile, screen leases tightly.
- Market conditions: Rents soft (-1.1%/yr); 1152 active listings in the ZIP; 40 comparable units currently listed for rent nearby; rentals at typical pace (median 24d on market — plan ~3-4 weeks tenant-placement turnaround); solid renter incomes; 8,308 units permitted in Bexar County in 2024 (2,506 in 5+ unit buildings).
Forward outlook
- Local home prices are declining (-3.0%/yr); year-one equity from $2k of loan paydown is wiped out by about $7k of value loss. Plan a longer hold.
- Bexar County population projected at +50% by 2050 — long-run rental-demand tailwind backs the buy-and-hold thesis.
Negotiation context
- It's been on market 89 days — a 6% lower offer ($218k) is reasonable based on typical stale-listing flexibility.
Questions for the listing agent
- What do current leases actually rent for vs. the listed asking? Can we see a recent rent roll and the last 12 months of T-12 income?
- It's been on market 89 days. Have you received any prior offers? Is the seller open to a 12% concession, seller financing, or rate buy-down credit?
- What does the HOA fee cover, when was the last increase, and are there any pending special assessments or reserve-fund shortfalls?
- Why hasn't it sold? Are there any deal-killer items the seller is aware of (foundation, flood, title, zoning, code violations)?
- Is there a deadline driving the sale (1031 exchange, divorce, estate, relocation)? That informs how much negotiation room exists.
- Crime grade is F in this area — have there been break-ins, vandalism, or insurance claims at this property in the last 3 years? What carrier currently insures it and at what premium?
- The area grade is low — what's the realistic commute time and amenity access for the typical tenant pool here? Any planned neighborhood developments (good or bad) we should know about?
- What's the average days-on-market for RENTAL listings here right now (not sales)? A rising rental-DOM trend means longer vacancies and softer asking-rent achievability than the comps imply.
- What's the recent tenant-quality profile in this submarket — average credit score on applications, eviction rate, late-payment / NSF rate, and stable-employment percentage? A property-management company in the area should have these aggregated.
- How much new for-sale + rental construction is in the pipeline within 1–3 miles? Heavy new supply typically softens prices + rents 12–24 months out; constrained supply supports both.
Investment metrics
- 1% rule
- 0.88% ✗
- Cap rate
- 6.16%
- Cash-on-cash
- -0.48%
- DSCR
- 0.98
- GRM
- 9.5
CMA / ARV
- ARV (on-the-fly)
- $299,715
- Comps found
- 12
Show comp detail 12 sales within ~0.75 mi
| Address | Dist | Beds/Ba | Sqft | Sold | Price | $/sf | Match |
|---|---|---|---|---|---|---|---|
| 3658 Georgia Trce | 0.00mi | 4/2.5 | 1,885 (0%) | 1mo | $231,999 | $123 | 99 |
| 10735 Fairchild Way | 0.33mi | 4/2.5 | 1,900 (+1%) | 1mo | $301,536 | $159 | 83 |
| 11006 Airmen Dr | 0.16mi | 3/2.5 (-1) | 1,802 (-4%) | 0mo | $299,990 | $166 | 80 |
| 3634 Georgia Trce | 0.05mi | 4/2.0 | 1,667 (-12%) | 1mo | $223,999 | $134 | 75 |
| 11014 Tea Cv | 0.06mi | 4/2.0 | 1,667 (-12%) | 2mo | $231,999 | $139 | 75 |
| 10643 Vinateros Dr | 0.38mi | 3/2.0 (-1) | 1,851 (-2%) | 1mo | $199,000 | $108 | 72 |
| 4119 Spirit Star Dr | 0.35mi | 3/2.5 (-1) | 1,802 (-4%) | 1mo | $299,990 | $166 | 71 |
| 10803 Airmen Dr | 0.31mi | 4/2.5 | 2,072 (+10%) | 0mo | $272,850 | $132 | 69 |
| 10734 Francisco Way | 0.60mi | 3/2.5 (-1) | 2,037 (+8%) | 1mo | $294,500 | $145 | 53 |
| 10759 Francisco Way | 0.55mi | 3/2.0 (-1) | 1,690 (-10%) | 1mo | $275,000 | $163 | 49 |
| 3007 Heidfeld Ln | 0.69mi | 4/3.0 | 2,084 (+11%) | 0mo | $370,063 | $178 | 48 |
| 11130 Hollinger Cir | 0.64mi | 3/2.5 (-1) | 1,689 (-10%) | 1mo | $298,385 | $177 | 47 |
Match score weights: distance 35% · size 25% · config 20% · recency 20%. Top-matched comps best support the ARV.
Projected returns pro-forma
-3.0% appreciation · 0.0% rent growth · sell at horizon
- IRR
- -20.6%
- Equity multiple
- 0.30×
- Total profit
- $-45,177
- Equity at exit
- $34,592
- IRR
- -22.7%
- Equity multiple
- 0.01×
- Total profit
- $-64,381
- Equity at exit
- $20,059
Cash invested: $64,960 (down + closing). Projections, not guarantees.
Landlord ↔ Tenant lean methodology
- Overall (STATE)
- 87 Strongly Landlord-Friendly
- State Texas
- 87 Strongly Landlord-Friendly · R+5
- County
- — inherits STATE
- City
- — inherits STATE
ZIP-level market 78109
- Home prices YoY
- -17.8%
- Rents YoY
- -1.1%
- Active inventory
- 1152
- Price-to-rent
- 9.5×
Monthly cashflow live
- Estimated rent
- $2,042 high interval (Pro) →
- Mortgage (P&I)
- −$1,217
- Tax est. 1.5%
- −$290 /mo · $3,480/yr
- Insurance
- −$97
- HOA
- −$36
- Vacancy / Maint / Mgmt
- −$429
- Net cashflow
- $-26
Break-even live
UW: 25.0% down · 7.5% · 30yr · 1.5% tax · 5.0% vac · 8.0% maint · 8.0% mgmt
Financing live
Cash to close
- Down payment
- $58,000
- Closing costs
- $6,960
- Reserves months
- —
- Total cash needed
- —
Loan-product check · same deal, 3 products live
Conventional
25% down · 7.5% · 30yr
- Down + closing
- —
- Monthly P&I
- —
- Monthly cashflow
- —
- DSCR
- —
- Eligible?
- —
Personal DTI + credit; lowest rate.
DSCR
20% down · 8.5% · 30yr
- Down + closing
- —
- Monthly P&I
- —
- Monthly cashflow
- —
- DSCR
- —
- Eligible?
- —
No personal income docs; deal must DSCR.
Hard money
10% down · 12.0% · 12mo
- Down + closing
- —
- Monthly P&I
- —
- Monthly cashflow
- —
- DSCR
- —
- Eligible?
- —
Short-term bridge; refi at stabilization.
Rent comps 40 comps
| Address | Beds | Baths | Sqft | Rent | $/sqft | DOM | Units | Dist |
|---|---|---|---|---|---|---|---|---|
| 4326 Admirals Bnd Converse, TX | 4.0 | 3.0 | 2391 | $2,350 | $0.98 | 43d | 1 | 0.07mi |
| 4250 Admirals Bnd Converse, TX | 4.0 | 2.0 | 1602 | $1,699 | $1.06 | 23d | 1 | 0.08mi |
| 4303 Brigade Bnd Converse, TX | 4.0 | 2.5 | 2179 | $2,200 | $1.01 | 43d | 1 | 0.16mi |
| 10922 Lockheed Dr Converse, TX | 4.0 | 2.5 | 2179 | $1,995 | $0.92 | 16d | 1 | 0.16mi |
| 10906 Airmen Dr Converse, TX | 3.0 | 2.0 | 1535 | $1,550 | $1.01 | 2d | 1 | 0.18mi |
| 4150 Admirals Bnd Converse, TX | 4.0 | 2.0 | 1602 | $1,750 | $1.09 | 4d | 1 | 0.19mi |
| 11038 Airmen Dr Converse, TX | 4.0 | 2.5 | 2096 | $2,250 | $1.07 | 4d | 1 | 0.22mi |
| 10827 Fox Trot Converse, TX | 3.0 | 2.0 | 1650 | $1,645 | $1.00 | 20d | 1 | 0.24mi |
| 10818 Fox Trot Converse, TX | 3.0 | 2.0 | 1465 | $1,850 | $1.26 | 4d | 1 | 0.26mi |
| 10723 Vinateros Dr Converse, TX | 4.0 | 2.0 | 1667 | $1,776 | $1.07 | 43d | 1 | 0.36mi |
| 3158 Jackson Smt Converse, TX | 4.0 | 2.5 | 2205 | $1,895 | $0.86 | 2d | 1 | 0.42mi |
| 10627 Erinita Way Converse, TX | 3.0 | 2.0 | 1474 | $1,466 | $0.99 | 23d | 1 | 0.45mi |
| 3130 Jackson Smt Converse, TX | 3.0 | 2.5 | 1428 | $1,885 | $1.32 | 4d | 1 | 0.48mi |
| 10679 Penelope Way Converse, TX | 4.0 | 2.5 | 2455 | $2,000 | $0.81 | 43d | 1 | 0.50mi |
| 3103 Jackson Smt Converse, TX | 5.0 | 2.5 | 2543 | $2,000 | $0.79 | 43d | 1 | 0.54mi |
| 10606 Pablo Way Converse, TX | 4.0 | 2.0 | 1667 | $1,736 | $1.04 | 4d | 1 | 0.54mi |
| 10583 Pablo Way Converse, TX | 4.0 | 2.5 | 2601 | $2,200 | $0.85 | 23d | 1 | 0.55mi |
| 3055 Jackson Smt Converse, TX | 3.0 | 2.0 | 1525 | $1,595 | $1.05 | 43d | 1 | 0.56mi |
| 10902 Chatham Ct Converse, TX | 5.0 | 2.5 | 2543 | $2,195 | $0.86 | 43d | 1 | 0.58mi |
| 10819 Juliette Pass Converse, TX | 4.0 | 2.5 | 2204 | $1,745 | $0.79 | 43d | 1 | 0.58mi |
| 10754 Francisco Way Converse, TX | 3.0 | 2.0 | 1971 | $1,875 | $0.95 | 23d | 1 | 0.59mi |
| 10922 Chatham Ct Converse, TX | 3.0 | 2.0 | 1525 | $1,645 | $1.08 | 23d | 1 | 0.61mi |
| 3026 Jackson Smt Converse, TX | 4.0 | 2.5 | 2204 | $1,745 | $0.79 | 43d | 1 | 0.62mi |
| 11019 Chatham Ct Converse, TX | 3.0 | 2.5 | 1428 | $1,425 | $1.00 | 43d | 1 | 0.62mi |
| 10739 Rosalina Loop Converse, TX | 3.0 | 2.0 | 1994 | $2,100 | $1.05 | 2d | 1 | 0.63mi |
| 11130 Hollinger Cir Converse, TX | 3.0 | 2.5 | 1709 | $1,950 | $1.14 | 21d | 1 | 0.64mi |
| 11130 Hollinger Cir Converse, TX | 3.0 | 2.5 | 1689 | $1,950 | $1.15 | 2d | 1 | 0.64mi |
| 11151 Hollinger Cir Converse, TX | 4.0 | 2.5 | 1859 | $1,705 | $0.92 | 23d | 1 | 0.64mi |
| 4351 W Vasquez Cir Converse, TX | 3.0 | 2.0 | 1652 | $1,850 | $1.12 | 20d | 1 | 0.65mi |
| 3006 Jackson Smt Converse, TX | 5.0 | 2.5 | 2543 | $2,095 | $0.82 | 23d | 1 | 0.66mi |
| 2943 Forsyth Cyn Converse, TX | 4.0 | 2.5 | 2203 | $1,795 | $0.81 | 23d | 1 | 0.67mi |
| 11038 Chatham Ct Converse, TX | 4.0 | 2.5 | 2205 | $1,995 | $0.90 | 12d | 1 | 0.67mi |
| 4331 W Vasquez Cir Converse, TX | 4.0 | 2.0 | 1925 | $1,800 | $0.94 | 17d | 1 | 0.68mi |
| 11002 Eyelet Hbr Converse, TX | 4.0 | 2.5 | 2204 | $1,745 | $0.79 | 43d | 1 | 0.68mi |
| 10930 Juliette Pass Converse, TX | 4.0 | 2.5 | 2205 | $1,850 | $0.84 | 2d | 1 | 0.69mi |
| 3106 Drayton Ests Converse, TX | 2.0–5.0 | 2.0–3.5 | 1733 | $2,293 | $1.32 | 1d | 1 | 0.69mi |
| 11010 Eyelet Hbr Converse, TX | 5.0 | 2.5 | 2543 | $2,200 | $0.87 | 3d | 1 | 0.69mi |
| 2942 Jackson Smt Converse, TX | 4.0 | 2.5 | 2204 | $1,745 | $0.79 | 43d | 1 | 0.70mi |
| 2934 Jackson Smt Converse, TX | 4.0 | 2.5 | 2204 | $2,070 | $0.94 | 43d | 1 | 0.72mi |
| 2935 Jackson Smt Converse, TX | 5.0 | 2.5 | 2543 | $2,200 | $0.87 | 23d | 1 | 0.72mi |
HOA detail
- Monthly dues
- $36 · $432/yr
Listing history 7 events
-
2026-04-18status Pending
-
2026-04-09price $231,999
-
2026-04-03price $232,999
-
2026-03-31price $234,999
-
2026-03-18price $252,999
-
2026-03-12price $234,999
-
2026-01-19$252,999 New
ⓘ Source: listings_history table (triggers on properties + properties_extension) + one-shot
backfill from property_details.listing_events for pre-trigger history.
Nearby sold comps map
Loading sold comps map…
Walkable amenities ~0.75 mi
Loading nearby amenities…
Taxation est. · year 1
- Rental income
- $24,507
- − Mortgage interest
- −$12,996
- − Property taxes
- −$3,480
- − Insurance
- −$1,160
- − Repairs & maintenance
- −$1,961
- − Management
- −$1,961
- − HOA
- −$432
- − Depreciation
- −$6,749
- Taxable loss
- −$4,231
- Est. tax savings @ 24.0%
- +$1,015
- After-tax cash flow
- $704/yr
For passive investors: Depreciation is non-cash, so a rental often shows a tax loss while cash-flowing — sheltering income. Rental losses are passive: they offset passive income freely, and up to $25,000/yr can offset ordinary (W-2) income if you actively participate and your MAGI is under $100k (phasing out to $0 by $150k); unused losses carry forward. On sale, claimed depreciation is recaptured at up to 25%, and gains may owe capital-gains tax (a 1031 exchange can defer both). Figures are a year-1 estimate at your 24.0% rate — not tax advice; consult a CPA.
Schools (NCES district)
- District
- East Central ISD
- NCES district ID
- 4817850
- Math proficiency
- 16% ▼ -12.00%
- Reading proficiency
- 25% ▼ -6.00%
- Median HH income
- $53,941
- Composite
- 18.67/100
- National rank
- #8887
- State rank
- #758 of 826 in TX
Livability — San Antonio
- Score
- 80/100
- State rank
- #31
- US rank
- #1616
Category grades
Schools grade is shown separately in the Schools card above.
Census & demographics
- Census place
- San Antonio, TX
- County
- Bexar County · 1,990,555 people
- City population
- 1,806,925
- Metro
- San Antonio-New Braunfels, TX
- Population (ZIP)
- 63,067
- Household income
- $91,320
- Rent vs Own
- Severe rent burden
- 1732.0
Population outlook (Bexar County) Hauer SSP2
- Today (2025)
- 2,336,851 people
- By 2030
- 2,560,728 · +9.6%
- By 2040
- 3,020,569 · +29.3%
- By 2050
- 3,493,522 · +49.5%
- By 2075
- 4,668,459 · +99.8%
- By 2100
- 5,533,242 · +136.8%
Race, ethnicity, and origin ACS 2023
- Neighborhood character
- Diverse neighborhood (Simpson 0.69)
- Race & ethnicity
- Hispanic / Latino 44% White 27% Two or more races 21% Black 21% Asian 3%
- Hispanic origin (detail)
- Mexican 29% Puerto Rican 4%
- Common ancestry
- Lithuanian 1% Romanian 1% Italian 1%
- Foreign-born
- 11% · Canada, Vietnam, South Korea
- Languages at home
- 71% English-only · Spanish 23% Tagalog/Filipino 1% Other Asian/Pacific 1%
Political lean MEDSL · Bexar
- 2024 margin
- Lean D (+9.8) · D 54.3% · R 44.6% · Other 1.1%
- 2008→2024 swing
- +4.2pp toward D · 2008: 5.6pp · 2024: 9.8pp
- All cycles
- 2024: D+9.8 2020: D+18.2 2016: D+13.5 2012: D+4.6 2008: D+5.6
Not yet ingested
- Civics
- —
Market trends
- HPI YoY
- ▼ -51.02%
- Current HPI
- 236.4923
- Rent YoY
- ▼ -1.08%
- Metro
- San Antonio-New Braunfels, TX
- State GDP YoY
- ▲ 3.95%
- F500 in state
- 110
Industry mix (Fortune 500 HQ in TX)
| Industry | F500 HQs | Revenue |
|---|---|---|
| Energy | 16 | $1,198B |
|
||
| Technology | 5 | $198B |
|
||
| Engineering / Construction | 4 | $72B |
|
||
| Energy Services | 3 | $60B |
|
||
| Utilities | 3 | $41B |
|
||
| Healthcare | 2 | $330B |
|
||
Price history
-8.3% since first listed7 events — show timeline
- 2026-04-18 Pending — LERA
- 2026-04-09 Price Changed $231,999 LERA
- 2026-04-03 Price Changed $232,999 LERA
- 2026-03-31 Price Changed $234,999 LERA
- 2026-03-18 Price Changed $252,999 LERA
- 2026-03-12 Price Changed $234,999 LERA
- 2026-01-19 Listed $252,999 LERA
Cash-flow waterfall
monthlySold comps — $/sqft
last 12 mo · ≤1 miLoading sold comps…