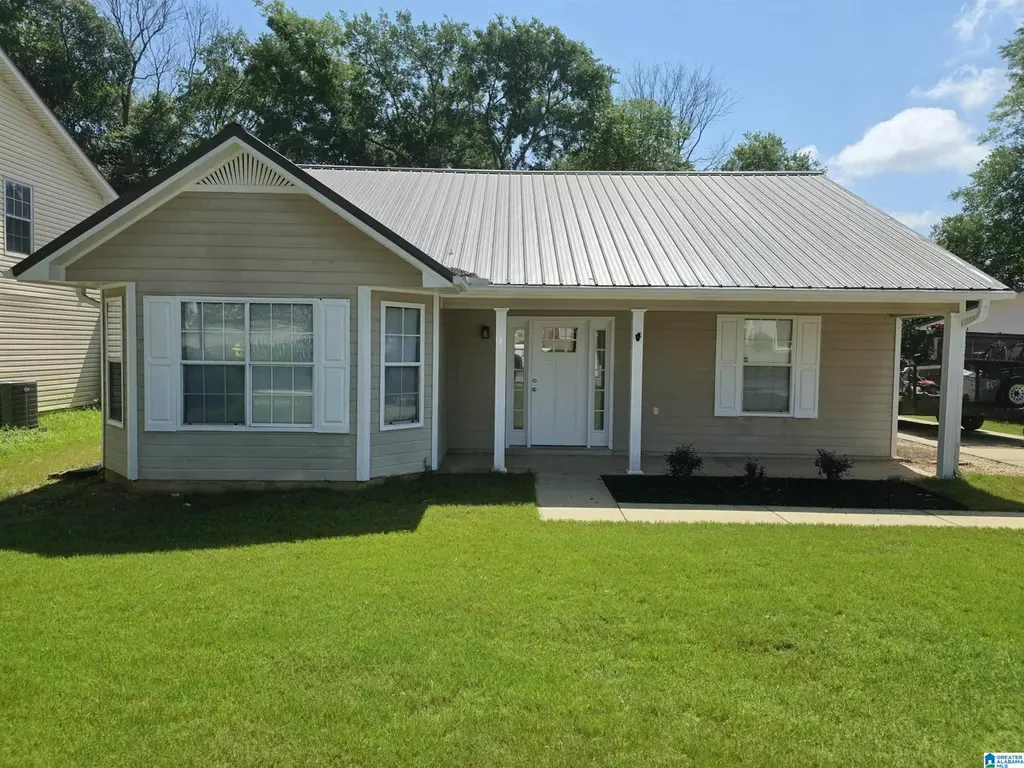
134 Park Place Ln · Alabaster, AL
Flood risk 1/10 · Minimal
- FEMA flood zone
- X (unshaded)
- Chance of flooding over 30 yrs
- 0.0%
- Est. flood insurance / yr
- $507 – $1,088
Fire risk 4/10 · Minor
- Est. fire insurance / yr
- $916 – $1,700
Heat risk 7/10 · Major
- Hot days now (above 106°F)
- 7 days/yr
- Hot days in 30 yrs
- 21 days/yr
Wind risk 6/10 · Moderate
- Chance of severe wind over 30 yrs
- 59.0%
Air-quality risk 2/10 · Minimal
- Unhealthy air days now
- 2 days/yr
- Unhealthy air days in 30 yrs
- 2 days/yr
Risk factors via First Street. Map © Google.
Why this score? — see what drove the D- grade
The composite is a weighted blend of 9 inputs, each scored 0–100. Each bar is that input's sub-score; the figure is the points it added to the 100-point composite (weight × sub-score).
- Cash flow +14.3/30.0
- ARV discount +4.5/15.0
- DSCR +4.4/10.0
- Schools +3.9/10.0
- Livability +3.8/5.0
- Rent growth +3.0/5.0
- 1% rule +2.8/10.0
- Condition / age +2.5/5.0
- Appreciation +0.0/10.0
$234,900
🖨 Deal sheet (PDF) 📄 Offer letter ✓ Due diligence
Listing remarks
Conveniently located in the heart of Alabaster, this beautifully updated 3-bedroom, 2-bath home is move-in ready! Recent improvements include new luxury vinyl plank flooring throughout, fresh paint, and all-new stainless steel appliances. Vaulted ceilings create a spacious, open feel, while the screened patio provides the perfect place to relax and enjoy the outdoors. The durable metal roof offers added peace of mind and low-maintenance living. Conveniently located near shopping, dining, schools, parks, and everything Alabaster has to offer, this home is ready to welcome its next owners. Don't miss your chance to make it your next Home Sweet Home!
Key facts
- 9,147 sq ft lot
- Built 1994
- Listed 16 days
Property features AI
Finance
- Other: Lot size approximately 0.21 acres; No flood plain; No pool; Not a log home; Subdivision: Park Place
Exterior
- Parking: Driveway parking
- Utilities: Public water; Connected sewer; Underground utilities; Electric water heater; Internet service available
- Home design: Single-family residence (existing); Slab foundation; Siding: Hardiplank
- Construction: Hardiplank siding
- Exterior features: Screened porch; Screened patio; Patio
Interior
- Kitchen: Laminate countertops; Electric cooktop; Electric oven; Built-in microwave; Built-in dishwasher; Refrigerator
- Bedrooms: Master bedroom (main level); Two additional bedrooms (main level); Walk-in closets
- Flooring: Vinyl flooring
- Bathrooms: Two full bathrooms; Tub/shower combination
- Heating & cooling: Central heating; Central air conditioning
- Interior features: Cathedral/vaulted and trey ceilings; Brick wood-burning fireplace in the living room; Attic with pull-down access; Some stainless steel appliances
- Laundry & utility: Main-level laundry room; Washer hookup; Electric dryer hookup
Neighborhood map
What this means for you Summary
Snapshot
- This is a 3-bed/2.0-bath single-family listed at $235k.
Deal economics
- At list price, monthly cash flow is $44 ($529/yr) — positive.
- The deal already cash-flows at list — no discount required.
- To meet the 1% rule (rent ≥ 1% of price), the offer needs to be $184k (21.5% below list).
- Recommended offer: $184k (21.5% below list) — sets the bar for 1% rule.
- Cap rate 6.5% vs local median 4.1% in Alabaster — top-decile yield for the area; either an underpriced asset or a hidden risk that comps aren't pricing in. Stress-test before assuming the spread holds.
Location & tenants
- Location reads 76/100 on livability (#14 in AL, #3,512 nationally) — a middle-class / working-renter tenant base. Strengths: employment A+, cost of living A+, housing A+; Watch: amenities D-, commute F, health & safety F.
- Alabaster City (suburban): math 30% / reading 57% proficiency, ranked #17 of 129 in AL (top 13%) — families likely to look elsewhere, expect single-tenant / working-renter base with shorter leases.
- Zoned schools: Creek View Elementary School (math 56% / reading 71%, grade B, #46 of 627 statewide, top 8%, 946 students, 48% FRL); Thompson Middle School (math 24% / reading 57%, grade F, #56 of 257 statewide, top 22%, 1,434 students, 51% FRL); Thompson High School (math 34% / reading 38%, grade F, #43 of 305 statewide, top 14%, 2,203 students, 48% FRL) — zoned schools average 49% FRL vs 31% district-wide (18 pts higher); higher-poverty schools than district average — tighter screening recommended.
- Market conditions: Rents rising (+2.2%/yr); 226 active listings in the ZIP; 3 comparable units currently listed for rent nearby; rentals at typical pace (median 26d on market — plan ~3-4 weeks tenant-placement turnaround); solid renter incomes; 987 units permitted in Shelby County in 2024 (0 in 5+ unit buildings).
Forward outlook
- Local home prices are declining (-3.0%/yr); year-one equity from $2k of loan paydown is wiped out by about $7k of value loss. Plan a longer hold.
- Shelby County population projected at +23% by 2050 — long-run rental-demand tailwind backs the buy-and-hold thesis.
Negotiation context
- It's been on market 16 days — a 2% lower offer ($231k) is reasonable based on typical stale-listing flexibility.
- Current owner paid $120k; list at $235k implies a 96% gain — meaningful room to come down on a strong offer.
Risks & watch-outs
- Climate carrying-cost: major wind risk, 59% chance of damaging wind over 30y; extreme-heat days projected 7→21/yr by 2055 (HVAC capex compounding) — expect insurance premiums to compound above CPI over the hold.
Questions for the listing agent
- Is there a deadline driving the sale (1031 exchange, divorce, estate, relocation)? That informs how much negotiation room exists.
- Schools are B-rated — typically a magnet for longer-tenancy family renters. What's the average tenant stay here, and is there a school-zone premium baked into asking?
- The area grade is low — what's the realistic commute time and amenity access for the typical tenant pool here? Any planned neighborhood developments (good or bad) we should know about?
- What's the average days-on-market for RENTAL listings here right now (not sales)? A rising rental-DOM trend means longer vacancies and softer asking-rent achievability than the comps imply.
- What's the recent tenant-quality profile in this submarket — average credit score on applications, eviction rate, late-payment / NSF rate, and stable-employment percentage? A property-management company in the area should have these aggregated.
- How much new for-sale + rental construction is in the pipeline within 1–3 miles? Heavy new supply typically softens prices + rents 12–24 months out; constrained supply supports both.
Investment metrics
- 1% rule
- 0.78% ✗
- Cap rate
- 6.52%
- Cash-on-cash
- 0.80%
- DSCR
- 1.04
- GRM
- 10.6
CMA / ARV
- ARV (on-the-fly)
- $220,176
- Comps found
- 12
Show comp detail 12 sales within ~0.75 mi
| Address | Dist | Beds/Ba | Sqft | Sold | Price | $/sf | Match |
|---|---|---|---|---|---|---|---|
| 541 Warrior Dr | 0.25mi | 3/2.0 | 1,234 (-1%) | 3mo | $235,000 | $190 | 84 |
| 200 Wild Flower Trl | 0.24mi | 3/2.0 | 1,249 (-0%) | 12mo | $220,000 | $176 | 79 |
| 121 Park Place Way | 0.16mi | 3/2.0 | 1,280 (+2%) | 12mo | $237,000 | $185 | 78 |
| 144 Buck Creek Dr | 0.23mi | 3/2.0 | 1,249 (-0%) | 14mo | $219,000 | $175 | 77 |
| 101 Park Place Way | 0.17mi | 3/2.0 | 1,209 (-3%) | 14mo | $245,000 | $203 | 75 |
| 224 Park Place Way | 0.22mi | 3/2.0 | 1,210 (-3%) | 12mo | $218,090 | $180 | 74 |
| 196 Jasmine Dr | 0.46mi | 3/2.0 | 1,195 (-4%) | 4mo | $220,000 | $184 | 68 |
| 240 Jasmine Dr | 0.38mi | 3/2.0 | 1,166 (-7%) | 6mo | $203,000 | $174 | 66 |
| 204 Wild Flower Trl | 0.25mi | 3/2.0 | 1,362 (+9%) | 13mo | $214,900 | $158 | 63 |
| 533 Warrior Dr | 0.24mi | 3/2.0 | 1,400 (+12%) | 14mo | $242,500 | $173 | 57 |
| 226 Jasmine Dr | 0.42mi | 3/2.0 | 1,354 (+8%) | 12mo | $228,000 | $168 | 57 |
| 218 Buck Creek Cir | 0.29mi | 3/2.0 | 1,438 (+15%) | 8mo | $240,000 | $167 | 55 |
Match score weights: distance 35% · size 25% · config 20% · recency 20%. Top-matched comps best support the ARV.
Projected returns pro-forma
-3.0% appreciation · 2.16% rent growth · sell at horizon
- IRR
- -15.9%
- Equity multiple
- 0.44×
- Total profit
- $-36,902
- Equity at exit
- $35,024
- IRR
- -8.9%
- Equity multiple
- 0.47×
- Total profit
- $-35,165
- Equity at exit
- $20,310
Cash invested: $65,772 (down + closing). Projections, not guarantees.
Landlord ↔ Tenant lean methodology
- Overall (STATE)
- 90 Strongly Landlord-Friendly
- State Alabama
- 90 Strongly Landlord-Friendly · R+15
- County
- — inherits STATE
- City
- — inherits STATE
ZIP-level market 35007
- Home prices YoY
- -35.0%
- Rents YoY
- 2.2%
- Active inventory
- 226
- Price-to-rent
- 10.6×
Monthly cashflow live
- Estimated rent
- $1,844 medium interval (Pro) →
- Mortgage (P&I)
- −$1,232
- Tax from tax record
- −$83 /mo · $994/yr
- Insurance
- −$98
- HOA
- −$0
- Vacancy / Maint / Mgmt
- −$387
- Net cashflow
- $44
Break-even live
Sensitivity live
| Price | -10% $177 | -5% $111 | +0% $44 | +5% $-22 | +10% $-89 |
|---|---|---|---|---|---|
| Rent | -10% $-102 | -5% $-29 | +0% $44 | +5% $117 | +10% $190 |
| Rate | -1.0pp $162 | -0.5pp $104 | base $44 | +0.5pp $-17 | +1.0pp $-79 |
UW: 25.0% down · 7.5% · 30yr · 1.5% tax · 5.0% vac · 8.0% maint · 8.0% mgmt
Financing live
Cash to close
- Down payment
- $58,725
- Closing costs
- $7,047
- Reserves months
- —
- Total cash needed
- —
Loan-product check · same deal, 3 products live
Conventional
25% down · 7.5% · 30yr
- Down + closing
- —
- Monthly P&I
- —
- Monthly cashflow
- —
- DSCR
- —
- Eligible?
- —
Personal DTI + credit; lowest rate.
DSCR
20% down · 8.5% · 30yr
- Down + closing
- —
- Monthly P&I
- —
- Monthly cashflow
- —
- DSCR
- —
- Eligible?
- —
No personal income docs; deal must DSCR.
Hard money
10% down · 12.0% · 12mo
- Down + closing
- —
- Monthly P&I
- —
- Monthly cashflow
- —
- DSCR
- —
- Eligible?
- —
Short-term bridge; refi at stabilization.
Rent comps 3 comps
| Address | Beds | Baths | Sqft | Rent | $/sqft | DOM | Units | Dist |
|---|---|---|---|---|---|---|---|---|
| 213 Park Place Way Alabaster, AL | 3.0 | 2.0 | 1223 | $1,681 | $1.37 | 25d | 1 | 0.15mi |
| 1090 Thompson Rd Alabaster, AL | 3.0 | 2.5 | 1615 | $1,600 | $0.99 | 45d | 1 | 0.44mi |
| 203 Winterhaven Dr Alabaster, AL | 3.0 | 2.0 | 1431 | $1,550 | $1.08 | 5d | 1 | 1.14mi |
Listing history 12 events
-
2026-06-21days on market $234,900 Active 16 DOM
-
2026-06-18days on market $234,900 Active 13 DOM
-
2026-06-17days on market $234,900 Active 12 DOM
-
2026-06-16days on market $234,900 Active 11 DOM
-
2026-06-15days on market $234,900 Active 10 DOM
-
2026-06-13days on market $234,900 Active 8 DOM
-
2026-06-10days on market $234,900 Active 5 DOM
-
2026-06-09days on market $234,900 Active 4 DOM
-
2026-06-08days on market $234,900 Active 3 DOM
-
2026-06-07statusdays on market $234,900 Active 2 DOM
-
2026-06-02remarks 655-char remark
-
2026-06-02$234,900 Coming Soon 1 DOM
ⓘ Source: listings_history table (triggers on properties + properties_extension) + one-shot
backfill from property_details.listing_events for pre-trigger history.
Tax reassessment forecast AL · Resets to sale price
- Current annual tax
- $994 · $83/mo
- Projected year-2 tax
- $994 · $83/mo
- Expected delta
- $0/yr ($0/mo · 0.0%)
ⓘ Screening estimate from a state-policy table — verify with the county assessor before closing.
Climate risk First Street
- Flood 1/10 Low FEMA zone X (unshaded) · 0% chance over 30 yrs
- Wildfire 4/10 Moderate
- Heat 7/10 Severe 7 d/yr ≥106°F today · 21 d/yr by 30 yrs out
- Wind 6/10 Major 59% chance of damaging wind over 30 yrs
- Air quality 2/10 Low 2 unhealthy d/yr today · 2 by 30 yrs out
Nearby sold comps map
Loading sold comps map…
Walkable amenities ~0.75 mi
Loading nearby amenities…
Taxation est. · year 1
- Rental income
- $22,126
- − Mortgage interest
- −$13,158
- − Property taxes
- −$994
- − Insurance
- −$1,174
- − Repairs & maintenance
- −$1,770
- − Management
- −$1,770
- − Depreciation
- −$6,833
- Taxable loss
- −$3,574
- Est. tax savings @ 24.0%
- +$858
- After-tax cash flow
- $1,387/yr
For passive investors: Depreciation is non-cash, so a rental often shows a tax loss while cash-flowing — sheltering income. Rental losses are passive: they offset passive income freely, and up to $25,000/yr can offset ordinary (W-2) income if you actively participate and your MAGI is under $100k (phasing out to $0 by $150k); unused losses carry forward. On sale, claimed depreciation is recaptured at up to 25%, and gains may owe capital-gains tax (a 1031 exchange can defer both). Figures are a year-1 estimate at your 24.0% rate — not tax advice; consult a CPA.
Schools (NCES district)
- District
- Alabaster City
- NCES district ID
- 0100190
- Math proficiency
- 30% ▼ -27.00%
- Reading proficiency
- 57% ▲ 5.00%
- Median HH income
- $68,690
- Composite
- 39.07/100
- National rank
- #4052
- State rank
- #17 of 129 in AL
Livability — Alabaster
- Score
- 76/100
- State rank
- #14
- US rank
- #3512
Category grades
Schools grade is shown separately in the Schools card above.
Census & demographics
- Census place
- Alabaster, AL
- County
- Shelby County · 188,970 people
- City population
- 28,586
- Metro
- Birmingham-Hoover, AL
- Population (ZIP)
- 28,586
- Household income
- $88,505
- Rent vs Own
- Severe rent burden
- 325.0
Population outlook (Shelby County) Hauer SSP2
- Today (2025)
- 237,024 people
- By 2030
- 249,868 · +5.4%
- By 2040
- 272,778 · +15.1%
- By 2050
- 291,062 · +22.8%
- By 2075
- 326,049 · +37.6%
- By 2100
- 335,870 · +41.7%
Race, ethnicity, and origin ACS 2023
- Neighborhood character
- Predominantly White (69%)
- Race & ethnicity
- White 69% Black 14% Hispanic / Latino 13% Two or more races 6% Asian 2%
- Hispanic origin (detail)
- Mexican 6% Cuban 1%
- Common ancestry
- Italian 3% Serbian 2% Lithuanian 1%
- Foreign-born
- 6% · Canada, China
- Languages at home
- 90% English-only · Spanish 8% Chinese 1%
Political lean MEDSL · Shelby
- 2024 margin
- Solid R (+40.9) · D 29.0% · R 69.9% · Other 1.1%
- 2008→2024 swing
- +12.6pp toward D · 2008: -53.4pp · 2024: -40.9pp
- All cycles
- 2024: R+40.9 2020: R+40.4 2016: R+50.3 2012: R+55.6 2008: R+53.4
Not yet ingested
- Civics
- —
Market trends
- HPI YoY
- ▼ -113.63%
- Current HPI
- 211.0691
- Rent YoY
- ▲ 2.16%
- Metro
- Birmingham-Hoover, AL
- State GDP YoY
- ▲ 2.94%
- F500 in state
- 4
Industry mix (Fortune 500 HQ in AL)
| Industry | F500 HQs | Revenue |
|---|---|---|
| Financial Services | 1 | $8B |
|
||
| Healthcare | 1 | $5B |
|
||
Price history
+104.4% since first listed3 events — show timeline
- 2026-06-02 Coming Soon $234,900 Greater Alabama MLS
- 2026-05-20 Sold (Public Records) $120,000 Public Records
- 2004-07-19 Sold (Public Records) $114,900 Public Records
Property tax history
+4.8%/yrLatest (2025): $994 · +1.9% YoY. Source: county tax records.
Cash-flow waterfall
monthlySold comps — $/sqft
last 12 mo · ≤1 miLoading sold comps…