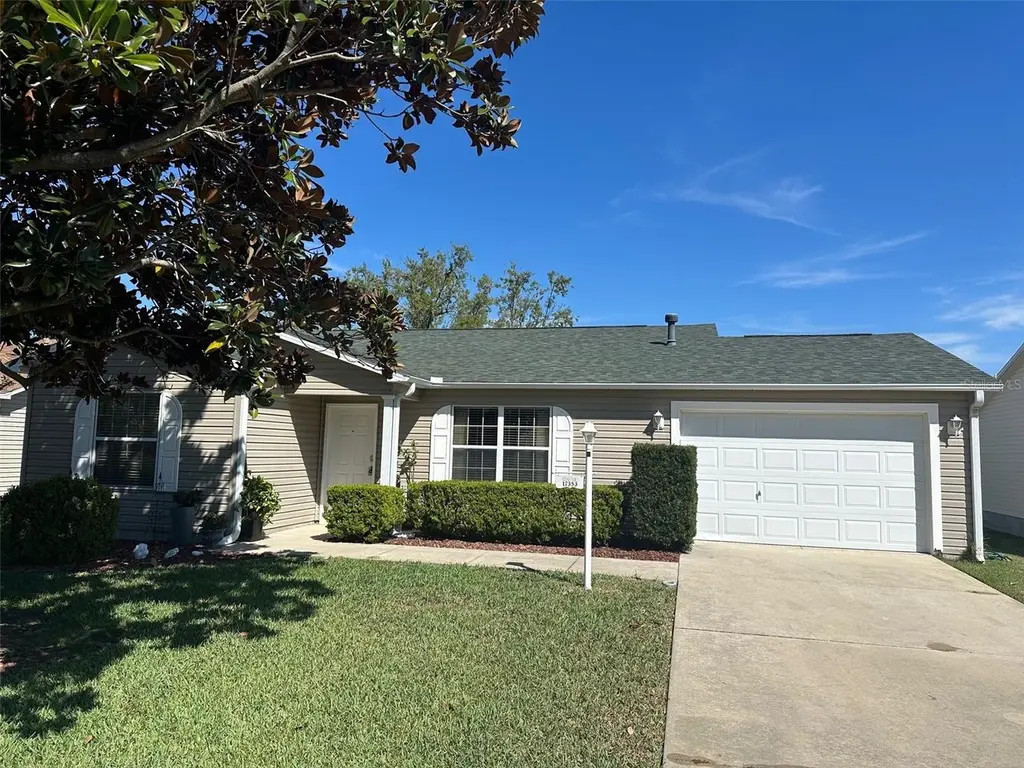
17353 SE 76th Flintlock Ter · The Villages, FL
Flood risk 1/10 · Minimal
- FEMA flood zone
- X (unshaded)
- Chance of flooding over 30 yrs
- 0.0%
- Est. flood insurance / yr
- $507 – $1,088
Fire risk 4/10 · Minor
- Est. fire insurance / yr
- $947 – $1,759
Heat risk 9/10 · Severe
- Hot days now (above 109°F)
- 7 days/yr
- Hot days in 30 yrs
- 21 days/yr
Wind risk 9/10 · Severe
- Chance of severe wind over 30 yrs
- 99.0%
Air-quality risk 3/10 · Minor
- Unhealthy air days now
- 2 days/yr
- Unhealthy air days in 30 yrs
- 2 days/yr
Risk factors via First Street. Map © Google.
Why this score? — see what drove the B- grade
The composite is a weighted blend of 9 inputs, each scored 0–100. Each bar is that input's sub-score; the figure is the points it added to the 100-point composite (weight × sub-score).
- Cash flow +25.3/30.0
- ARV discount +12.6/15.0
- DSCR +8.3/10.0
- 1% rule +7.8/10.0
- Schools +3.6/10.0
- Rent growth +3.5/5.0
- Livability +3.5/5.0
- Condition / age +2.5/5.0
- Appreciation +0.0/10.0
$284,900
🖨 Deal sheet 📄 Offer letter ✓ Due diligence
Listing remarks MLS
Must see this 2 bedroom, 2 full bath and 1.5 car garage Austin model located in the Village of Chatham. Conveniently located near the Publix shopping center & VA clinic off CR 42. Close to the newer First Responders Recreational Center & Nancy Lopez Country Club. Newer roof (2020), newer furnace & AC (2023), newer tankless gas water heater, newer washer & dryer, gutters & downspouts + large elevated back porch (18x13). Open floor plan concept w/ volume ceilings, ceramic tile & luxury vinyl flooring (no carpet) & knockdown ceiling texture. Updated kitchen w/ additional cabinets, pull-out drawers, Stainless Steel appliances, gas convection oven/range, newer refrigerator & Bosch dishwasher. Additional, oversized Florida Room (19x12). Large Master Bedroom w/ walk-in closet & master bathroom w/ walk-in shower. Low bond balance of $1782. Call today for your personal tour of this wonderful home.
Key facts
- Newer ac
- Village of chatham
- Newer furnace
Tags
Neighborhood map
What this means for you Summary
Snapshot
- This is a 2-bed/2.0-bath single-family listed at $285k.
Deal economics
- At list price, monthly cash flow is $643 ($8k/yr) — positive.
- The deal already cash-flows at list — no discount required.
- Meets the 1% rule at list price ($4k rent vs $285k).
- Recommended offer: $259k (9.0% below list) — sets the bar for market timing.
- Cap rate 9.0% vs local median 5.0% in The Villages — top-decile yield for the area; either an underpriced asset or a hidden risk that comps aren't pricing in. Stress-test before assuming the spread holds.
Location & tenants
- Location reads 70/100 on livability (#431 in FL) — a middle-class / working-renter tenant base. Strengths: schools A+, crime A+, housing A; Watch: amenities F, commute F, health & safety F.
- Marion (rural): math 42% / reading 43% proficiency, ranked #61 of 73 in FL (top 84%) — families likely to look elsewhere, expect single-tenant / working-renter base with shorter leases; 61% free/reduced lunch — lower-income household profile, screen leases tightly.
- Market conditions: Rents rising (+3.9%/yr); 550 active listings in the ZIP; 5 comparable units currently listed for rent nearby; rentals at typical pace (median 21d on market — plan ~3-4 weeks tenant-placement turnaround); 7,071 units permitted in Marion County in 2024 (534 in 5+ unit buildings).
- At $3,634/mo this rent would consume 59% of the median local household income ($74k/yr) (locally 987% of renters already pay >50% of income on rent) — very limited rent-growth headroom before tenants either downsize or default.
Forward outlook
- Local home prices are declining (-3.0%/yr); year-one equity from $2k of loan paydown is wiped out by about $9k of value loss. Plan a longer hold.
- Marion County population projected at +13% by 2050 — modest demand growth; plan on rents tracking national, not racing it.
- At projected returns (-3.0% appreciation + 3.9% rent growth), your $80k cash investment doubles in ~10 years — after that, you're playing with house money.
Negotiation context
- It's been on market 92 days — a 9% lower offer ($259k) is reasonable based on typical stale-listing flexibility.
- 7 sale attempts since 4y ago with the ask held roughly flat each time — persistent listings suggest the price (not the market) is what's stuck; bring a comps-based counter.
Risks & watch-outs
- Climate carrying-cost: severe wind risk, 99% chance of damaging wind over 30y; extreme-heat days projected 7→21/yr by 2055 (HVAC capex compounding) — expect insurance premiums to compound above CPI over the hold.
Questions for the listing agent
- It's been on market 92 days. Have you received any prior offers? Is the seller open to a 9% concession, seller financing, or rate buy-down credit?
- What does the HOA fee cover, when was the last increase, and are there any pending special assessments or reserve-fund shortfalls?
- Why hasn't it sold? Are there any deal-killer items the seller is aware of (foundation, flood, title, zoning, code violations)?
- Is there a deadline driving the sale (1031 exchange, divorce, estate, relocation)? That informs how much negotiation room exists.
- Schools are A-rated — typically a magnet for longer-tenancy family renters. What's the average tenant stay here, and is there a school-zone premium baked into asking?
- What's the average days-on-market for RENTAL listings here right now (not sales)? A rising rental-DOM trend means longer vacancies and softer asking-rent achievability than the comps imply.
- What's the recent tenant-quality profile in this submarket — average credit score on applications, eviction rate, late-payment / NSF rate, and stable-employment percentage? A property-management company in the area should have these aggregated.
- How much new for-sale + rental construction is in the pipeline within 1–3 miles? Heavy new supply typically softens prices + rents 12–24 months out; constrained supply supports both.
Investment metrics
- 1% rule
- 1.28% ✓
- Cap rate
- 9.00%
- Cash-on-cash
- 9.68%
- DSCR
- 1.43
- GRM
- 6.5
CMA / ARV
- ARV (median comp)
- $321,041
- List price
- $284,900
- Delta
- -11.26%
- Verdict
- UNDERPRICED
- Comps
- 20 within 1.0 mi
Show comp detail 12 sales within ~0.75 mi
| Address | Dist | Beds/Ba | Sqft | Sold | Price | $/sf | Match |
|---|---|---|---|---|---|---|---|
| 8076 SE 174th Belhaven Loop | 0.40mi | 2/2.0 | 1,383 (-0%) | 10mo | $275,000 | $199 | 72 |
| 17107 SE 78th Parlange Ter | 0.32mi | 3/2.0 (+1) | 1,359 (-2%) | 6mo | $385,000 | $283 | 72 |
| 17400 SE 77th Sycamore Ave | 0.04mi | 2/2.0 | 1,198 (-14%) | 8mo | $239,000 | $199 | 69 |
| 17640 SE 81st Timberwood Ter | 0.53mi | 3/2.0 (+1) | 1,404 (+1%) | 3mo | $355,000 | $253 | 66 |
| 8078 SE 169th Tweedside Loop | 0.67mi | 2/2.0 | 1,400 (+1%) | 8mo | $336,000 | $240 | 61 |
| 17126 SE 78th Larchmont Ct | 0.22mi | 2/2.0 | 1,229 (-12%) | 14mo | $352,000 | $286 | 59 |
| 16925 SE 77th Northridge Ct | 0.48mi | 3/2.0 (+1) | 1,490 (+7%) | 6mo | $310,000 | $208 | 55 |
| 17173 SE 79th Mclawren Ter | 0.55mi | 3/2.0 (+1) | 1,493 (+8%) | 5mo | $249,900 | $167 | 53 |
| 17112 SE 78th Parlange Ter | 0.29mi | 3/2.0 (+1) | 1,564 (+13%) | 10mo | $309,000 | $198 | 52 |
| 17395 SE 82nd Pecan Ter | 0.60mi | 2/2.0 | 1,202 (-13%) | 0mo | $229,900 | $191 | 49 |
| 17660 SE 81st Timberwood Ter | 0.53mi | 3/2.0 (+1) | 1,469 (+6%) | 13mo | $375,000 | $255 | 49 |
| 7808 SE 168th Lone Oak Loop | 0.45mi | 3/2.0 (+1) | 1,490 (+7%) | 18mo | $299,500 | $201 | 47 |
Match score weights: distance 35% · size 25% · config 20% · recency 20%. Top-matched comps best support the ARV.
Projected returns pro-forma
-3.0% appreciation · 3.92% rent growth · sell at horizon
- IRR
- -0.5%
- Equity multiple
- 0.98×
- Total profit
- $-1,591
- Equity at exit
- $42,480
- IRR
- 10.2%
- Equity multiple
- 1.83×
- Total profit
- $66,429
- Equity at exit
- $24,633
Cash invested: $79,772 (down + closing). Projections, not guarantees.
Landlord ↔ Tenant lean methodology
- Overall (STATE)
- 87 Strongly Landlord-Friendly
- State Florida
- 87 Strongly Landlord-Friendly · R+3
- County
- — inherits STATE
- City
- — inherits STATE
ZIP-level market 32162
- Home prices YoY
- -6.9%
- Rents YoY
- 3.9%
- Active inventory
- 550
- Price-to-rent
- 6.5×
Monthly cashflow live
- Estimated rent
- $3,634 medium interval (Pro) →
- Mortgage (P&I)
- −$1,494
- Tax from tax record
- −$411 /mo · $4,931/yr
- Insurance
- −$119
- HOA
- −$204
- Vacancy / Maint / Mgmt
- −$763
- Net cashflow
- $643
Break-even live
UW: 25.0% down · 7.5% · 30yr · 1.5% tax · 5.0% vac · 8.0% maint · 8.0% mgmt
Financing live
Cash to close
- Down payment
- $71,225
- Closing costs
- $8,547
- Reserves months
- —
- Total cash needed
- —
Loan-product check · same deal, 3 products live
Conventional
25% down · 7.5% · 30yr
- Down + closing
- —
- Monthly P&I
- —
- Monthly cashflow
- —
- DSCR
- —
- Eligible?
- —
Personal DTI + credit; lowest rate.
DSCR
20% down · 8.5% · 30yr
- Down + closing
- —
- Monthly P&I
- —
- Monthly cashflow
- —
- DSCR
- —
- Eligible?
- —
No personal income docs; deal must DSCR.
Hard money
10% down · 12.0% · 12mo
- Down + closing
- —
- Monthly P&I
- —
- Monthly cashflow
- —
- DSCR
- —
- Eligible?
- —
Short-term bridge; refi at stabilization.
Rent comps 5 comps
| Address | Beds | Baths | Sqft | Rent | $/sqft | DOM | Units | Dist |
|---|---|---|---|---|---|---|---|---|
| 7630 SE 174th Gaillard Pl The Villages, FL | 2.0 | 2.0 | 1265 | $4,500 | $3.56 | 21d | 1 | 0.13mi |
| 17442 SE 79th Lovewood Ave The Villages, FL | 2.0 | 2.0 | 1148 | $4,500 | $3.92 | 21d | 1 | 0.19mi |
| 17400 SE 82nd Roslyn Ct The Villages, FL | 2.0 | 2.0 | 1138 | $4,700 | $4.13 | 21d | 1 | 0.51mi |
| 17324 SE 82nd Pecan Ter The Villages, FL | 2.0 | 2.0 | 1358 | $2,500 | $1.84 | 21d | 1 | 0.55mi |
| 8544 SE 177th Bartram Loop The Villages, FL | 2.0 | 2.0 | 1265 | $1,900 | $1.50 | 21d | 1 | 0.80mi |
HOA detail
- Monthly dues
- $204 · $2,448/yr
- Likely covers
- watergas
Listing history 34 events
-
2026-06-18days on market $284,900 Active 92 DOM
-
2026-06-17days on market $284,900 Active 91 DOM
-
2026-06-16days on market $284,900 Active 90 DOM
-
2026-06-15days on market $284,900 Active 89 DOM
-
2026-06-14days on market $284,900 Active 87 DOM
-
2026-06-13days on market $284,900 Active 86 DOM
-
2026-06-10days on market $284,900 Active 84 DOM
-
2026-06-09days on market $284,900 Active 83 DOM
-
2026-06-08days on market $284,900 Active 82 DOM
-
2026-06-07days on market $284,900 Active 81 DOM
-
2026-06-03days on market $284,900 Active 77 DOM
-
2026-06-02days on market $284,900 Active 76 DOM
-
2026-06-01days on market $284,900 Active 75 DOM
-
2026-05-31days on market $284,900 Active 74 DOM
-
2026-05-30days on market $284,900 Active 73 DOM
-
2026-03-18$284,900 Active 955-char remark
Show marketing remark (955 chars)
Must see this 2 bedroom, 2 full bath and 1.5 car garage Austin model located in the Village of Chatham. Conveniently located near the Publix shopping center & VA clinic off CR 42. Close to the newer First Responders Recreational Center & Nancy Lopez Country Club. Newer roof (2020), newer furnace & AC (2023), newer tankless gas water heater, newer washer & dryer, gutters & downspouts + large elevated back porch (18x13). Open floor plan concept w/ volume ceilings, ceramic tile & luxury vinyl flooring (no carpet) & knockdown ceiling texture. Updated kitchen w/ additional cabinets, pull-out drawers, Stainless Steel appliances, gas convection oven/range, newer refrigerator & Bosch dishwasher. Additional, oversized Florida Room (19x12). Large Master Bedroom w/ walk-in closet & master bathroom w/ walk-in shower. Low bond balance of $1782. Call today for your personal tour of this wonderful home.
-
2025-11-15historical
-
2025-10-10status Active
-
2025-10-10price $284,900
-
2025-10-08historical
-
2025-09-19price $289,000
-
2025-09-02status Active
-
2025-08-31historical
-
2025-08-08price $295,000
-
2025-03-27price $319,000
-
2025-03-26$219,000 Active
-
2024-08-04historical
-
2024-08-04historical
-
2024-07-10$329,900 Active
-
2024-07-10$329,900 Active
-
2022-11-07soldstatus $282,500
-
2022-10-27soldstatus $282,500 Closed
-
2022-09-25status Pending
-
2022-09-16$295,000 Active
ⓘ Source: listings_history table (triggers on properties + properties_extension) + one-shot
backfill from property_details.listing_events for pre-trigger history.
Tax reassessment forecast FL · Resets to sale price
- Current annual tax
- $4,931 · $411/mo
- Projected year-2 tax
- $4,931 · $411/mo
- Expected delta
- $0/yr ($0/mo · 0.0%)
ⓘ Screening estimate from a state-policy table — verify with the county assessor before closing.
Climate risk First Street
- Flood 1/10 Low FEMA zone X (unshaded) · 0% chance over 30 yrs
- Wildfire 4/10 Moderate
- Heat 9/10 Extreme 7 d/yr ≥109°F today · 21 d/yr by 30 yrs out
- Wind 9/10 Extreme 99% chance of damaging wind over 30 yrs
- Air quality 3/10 Moderate 2 unhealthy d/yr today · 2 by 30 yrs out
Nearby sold comps map
Loading sold comps map…
Walkable amenities ~0.75 mi
Loading nearby amenities…
Taxation est. · year 1
- Rental income
- $43,609
- − Mortgage interest
- −$15,959
- − Property taxes
- −$4,931
- − Insurance
- −$1,424
- − Repairs & maintenance
- −$3,489
- − Management
- −$3,489
- − HOA
- −$2,448
- − Depreciation
- −$8,288
- Taxable income
- $3,581
- Est. tax owed @ 24.0%
- −$859
- After-tax cash flow
- $6,859/yr
For passive investors: Depreciation is non-cash, so a rental often shows a tax loss while cash-flowing — sheltering income. Rental losses are passive: they offset passive income freely, and up to $25,000/yr can offset ordinary (W-2) income if you actively participate and your MAGI is under $100k (phasing out to $0 by $150k); unused losses carry forward. On sale, claimed depreciation is recaptured at up to 25%, and gains may owe capital-gains tax (a 1031 exchange can defer both). Figures are a year-1 estimate at your 24.0% rate — not tax advice; consult a CPA.
Schools (NCES district)
- District
- Marion
- NCES district ID
- 1201260
- Math proficiency
- 42% ▼ -7.00%
- Reading proficiency
- 43% ▼ -4.00%
- Median HH income
- $40,015
- Composite
- 35.61/100
- National rank
- #4890
- State rank
- #61 of 73 in FL
Livability — The Villages
- Score
- 70/100
- State rank
- #431
- US rank
- #7363
Category grades
Schools grade is shown separately in the Schools card above.
Census & demographics
- Census place
- The Villages, FL
- County
- Sumter County · 110,591 people
- City population
- 32,107
- Metro
- The Villages, FL
- Population (ZIP)
- 55,424
- Household income
- $74,119
- Rent vs Own
- Severe rent burden
- 987.0
Population outlook (Marion County) Hauer SSP2
- Today (2025)
- 365,905 people
- By 2030
- 376,768 · +3.0%
- By 2040
- 396,555 · +8.4%
- By 2050
- 412,723 · +12.8%
- By 2075
- 446,090 · +21.9%
- By 2100
- 436,193 · +19.2%
Race, ethnicity, and origin ACS 2023
- Neighborhood character
- Predominantly White (95%)
- Race & ethnicity
- White 95% Two or more races 2% Hispanic / Latino 2% Asian 1% Black 1%
- Common ancestry
- Romanian 7% Slovak 4% Lithuanian 4%
- Foreign-born
- 5% · Canada
- Languages at home
- 96% English-only · Spanish 1% Tagalog/Filipino 1%
Political lean MEDSL · Marion
- 2024 margin
- Solid R (+31.6) · D 33.8% · R 65.5%
- 2008→2024 swing
- -20.0pp toward R · 2008: -11.6pp · 2024: -31.6pp
- All cycles
- 2024: R+31.6 2020: R+25.9 2016: R+26.2 2012: R+16.2 2008: R+11.6
Not yet ingested
- Civics
- —
Market trends
- HPI YoY
- ▼ -16.16%
- Current HPI
- 218.1956
- Rent YoY
- ▲ 3.92%
- Metro
- The Villages, FL
- State GDP YoY
- ▲ 3.28%
- F500 in state
- 36
Industry mix (Fortune 500 HQ in FL)
| Industry | F500 HQs | Revenue |
|---|---|---|
| Industrial Technology | 2 | $29B |
|
||
| Insurance | 2 | $17B |
|
||
| Retail | 1 | $60B |
|
||
| Technology Distribution | 1 | $58B |
|
||
| Homebuilding | 1 | $35B |
|
||
| Technology Manufacturing | 1 | $35B |
|
||
Price history
-3.4% since first listed19 events — show timeline
- 2026-03-18 Listed $284,900 Stellar MLS as Distributed by MLS Grid
- 2025-11-15 Listing Removed — Stellar MLS as Distributed by MLS Grid
- 2025-10-10 Relisted — Stellar MLS as Distributed by MLS Grid
- 2025-10-10 Price Changed $284,900 Stellar MLS as Distributed by MLS Grid
- 2025-10-08 Listing Removed — Stellar MLS as Distributed by MLS Grid
- 2025-09-19 Price Changed $289,000 Stellar MLS as Distributed by MLS Grid
- 2025-09-02 Relisted — Stellar MLS as Distributed by MLS Grid
- 2025-08-31 Listing Removed — Stellar MLS as Distributed by MLS Grid
- 2025-08-08 Price Changed $295,000 Stellar MLS as Distributed by MLS Grid
- 2025-03-27 Price Changed $319,000 Stellar MLS as Distributed by MLS Grid
- 2025-03-26 Listed $219,000 Stellar MLS as Distributed by MLS Grid
- 2024-08-04 Listing Removed — Stellar MLS as Distributed by MLS Grid
- 2024-08-04 Listing Removed — HCAR
- 2024-07-10 Listed $329,900 Stellar MLS as Distributed by MLS Grid
- 2024-07-10 Listed $329,900 HCAR
- 2022-11-07 Sold (Public Records) $282,500 Public Records
- 2022-10-27 Sold (MLS) $282,500 Stellar MLS as Distributed by MLS Grid
- 2022-09-25 Pending — Stellar MLS as Distributed by MLS Grid
- 2022-09-16 Listed $295,000 Stellar MLS as Distributed by MLS Grid
Property tax history
+7.1%/yrLatest (2025): $4,931 · +2.5% YoY. Source: county tax records.
Cash-flow waterfall
monthlySold comps — $/sqft
last 12 mo · ≤1 miLoading sold comps…