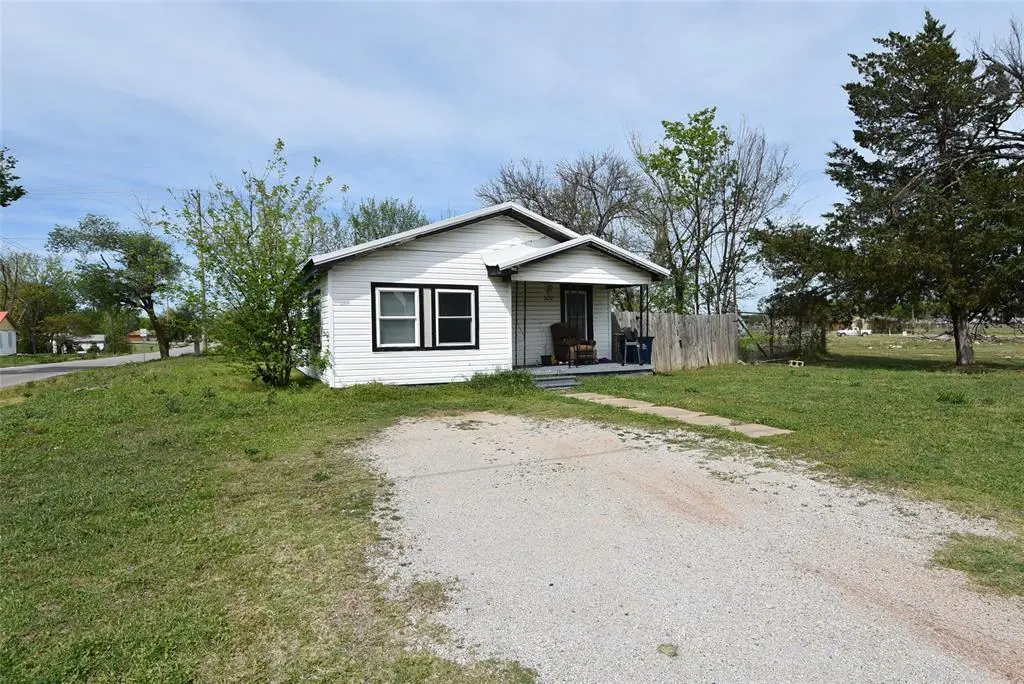
1632 W Strothers Ave · Seminole, OK
Flood risk 1/10 · Minimal
- FEMA flood zone
- X (unshaded)
- Chance of flooding over 30 yrs
- 0.0%
- Est. flood insurance / yr
- $507 – $1,088
Fire risk 10/10 · Severe
- Est. fire insurance / yr
- $2,463 – $4,575
Heat risk 6/10 · Moderate
- Hot days now (above 111°F)
- 7 days/yr
- Hot days in 30 yrs
- 19 days/yr
Wind risk 3/10 · Minor
- Chance of severe wind over 30 yrs
- 8.0%
Air-quality risk 2/10 · Minimal
- Unhealthy air days now
- 1 days/yr
- Unhealthy air days in 30 yrs
- 1 days/yr
Risk factors via First Street. Map © Google.
Why this score? — see what drove the B- grade
The composite is a weighted blend of 9 inputs, each scored 0–100. Each bar is that input's sub-score; the figure is the points it added to the 100-point composite (weight × sub-score).
- Cash flow +30.0/30.0
- DSCR +10.0/10.0
- Appreciation +10.0/10.0
- 1% rule +8.9/10.0
- Livability +3.2/5.0
- Rent growth +2.5/5.0
- Condition / age +2.5/5.0
- Schools +1.6/10.0
- ARV discount +0.0/15.0
$60,000
🖨 Deal sheet (PDF) 📄 Offer letter ✓ Due diligence
Listing remarks MLS
VERY CHARMING HOME ON CORNER LOTFOR A GRAT PRICE. PROPRTY HAS A LARGE FENCED YARD. THIS LOVELY HOME IS SO COZY, GREAT FOR YOUR FIRST STARTER HOME. JUST LOOK AT THE ENTERIOR PICTURES TO SEE THAT COZY FEELING YOU WILL GET WHEN YOU WALK IN THE FRONT DOOR.
Key facts
- Laminate flooring
- Central heat and air
- Large fenced yard
Tags
Neighborhood map
What this means for you Summary
Snapshot
- This is a 2-bed/1.0-bath single-family listed at $60k.
Deal economics
- At list price, monthly cash flow is $293 ($4k/yr) — positive.
- The deal already cash-flows at list — no discount required.
- Meets the 1% rule at list price ($835 rent vs $60k).
- Cap rate 12.1% vs local median 4.8% in Seminole — top-decile yield for the area; either an underpriced asset or a hidden risk that comps aren't pricing in. Stress-test before assuming the spread holds.
Location & tenants
- Location reads 63/100 on livability (#222 in OK) — a middle-class / working-renter tenant base. Strengths: cost of living A+, housing A; Watch: crime D+, amenities F, commute F.
- Seminole (town): math 17% / reading 21% proficiency, ranked #193 of 270 in OK (top 72%) — low school quality limits family demand, transient renter base, plan for 1-2y turnover; 63% free/reduced lunch — lower-income household profile, screen leases tightly.
- Zoned schools: Wilson Es (math 27% / reading 22%, grade F, #354 of 845 statewide, top 47%, 499 students, 0% FRL); Seminole Hs (math 17% / reading 27%, grade F, #222 of 447 statewide, top 52%, 451 students, 0% FRL) — zoned schools average 0% FRL vs 63% district-wide (63 pts lower); this property's tenant base skews higher-income than the district average.
- Market conditions: 136 active listings in the ZIP; 93 units permitted in Seminole County in 2024 (43 in 5+ unit buildings).
Forward outlook
- In year one you build about $6k of equity ($415 loan paydown + $6k appreciation (10.0% local appreciation)).
- At projected returns (10.0% appreciation + 3.0% rent growth), your $17k cash investment doubles in ~2 years — after that, you're playing with house money.
- By year 6, paydown + projected appreciation supports a ~$38k cash-out refi (75% LTV) — recoverable capital for the next deal without selling this one.
Negotiation context
- Only 3 days on market — expect competitive offers; lowballing is unlikely to land.
- 2 sale attempts since 9y ago with the ask held roughly flat each time — persistent listings suggest the price (not the market) is what's stuck; bring a comps-based counter.
- Current owner paid $24k; list at $60k implies a 150% gain — meaningful room to come down on a strong offer.
Risks & watch-outs
- Watch-outs: built in 1940 — expect roof / HVAC / electrical / plumbing capex.
- Climate carrying-cost: severe wildfire risk; extreme-heat days projected 7→19/yr by 2055 (HVAC capex compounding) — expect insurance premiums to compound above CPI over the hold.
Questions for the listing agent
- Built in 1940 — when were the roof, HVAC, electrical panel, plumbing, and water heater last replaced?
- Is there a deadline driving the sale (1031 exchange, divorce, estate, relocation)? That informs how much negotiation room exists.
- Schools are F-rated, which usually means shorter tenancies and higher turnover. Who's the typical renter profile here, and what's been the actual vacancy rate?
- Crime grade is D in this area — have there been break-ins, vandalism, or insurance claims at this property in the last 3 years? What carrier currently insures it and at what premium?
- What's the average days-on-market for RENTAL listings here right now (not sales)? A rising rental-DOM trend means longer vacancies and softer asking-rent achievability than the comps imply.
- What's the recent tenant-quality profile in this submarket — average credit score on applications, eviction rate, late-payment / NSF rate, and stable-employment percentage? A property-management company in the area should have these aggregated.
- How much new for-sale + rental construction is in the pipeline within 1–3 miles? Heavy new supply typically softens prices + rents 12–24 months out; constrained supply supports both.
Investment metrics
- 1% rule
- 1.39% ✓
- Cap rate
- 12.15%
- Cash-on-cash
- 20.91%
- DSCR
- 1.93
- GRM
- 6.0
CMA / ARV
- ARV (on-the-fly)
- $49,140
- Comps found
- 5
Show comp detail 5 sales within ~0.75 mi
| Address | Dist | Beds/Ba | Sqft | Sold | Price | $/sf | Match |
|---|---|---|---|---|---|---|---|
| 1632 W Strothers Ave | 0.00mi | 2/1.0 | 756 (0%) | 1mo | $50,000 | $66 | 100 |
| 1738 Rhode Island St | 0.51mi | 2/1.0 | 768 (+2%) | 18mo | $49,750 | $65 | 58 |
| 1920 Smith St | 0.69mi | 1/1.0 (-1) | 796 (+5%) | 6mo | $32,000 | $40 | 49 |
| 1018 Coolidge | 0.47mi | 2/1.0 | 816 (+8%) | 22mo | $78,000 | $96 | 46 |
| 1350 Coolidge St | 0.59mi | 2/1.0 | 864 (+14%) | 6mo | $22,000 | $25 | 44 |
Match score weights: distance 35% · size 25% · config 20% · recency 20%. Top-matched comps best support the ARV.
Projected returns pro-forma
10.0% appreciation · 3.0% rent growth · sell at horizon
- IRR
- 39.9%
- Equity multiple
- 4.05×
- Total profit
- $51,306
- Equity at exit
- $54,053
- IRR
- 34.4%
- Equity multiple
- 9.12×
- Total profit
- $136,393
- Equity at exit
- $116,567
Cash invested: $16,800 (down + closing). Projections, not guarantees.
Landlord ↔ Tenant lean methodology
- Overall (STATE)
- 83 Strongly Landlord-Friendly
- State Oklahoma
- 83 Strongly Landlord-Friendly · R+20
- County
- — inherits STATE
- City
- — inherits STATE
ZIP-level market 74868
- Home prices YoY
- 6.4%
- Active inventory
- 136
- Price-to-rent
- 6.0×
Monthly cashflow live
- Estimated rent
- $835 medium interval (Pro) →
- Mortgage (P&I)
- −$315
- Tax from tax record
- −$27 /mo · $325/yr
- Insurance
- −$25
- HOA
- −$0
- Vacancy / Maint / Mgmt
- −$175
- Net cashflow
- $293
Break-even live
Sensitivity live
| Price | -10% $327 | -5% $310 | +0% $293 | +5% $276 | +10% $259 |
|---|---|---|---|---|---|
| Rent | -10% $227 | -5% $260 | +0% $293 | +5% $326 | +10% $359 |
| Rate | -1.0pp $323 | -0.5pp $308 | base $293 | +0.5pp $277 | +1.0pp $261 |
UW: 25.0% down · 7.5% · 30yr · 1.5% tax · 5.0% vac · 8.0% maint · 8.0% mgmt
Financing live
Cash to close
- Down payment
- $15,000
- Closing costs
- $1,800
- Reserves months
- —
- Total cash needed
- —
Loan-product check · same deal, 3 products live
Conventional
25% down · 7.5% · 30yr
- Down + closing
- —
- Monthly P&I
- —
- Monthly cashflow
- —
- DSCR
- —
- Eligible?
- —
Personal DTI + credit; lowest rate.
DSCR
20% down · 8.5% · 30yr
- Down + closing
- —
- Monthly P&I
- —
- Monthly cashflow
- —
- DSCR
- —
- Eligible?
- —
No personal income docs; deal must DSCR.
Hard money
10% down · 12.0% · 12mo
- Down + closing
- —
- Monthly P&I
- —
- Monthly cashflow
- —
- DSCR
- —
- Eligible?
- —
Short-term bridge; refi at stabilization.
Listing history 7 events
-
2026-04-20status Pending
-
2026-04-17$60,000 Active
-
2018-03-15soldstatus $24,000
-
2018-03-07soldstatus $24,000 252-char remark
Show marketing remark (252 chars)
VERY CHARMING HOME ON CORNER LOTFOR A GRAT PRICE. PROPRTY HAS A LARGE FENCED YARD. THIS LOVELY HOME IS SO COZY, GREAT FOR YOUR FIRST STARTER HOME. JUST LOOK AT THE ENTERIOR PICTURES TO SEE THAT COZY FEELING YOU WILL GET WHEN YOU WALK IN THE FRONT DOOR.
-
2017-09-18$32,000 252-char remark
Show marketing remark (252 chars)
VERY CHARMING HOME ON CORNER LOTFOR A GRAT PRICE. PROPRTY HAS A LARGE FENCED YARD. THIS LOVELY HOME IS SO COZY, GREAT FOR YOUR FIRST STARTER HOME. JUST LOOK AT THE ENTERIOR PICTURES TO SEE THAT COZY FEELING YOU WILL GET WHEN YOU WALK IN THE FRONT DOOR.
-
2011-06-13soldstatus $30,000
-
2006-06-26soldstatus $19,500
ⓘ Source: listings_history table (triggers on properties + properties_extension) + one-shot
backfill from property_details.listing_events for pre-trigger history.
Tax reassessment forecast OK · Resets to sale price
- Current annual tax
- $325 · $27/mo
- Projected year-2 tax
- $540 · $45/mo
- Expected delta
- +$215/yr (+$18/mo · 66.2%)
ⓘ Screening estimate from a state-policy table — verify with the county assessor before closing.
Climate risk First Street
- Flood 1/10 Low FEMA zone X (unshaded) · 0% chance over 30 yrs
- Wildfire 10/10 Extreme
- Heat 6/10 Major 7 d/yr ≥111°F today · 19 d/yr by 30 yrs out
- Wind 3/10 Moderate 8% chance of damaging wind over 30 yrs
- Air quality 2/10 Low 1 unhealthy d/yr today · 1 by 30 yrs out
Nearby sold comps map
Loading sold comps map…
Walkable amenities ~0.75 mi
Loading nearby amenities…
Taxation est. · year 1
- Rental income
- $10,017
- − Mortgage interest
- −$3,361
- − Property taxes
- −$325
- − Insurance
- −$300
- − Repairs & maintenance
- −$801
- − Management
- −$801
- − Depreciation
- −$1,745
- Taxable income
- $2,683
- Est. tax owed @ 24.0%
- −$644
- After-tax cash flow
- $2,869/yr
For passive investors: Depreciation is non-cash, so a rental often shows a tax loss while cash-flowing — sheltering income. Rental losses are passive: they offset passive income freely, and up to $25,000/yr can offset ordinary (W-2) income if you actively participate and your MAGI is under $100k (phasing out to $0 by $150k); unused losses carry forward. On sale, claimed depreciation is recaptured at up to 25%, and gains may owe capital-gains tax (a 1031 exchange can defer both). Figures are a year-1 estimate at your 24.0% rate — not tax advice; consult a CPA.
Schools (NCES district)
- District
- Seminole
- NCES district ID
- 4027300
- Math proficiency
- 17% ▼ -10.00%
- Reading proficiency
- 21% ▼ -5.00%
- Median HH income
- $33,661
- Composite
- 15.51/100
- National rank
- #9304
- State rank
- #193 of 270 in OK
Livability — Seminole
- Score
- 63/100
- State rank
- #222
- US rank
- #15706
Category grades
Schools grade is shown separately in the Schools card above.
Census & demographics
- Census place
- Seminole, OK
- Population (ZIP)
- 12,451
Population outlook (Seminole County) Hauer SSP2
- Today (2025)
- 25,628 people
- By 2030
- 25,617 · +-0.0%
- By 2040
- 25,619 · +-0.0%
- By 2050
- 25,726 · +0.4%
- By 2075
- 26,261 · +2.5%
- By 2100
- 25,844 · +0.8%
Race, ethnicity, and origin ACS 2023
- Neighborhood character
- Diverse neighborhood (Simpson 0.57)
- Race & ethnicity
- White 65% Native American 19% Two or more races 10% Hispanic / Latino 5% Black 4%
- Hispanic origin (detail)
- Mexican 4%
- Common ancestry
- Iranian 1% Italian 1% Slovak 1%
- Foreign-born
- 3% · Canada
- Languages at home
- 96% English-only · Spanish 2%
Political lean MEDSL · Seminole
- 2024 margin
- Solid R (+49.7) · D 24.2% · R 74.0% · Other 1.8%
- 2008→2024 swing
- -19.1pp toward R · 2008: -30.6pp · 2024: -49.7pp
- All cycles
- 2024: R+49.7 2020: R+46.3 2016: R+44.1 2012: R+30.3 2008: R+30.6
Not yet ingested
- Civics
- —
Market trends
- HPI YoY
- ▲ 15.39%
- Current HPI
- 255.6657
- Rent YoY
- —
- Metro
- —
- State GDP YoY
- ▲ 1.55%
- F500 in state
- 6
Industry mix (Fortune 500 HQ in OK)
| Industry | F500 HQs | Revenue |
|---|---|---|
| Energy | 3 | $48B |
|
||
Price history
+207.7% since first listed7 events — show timeline
- 2026-04-20 Pending — MLSOK
- 2026-04-17 Listed $60,000 MLSOK
- 2018-03-15 Sold (Public Records) $24,000 Public Records
- 2018-03-07 Sold (MLS) $24,000 MLSOK
- 2017-09-18 Listed $32,000 MLSOK
- 2011-06-13 Sold (Public Records) $30,000 Public Records
- 2006-06-26 Sold (Public Records) $19,500 Public Records
Property tax history
+2.4%/yrLatest (2025): $325 · +6.2% YoY. Source: county tax records.
Cash-flow waterfall
monthlySold comps — $/sqft
last 12 mo · ≤1 miLoading sold comps…