 🌊 Lakefront
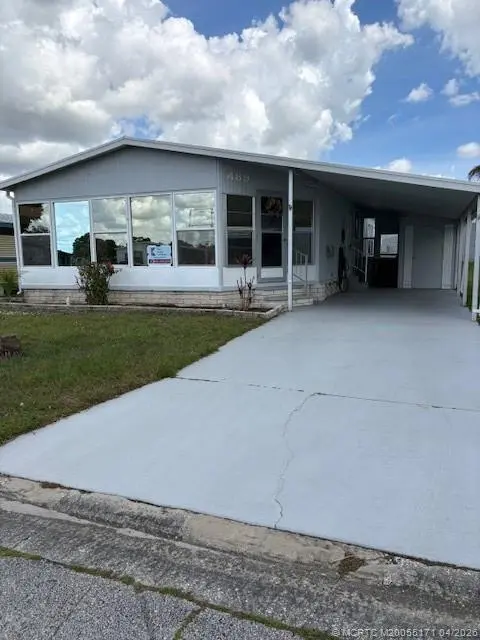
489 Swan Ln · West Vero Corridor, FL
Flood risk No data
- FEMA flood zone
- —
- Chance of flooding over 30 yrs
- —
- Est. flood insurance / yr
- —
Fire risk No data
- Est. fire insurance / yr
- —
Heat risk No data
- Hot days now (above threshold)
- —
- Hot days in 30 yrs
- —
Wind risk No data
- Chance of severe wind over 30 yrs
- —
Air-quality risk No data
- Unhealthy air days now
- —
- Unhealthy air days in 30 yrs
- —
Risk factors via First Street. Map © Google.
Why this score? — see what drove the C- grade
The composite is a weighted blend of 9 inputs, each scored 0–100. Each bar is that input's sub-score; the figure is the points it added to the 100-point composite (weight × sub-score).
- Cash flow +15.0/30.0
- ARV discount +13.6/15.0
- 1% rule +5.0/10.0
- DSCR +5.0/10.0
- Schools +4.2/10.0
- Livability +3.7/5.0
- Rent growth +2.7/5.0
- Condition / age +2.5/5.0
- Appreciation +0.0/10.0
$24,900
🖨 Deal sheet 📄 Offer letter ✓ Due diligence
Listing remarks
Gated 55+ community, Freshly painted and move in ready, bright and airy modular home with high ceilings, Updated Laminate floors throughout, 2 bedrooms, 2baths, living room, dining room plus lanai and carport- 2 pets allowed For sale or rent
Key facts
- Parking
- Community pool
- Built 1983
Property features AI
Finance
- Other: Senior community; Pets allowed (number limit confirmed)
- HOA & community: Homeowners association with a monthly fee of $993; Association fee covers management, common areas, grounds maintenance, pool(s), taxes, and trash
Exterior
- Parking: 1 total parking space; 1 covered parking space
- Security: Gated community
- Utilities: Electricity available
- Home design: Single-story residence; Resale property; Aluminum siding
- Construction: Aluminum siding construction
- Exterior features: Community pool; Community spa; Gated community; Clubhouse; Fitness center; Shuffleboard; Bocce court; Tennis courts; Street lights; Property manager on-site; Maintenance of common areas included in association
Interior
- Bathrooms: 2 full bathrooms
- Heating & cooling: Central heating; Central air conditioning
- Interior features: Unfurnished
Neighborhood map
What this means for you Summary
Snapshot
- This is a 2-bed/2.0-bath manufactured listed at $25k.
Deal economics
- At list price, monthly cash flow is $280 ($3k/yr) — positive.
- The deal already cash-flows at list — no discount required.
- Meets the 1% rule at list price ($2k rent vs $25k).
- Recommended offer: $23k (6.0% below list) — sets the bar for market timing.
- Cap rate 19.8% vs local median 4.0% in West Vero Corridor — top-decile yield for the area; either an underpriced asset or a hidden risk that comps aren't pricing in. Stress-test before assuming the spread holds.
Location & tenants
- Location reads 74/100 on livability (#273 in FL, #4,421 nationally) — a middle-class / working-renter tenant base. Strengths: cost of living A+, housing A+, commute A; Watch: schools F, amenities F, health & safety D-.
- Indian River (other): math 48% / reading 52% proficiency, ranked #35 of 73 in FL (top 48%) — acceptable for families but not a draw, mixed tenant base, ~2y average lease.
- Market conditions: Rents flat; 380 active listings in the ZIP; 14 comparable units currently listed for rent nearby; rentals at typical pace (median 21d on market — plan ~3-4 weeks tenant-placement turnaround); 564 units permitted in Indian River County in 2024 (281 in 5+ unit buildings).
- This rent runs 33% of the median local income ($67k/yr) — at the standard rent-burdened threshold; future hikes will face affordability resistance.
Forward outlook
- Local home prices are declining (-3.0%/yr); year-one equity from $172 of loan paydown is wiped out by about $747 of value loss. Plan a longer hold.
- Indian River County population projected at +18% by 2050 — long-run rental-demand tailwind backs the buy-and-hold thesis.
- At projected returns (-3.0% appreciation + 0.6% rent growth), your $7k cash investment doubles in ~3 years — after that, you're playing with house money.
Negotiation context
- It's been on market 73 days — a 6% lower offer ($23k) is reasonable based on typical stale-listing flexibility.
- 3 sale attempts; this cycle's ask is 1461% above the opening price — seller raised mid-cycle; expect resistance to lowballs.
Risks & watch-outs
- Watch-outs: HOA is 54% of rent.
Questions for the listing agent
- It's been on market 73 days. Have you received any prior offers? Is the seller open to a 6% concession, seller financing, or rate buy-down credit?
- What does the HOA fee cover, when was the last increase, and are there any pending special assessments or reserve-fund shortfalls?
- Why hasn't it sold? Are there any deal-killer items the seller is aware of (foundation, flood, title, zoning, code violations)?
- Is there a deadline driving the sale (1031 exchange, divorce, estate, relocation)? That informs how much negotiation room exists.
- Schools are F-rated, which usually means shorter tenancies and higher turnover. Who's the typical renter profile here, and what's been the actual vacancy rate?
- This sits on a lake — are riparian / water-frontage rights deeded with the parcel? Any dock permits, shoreline easements, or HOA water-use restrictions?
- What's the documented flood / surge / shoreline-erosion history here (FEMA AND non-FEMA — e.g., storm surge, creek backup, septic-field saturation)?
- Any water-quality or seasonal algae-bloom issues that affect tenant satisfaction or short-term-rental demand?
- What's the average days-on-market for RENTAL listings here right now (not sales)? A rising rental-DOM trend means longer vacancies and softer asking-rent achievability than the comps imply.
- What's the recent tenant-quality profile in this submarket — average credit score on applications, eviction rate, late-payment / NSF rate, and stable-employment percentage? A property-management company in the area should have these aggregated.
- How much new for-sale + rental construction is in the pipeline within 1–3 miles? Heavy new supply typically softens prices + rents 12–24 months out; constrained supply supports both.
Investment metrics
- 1% rule
- 7.34% ✓
- Cap rate
- 19.77%
- Cash-on-cash
- 48.12%
- DSCR
- 3.14
- GRM
- 1.1
CMA / ARV
- ARV (on-the-fly)
- $28,800
- Comps found
- 1
Show comp detail 1 sale within ~0.75 mi
| Address | Dist | Beds/Ba | Sqft | Sold | Price | $/sf | Match |
|---|---|---|---|---|---|---|---|
| 911 Courier St | 0.71mi | 2/2.0 | 1,300 (+13%) | 22mo | $33,000 | $25 | 27 |
Match score weights: distance 35% · size 25% · config 20% · recency 20%. Top-matched comps best support the ARV.
Projected returns pro-forma
-3.0% appreciation · 0.6% rent growth · sell at horizon
- IRR
- 37.7%
- Equity multiple
- 2.45×
- Total profit
- $10,096
- Equity at exit
- $3,713
- IRR
- 40.2%
- Equity multiple
- 3.50×
- Total profit
- $17,445
- Equity at exit
- $2,153
Cash invested: $6,972 (down + closing). Projections, not guarantees.
Landlord ↔ Tenant lean methodology
- Overall (STATE)
- 87 Strongly Landlord-Friendly
- State Florida
- 87 Strongly Landlord-Friendly · R+3
- County
- — inherits STATE
- City
- — inherits STATE
ZIP-level market 32966
- Home prices YoY
- -26.7%
- Rents YoY
- 0.6%
- Active inventory
- 380
- Price-to-rent
- 1.1×
Monthly cashflow live
- Estimated rent
- $1,829 high interval (Pro) →
- Mortgage (P&I)
- −$131
- Tax est. 1.5%
- −$31 /mo · $374/yr
- Insurance
- −$10
- HOA
- −$993
- Vacancy / Maint / Mgmt
- −$384
- Net cashflow
- $280
Break-even live
UW: 25.0% down · 7.5% · 30yr · 1.5% tax · 5.0% vac · 8.0% maint · 8.0% mgmt
Financing live
Cash to close
- Down payment
- $6,225
- Closing costs
- $747
- Reserves months
- —
- Total cash needed
- —
Loan-product check · same deal, 3 products live
Conventional
25% down · 7.5% · 30yr
- Down + closing
- —
- Monthly P&I
- —
- Monthly cashflow
- —
- DSCR
- —
- Eligible?
- —
Personal DTI + credit; lowest rate.
DSCR
20% down · 8.5% · 30yr
- Down + closing
- —
- Monthly P&I
- —
- Monthly cashflow
- —
- DSCR
- —
- Eligible?
- —
No personal income docs; deal must DSCR.
Hard money
10% down · 12.0% · 12mo
- Down + closing
- —
- Monthly P&I
- —
- Monthly cashflow
- —
- DSCR
- —
- Eligible?
- —
Short-term bridge; refi at stabilization.
Rent comps 14 comps
| Address | Beds | Baths | Sqft | Rent | $/sqft | DOM | Units | Dist |
|---|---|---|---|---|---|---|---|---|
| 8775 20th St #909 Vero Beach, FL | 2.0 | 2.0 | 1000 | $1,799 | $1.80 | 21d | 1 | 0.18mi |
| 8775 20th St #925 Vero Beach, FL | 3.0 | 2.0 | 1356 | $1,799 | $1.33 | 21d | 1 | 0.18mi |
| 8775 20th St #59 Vero Beach, FL | 2.0 | 2.0 | 1147 | $1,699 | $1.48 | 21d | 1 | 0.18mi |
| 1405 82nd Ave #19 Vero Beach, FL | 2.0 | 2.0 | 842 | $1,699 | $2.02 | 21d | 1 | 0.18mi |
| 589 Johnathans Cay Vero Beach, FL | 3.0 | 2.0 | 1409 | $1,799 | $1.28 | 13d | 1 | 0.47mi |
| 8775 20th St #610 Vero Beach, FL | 1.0 | 1.0 | 840 | $1,399 | $1.67 | 21d | 1 | 0.48mi |
| 8415 22nd St Vero Beach, FL | 2.0 | 2.0 | 1100 | $2,000 | $1.82 | 13d | 1 | 0.61mi |
| 2240 86th Dr Vero Beach, FL | 2.0 | 2.0 | 951 | $1,875 | $1.97 | 21d | 1 | 0.75mi |
| 34 Freedom Dr Vero Beach, FL | 1.0 | 1.0 | 840 | $1,299 | $1.55 | 13d | 1 | 0.82mi |
| 344 Heritage Blvd Vero Beach, FL | 2.0 | 2.0 | 1000 | $1,499 | $1.50 | 21d | 1 | 0.86mi |
| 174 Congress St Vero Beach, FL | 2.0 | 2.0 | 1200 | $1,700 | $1.42 | 21d | 1 | 0.89mi |
| 2050 Griffon Rd Vero Beach, FL | 1.0–2.0 | 1.0–2.0 | 850 | $2,295 | $2.70 | 13d | 31 | 0.95mi |
| 2365 89th Dr Vero Beach, FL | 2.0 | 2.0 | 1182 | $1,700 | $1.44 | 21d | 1 | 1.02mi |
| 7580 Heron Cir Vero Beach, FL | 1.0–3.0 | 1.0–2.0 | 1003 | $2,076 | $2.07 | 13d | 21 | 1.10mi |
HOA detail
- Monthly dues
- $993 · $11,916/yr
- Likely covers
- security
Listing history 22 events
-
2026-06-19days on market $24,900 Active 73 DOM
-
2026-06-18days on market $24,900 Active 72 DOM
-
2026-06-17days on market $24,900 Active 71 DOM
-
2026-06-16days on market $24,900 Active 70 DOM
-
2026-06-15days on market $24,900 Active 69 DOM
-
2026-06-14days on market $24,900 Active 67 DOM
-
2026-06-13days on market $24,900 Active 66 DOM
-
2026-06-10days on market $24,900 Active 64 DOM
-
2026-06-09days on market $24,900 Active 63 DOM
-
2026-06-08days on market $24,900 Active 62 DOM
-
2026-06-07days on market $24,900 Active 61 DOM
-
2026-06-05days on market $24,900 Active 58 DOM
-
2026-06-02days on market $24,900 Active 56 DOM
-
2026-06-01days on market $24,900 Active 55 DOM
-
2026-05-31days on market $24,900 Active 54 DOM
-
2026-05-30days on market $24,900 Active 53 DOM
-
2026-05-02price $24,900
-
2026-04-08$1,595
-
2026-04-07$29,900 Active
-
2026-02-16historical
-
2025-12-17price $29,900
-
2025-11-11$39,000 Active
ⓘ Source: listings_history table (triggers on properties + properties_extension) + one-shot
backfill from property_details.listing_events for pre-trigger history.
Nearby sold comps map
Loading sold comps map…
Walkable amenities ~0.75 mi
Loading nearby amenities…
Taxation est. · year 1
- Rental income
- $21,944
- − Mortgage interest
- −$1,395
- − Property taxes
- −$374
- − Insurance
- −$124
- − Repairs & maintenance
- −$1,756
- − Management
- −$1,756
- − HOA
- −$11,916
- − Depreciation
- −$724
- Taxable income
- $3,900
- Est. tax owed @ 24.0%
- −$936
- After-tax cash flow
- $2,419/yr
For passive investors: Depreciation is non-cash, so a rental often shows a tax loss while cash-flowing — sheltering income. Rental losses are passive: they offset passive income freely, and up to $25,000/yr can offset ordinary (W-2) income if you actively participate and your MAGI is under $100k (phasing out to $0 by $150k); unused losses carry forward. On sale, claimed depreciation is recaptured at up to 25%, and gains may owe capital-gains tax (a 1031 exchange can defer both). Figures are a year-1 estimate at your 24.0% rate — not tax advice; consult a CPA.
Schools (NCES district)
- District
- Indian River
- NCES district ID
- 1200930
- Math proficiency
- 48% ▼ -9.00%
- Reading proficiency
- 52% ▼ -3.00%
- Median HH income
- $46,597
- Composite
- 42.45/100
- National rank
- #3218
- State rank
- #35 of 73 in FL
Livability — West Vero Corridor
- Score
- 74/100
- State rank
- #273
- US rank
- #4421
Category grades
Schools grade is shown separately in the Schools card above.
Census & demographics
- Census place
- West Vero Corridor, FL
- County
- Indian River County · 143,738 people
- Metro
- Sebastian-Vero Beach, FL
- Population (ZIP)
- 20,686
- Household income
- $66,771
- Rent vs Own
- Severe rent burden
- 766.0
Population outlook (Indian River County) Hauer SSP2
- Today (2025)
- 165,104 people
- By 2030
- 172,869 · +4.7%
- By 2040
- 185,640 · +12.4%
- By 2050
- 194,465 · +17.8%
- By 2075
- 211,115 · +27.9%
- By 2100
- 211,781 · +28.3%
Race, ethnicity, and origin ACS 2023
- Neighborhood character
- Predominantly White (83%)
- Race & ethnicity
- White 83% Hispanic / Latino 9% Two or more races 7% Black 5%
- Hispanic origin (detail)
- Puerto Rican 4% Cuban 1%
- Common ancestry
- Romanian 5% Lithuanian 3% Slovak 2%
- Foreign-born
- 8% · Canada, Jamaica
- Languages at home
- 90% English-only · Spanish 7% Russian/Polish/Slavic 1% French/Haitian/Cajun 1%
Political lean MEDSL · Indian River
- 2024 margin
- Strong R (+27.4) · D 36.0% · R 63.4%
- 2008→2024 swing
- -12.5pp toward R · 2008: -14.8pp · 2024: -27.4pp
- All cycles
- 2024: R+27.4 2020: R+21.6 2016: R+24.5 2012: R+22.3 2008: R+14.8
Not yet ingested
- Civics
- —
Market trends
- HPI YoY
- ▼ -102.01%
- Current HPI
- 280.669
- Rent YoY
- ▲ 0.60%
- Metro
- Sebastian-Vero Beach, FL
- State GDP YoY
- ▲ 3.28%
- F500 in state
- 36
Industry mix (Fortune 500 HQ in FL)
| Industry | F500 HQs | Revenue |
|---|---|---|
| Industrial Technology | 2 | $29B |
|
||
| Insurance | 2 | $17B |
|
||
| Retail | 1 | $60B |
|
||
| Technology Distribution | 1 | $58B |
|
||
| Homebuilding | 1 | $35B |
|
||
| Technology Manufacturing | 1 | $35B |
|
||
Price history
-36.2% since first listed6 events — show timeline
- 2026-05-02 Price Changed $24,900 MCRTC
- 2026-04-08 Listed for Rent $1,595 MCRTC
- 2026-04-07 Listed $29,900 MCRTC
- 2026-02-16 Listing Removed — MCRTC
- 2025-12-17 Price Changed $29,900 MCRTC
- 2025-11-11 Listed $39,000 MCRTC
Cash-flow waterfall
monthlySold comps — $/sqft
last 12 mo · ≤1 miLoading sold comps…