707 La Fontenay Ct · Douglass Hills, KY
Flood risk 1/10 · Minimal
- FEMA flood zone
- X (unshaded)
- Chance of flooding over 30 yrs
- 0.0%
- Est. flood insurance / yr
- $507 – $1,088
Fire risk 1/10 · Minimal
- Est. fire insurance / yr
- $839 – $1,559
Heat risk 5/10 · Moderate
- Hot days now (above 103°F)
- 7 days/yr
- Hot days in 30 yrs
- 21 days/yr
Wind risk 2/10 · Minimal
- Chance of severe wind over 30 yrs
- 2.0%
Air-quality risk 3/10 · Minor
- Unhealthy air days now
- 2 days/yr
- Unhealthy air days in 30 yrs
- 5 days/yr
Risk factors via First Street. Map © Google.
Why this score? — see what drove the C- grade
The composite is a weighted blend of 9 inputs, each scored 0–100. Each bar is that input's sub-score; the figure is the points it added to the 100-point composite (weight × sub-score).
- Cash flow +17.9/30.0
- 1% rule +8.1/10.0
- ARV discount +7.5/15.0
- DSCR +5.6/10.0
- Livability +3.8/5.0
- Rent growth +3.7/5.0
- Condition / age +2.5/5.0
- Schools +2.3/10.0
- Appreciation +0.0/10.0
$125,000
🖨 Deal sheet 📄 Offer letter ✓ Due diligence
Listing remarks
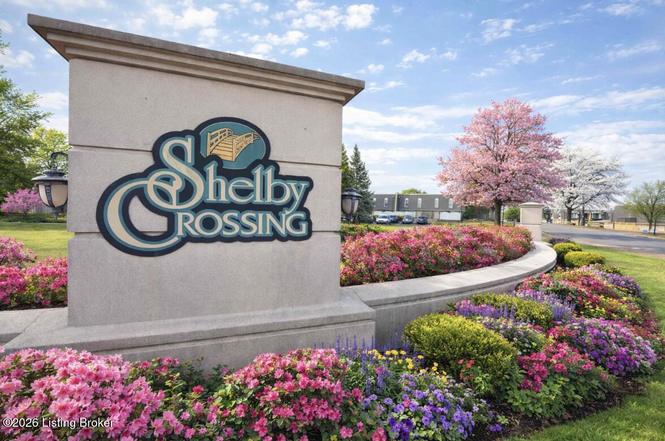
Welcome to La Fontenay in the desirable Shelby Crossing Condominiums, ideally located in the heart of Middletown/Louisville just off Shelbyville Road. This second-floor condo offers 2 bedrooms and 2 full bathrooms with comfortable living space and exceptional value under $140,000. Inside, you'll find an open living and dining area filled with natural light from the sliding patio door, creating an inviting central gathering space. The living room features your own private outdoor balcony—perfect for enjoying fresh air and quiet moments. The kitchen is conveniently positioned near the entry appliances will remain. The bedroom includes a large closet, The full bath offers a shower/tub co
Key facts
- Clubhouse
- Tennis courts
- Pool
Tags
Property features AI
Finance
- Other: Part of the Shelby Crossing subdivision; Building has 2 floors and 16 condo units
- HOA & community: HOA/association present; Association fee covers gas, heat, water, sewer, trash, internet, grounds maintenance, snow removal, and master insurance; Exterior maintenance and groundskeeping included
Exterior
- Utilities: Electricity connected; Water and sewer service included in association maintenance
- Home design: Condominium unit in a residential building; Located on level 2 of the building; One-story living area within the building footprint; Architectural style: Other
- Construction: Built in 1971; Brick construction; Flat roof; Slab foundation
- Exterior features: Tennis court(s); Balcony; Lot is cleared, level, and on a dead-end
Interior
- Kitchen: Kitchen located on the first floor
- Bedrooms: Two bedrooms, both on the first floor; Primary bedroom is on the first floor with primary bathroom on the first floor
- Bathrooms: Two full bathrooms, both on the first floor
- Heating & cooling: Electric heating; Central air conditioning
- Interior features: Six total rooms; Six closets; Basement: none; First-floor laundry
- Laundry & utility: Laundry on the first floor
Neighborhood map
What this means for you Summary
Snapshot
- This is a 2-bed/2.0-bath condo listed at $125k.
Deal economics
- At list price, monthly cash flow is $106 ($1k/yr) — positive.
- The deal already cash-flows at list — no discount required.
- Meets the 1% rule at list price ($2k rent vs $125k).
- Recommended offer: $110k (12.0% below list) — sets the bar for market timing.
- Cap rate 7.3% vs local median 4.1% in Douglass Hills — top-decile yield for the area; either an underpriced asset or a hidden risk that comps aren't pricing in. Stress-test before assuming the spread holds.
Location & tenants
- Location reads 76/100 on livability (#93 in KY, #3,759 nationally) — a middle-class / working-renter tenant base. Strengths: crime A+, housing A+, employment A; Watch: amenities D-, commute F.
- Jefferson County (urban): math 19% / reading 35% proficiency, ranked #121 of 165 in KY (top 73%) — low school quality limits family demand, transient renter base, plan for 1-2y turnover.
- Market conditions: Rents rising fast (+4.7%/yr); 103 active listings in the ZIP; 16 comparable units currently listed for rent nearby; rentals leasing fast (median 4d on market — plan ~1-2 weeks tenant-placement turnaround); solid renter incomes; 2,836 units permitted in Jefferson County in 2024 (1,558 in 5+ unit buildings).
Forward outlook
- Local home prices are declining (-3.0%/yr); year-one equity from $864 of loan paydown is wiped out by about $4k of value loss. Plan a longer hold.
- Jefferson County population projected at +13% by 2050 — modest demand growth; plan on rents tracking national, not racing it.
Negotiation context
- It's been on market 122 days — a 12% lower offer ($110k) is reasonable based on typical stale-listing flexibility.
- 8 sale attempts since 19y ago with the ask held roughly flat each time — persistent listings suggest the price (not the market) is what's stuck; bring a comps-based counter.
Risks & watch-outs
- Watch-outs: HOA is 24% of rent.
- Climate carrying-cost: extreme-heat days projected 7→21/yr by 2055 (HVAC capex compounding) — expect insurance premiums to compound above CPI over the hold.
Questions for the listing agent
- It's been on market 122 days. Have you received any prior offers? Is the seller open to a 12% concession, seller financing, or rate buy-down credit?
- Built in 1971 — when were the roof, HVAC, electrical panel, plumbing, and water heater last replaced?
- What does the HOA fee cover, when was the last increase, and are there any pending special assessments or reserve-fund shortfalls?
- Any open or pending special assessments — roof, HVAC, plumbing, elevator, façade? What's the per-unit balance and payoff schedule, and is the seller paying it off at close or rolling it to the buyer?
- Why hasn't it sold? Are there any deal-killer items the seller is aware of (foundation, flood, title, zoning, code violations)?
- Is there a deadline driving the sale (1031 exchange, divorce, estate, relocation)? That informs how much negotiation room exists.
- What's the average days-on-market for RENTAL listings here right now (not sales)? A rising rental-DOM trend means longer vacancies and softer asking-rent achievability than the comps imply.
- What's the recent tenant-quality profile in this submarket — average credit score on applications, eviction rate, late-payment / NSF rate, and stable-employment percentage? A property-management company in the area should have these aggregated.
- How much new apartment / multifamily construction is in the pipeline within 1–3 miles? Heavy new supply (>2% of stock underway) typically softens rents 12–24 months out; light construction supports rent growth.
Investment metrics
- 1% rule
- 1.31% ✓
- Cap rate
- 7.31%
- Cash-on-cash
- 3.64%
- DSCR
- 1.16
- GRM
- 6.4
CMA / ARV
No comps found within radius.
Projected returns pro-forma
-3.0% appreciation · 4.65% rent growth · sell at horizon
- IRR
- -8.0%
- Equity multiple
- 0.70×
- Total profit
- $-10,511
- Equity at exit
- $18,638
- IRR
- 4.3%
- Equity multiple
- 1.35×
- Total profit
- $12,171
- Equity at exit
- $10,808
Cash invested: $35,000 (down + closing). Projections, not guarantees.
Landlord ↔ Tenant lean methodology
- Overall (STATE)
- 83 Strongly Landlord-Friendly
- State Kentucky
- 83 Strongly Landlord-Friendly · R+16
- County
- — inherits STATE
- City
- — inherits STATE
ZIP-level market 40223
- Rents YoY
- 4.7%
- Active inventory
- 103
- Price-to-rent
- 6.4×
Monthly cashflow live
- Estimated rent
- $1,635 high interval (Pro) →
- Mortgage (P&I)
- −$656
- Tax from tax record
- −$91 /mo · $1,095/yr
- Insurance
- −$52
- HOA
- −$387
- Vacancy / Maint / Mgmt
- −$343
- Net cashflow
- $106
Break-even live
UW: 25.0% down · 7.5% · 30yr · 1.5% tax · 5.0% vac · 8.0% maint · 8.0% mgmt
Financing live
Cash to close
- Down payment
- $31,250
- Closing costs
- $3,750
- Reserves months
- —
- Total cash needed
- —
Loan-product check · same deal, 3 products live
Conventional
25% down · 7.5% · 30yr
- Down + closing
- —
- Monthly P&I
- —
- Monthly cashflow
- —
- DSCR
- —
- Eligible?
- —
Personal DTI + credit; lowest rate.
DSCR
20% down · 8.5% · 30yr
- Down + closing
- —
- Monthly P&I
- —
- Monthly cashflow
- —
- DSCR
- —
- Eligible?
- —
No personal income docs; deal must DSCR.
Hard money
10% down · 12.0% · 12mo
- Down + closing
- —
- Monthly P&I
- —
- Monthly cashflow
- —
- DSCR
- —
- Eligible?
- —
Short-term bridge; refi at stabilization.
Rent comps 16 comps
| Address | Beds | Baths | Sqft | Rent | $/sqft | DOM | Units | Dist |
|---|---|---|---|---|---|---|---|---|
| 500 La Fontenay Ct Louisville, KY | 2.0–3.0 | 2.0 | 1300 | $1,299 | $1.00 | 1d | 4 | 0.08mi |
| 175 La Fontenay Dr Louisville, KY | 1.0–3.0 | 1.0–2.5 | 1202 | $1,729 | $1.44 | 1d | 15 | 0.12mi |
| 203 S Dorsey Ln Louisville, KY | 2.0 | 2.0 | 1400 | $2,200 | $1.57 | 21d | 1 | 0.18mi |
| 10331 Shelbyville Rd Louisville, KY | 2.0 | 2.0 | 1111 | $1,550 | $1.40 | 3d | 1 | 0.22mi |
| 407 Charlestown Ct Douglass Hills, KY | 1.0–3.0 | 1.0–2.5 | 1175 | $1,496 | $1.27 | 1d | 10 | 0.43mi |
| 9811 Vieux Carre Dr Louisville, KY | 1.0–3.0 | 1.0–2.5 | 1044 | $1,444 | $1.38 | 1d | 15 | 0.82mi |
| 201 Heritage Hill Trl Louisville, KY | 1.0–2.0 | 1.0–2.5 | 946 | $1,650 | $1.74 | 1d | 5 | 0.85mi |
| 665 Amherst Pl Louisville, KY | 2.0 | 1.5 | 1000 | $1,569 | $1.57 | 3d | 6 | 0.93mi |
| 9800 Willow Brook Cir Louisville, KY | 1.0–2.0 | 1.0–2.5 | 1004 | $2,310 | $2.30 | 3d | 35 | 1.00mi |
| 11700 Frank Ave Louisville, KY | 3.0 | 2.0 | 1312 | $2,100 | $1.60 | 14d | 1 | 1.14mi |
| 9500 Williamsburg Plz Louisville, KY | 1.0–2.0 | 1.0–2.0 | 966 | $2,227 | $2.30 | 10d | 8 | 1.17mi |
| 8916 Marksfield Rd Louisville, KY | 1.0–3.0 | 1.0–2.0 | 1425 | $1,670 | $1.17 | 2d | 27 | 1.29mi |
| 1000 Stone Spring Way Louisville, KY | 1.0–3.0 | 1.0–2.5 | 1049 | $1,688 | $1.61 | 1d | 54 | 1.30mi |
| 11803 Duane Point Cir Louisville, KY | 1.0 | 1.0 | 860 | $1,250 | $1.45 | 3d | 1 | 1.43mi |
| 11803 Duane Point Cir Louisville, KY | 2.0 | 2.0 | 1030 | $1,450 | $1.41 | 21d | 1 | 1.43mi |
| 11803 Duane Point Cir Unit 02101 Louisville, KY | 2.0 | 2.0 | 1030 | $1,450 | $1.41 | 23d | 1 | 1.45mi |
HOA detail condo
- Monthly dues
- $387 · $4,644/yr
- Assessments
- None detected in remarks — confirm with the listing agent.
Listing history 30 events
-
2026-06-18days on market $125,000 Active 122 DOM
-
2026-06-17days on market $125,000 Active 121 DOM
-
2026-06-16days on market $125,000 Active 120 DOM
-
2026-06-15days on market $125,000 Active 119 DOM
-
2026-06-13days on market $125,000 Active 117 DOM
-
2026-06-10days on market $125,000 Active 114 DOM
-
2026-06-09days on market $125,000 Active 113 DOM
-
2026-06-08days on market $125,000 Active 112 DOM
-
2026-06-07days on market $125,000 Active 111 DOM
-
2026-06-03days on market $125,000 Active 107 DOM
-
2026-06-02days on market $125,000 Active 106 DOM
-
2026-06-01days on market $125,000 Active 105 DOM
-
2026-05-31days on market $125,000 Active 104 DOM
-
2026-04-11price $125,000
-
2026-02-16$130,000 Active
-
2025-12-31historical
-
2025-10-23price $133,000
-
2025-06-13$135,000 Active
-
2010-11-08historical
-
2010-05-08$121,900
-
2009-02-25soldstatus $122,200
-
2008-10-29historical
-
2008-10-28$122,200
-
2008-05-14$121,900
-
2008-05-13historical
-
2007-11-14$121,900
-
2007-11-08historical
-
2007-05-11$115,900
-
2007-05-11historical
-
2007-02-19$113,900
ⓘ Source: listings_history table (triggers on properties + properties_extension) + one-shot
backfill from property_details.listing_events for pre-trigger history.
Tax reassessment forecast KY · Resets to sale price
- Current annual tax
- $1,095 · $91/mo
- Projected year-2 tax
- $1,095 · $91/mo
- Expected delta
- $0/yr ($0/mo · 0.0%)
ⓘ Screening estimate from a state-policy table — verify with the county assessor before closing.
Climate risk First Street
- Flood 1/10 Low FEMA zone X (unshaded) · 0% chance over 30 yrs
- Wildfire 1/10 Low
- Heat 5/10 Major 7 d/yr ≥103°F today · 21 d/yr by 30 yrs out
- Wind 2/10 Low 2% chance of damaging wind over 30 yrs
- Air quality 3/10 Moderate 2 unhealthy d/yr today · 5 by 30 yrs out
Nearby sold comps map
Loading sold comps map…
Walkable amenities ~0.75 mi
Loading nearby amenities…
Taxation est. · year 1
- Rental income
- $19,626
- − Mortgage interest
- −$7,002
- − Property taxes
- −$1,095
- − Insurance
- −$625
- − Repairs & maintenance
- −$1,570
- − Management
- −$1,570
- − HOA
- −$4,644
- − Depreciation
- −$3,636
- Taxable loss
- −$517
- Est. tax savings @ 24.0%
- +$124
- After-tax cash flow
- $1,398/yr
For passive investors: Depreciation is non-cash, so a rental often shows a tax loss while cash-flowing — sheltering income. Rental losses are passive: they offset passive income freely, and up to $25,000/yr can offset ordinary (W-2) income if you actively participate and your MAGI is under $100k (phasing out to $0 by $150k); unused losses carry forward. On sale, claimed depreciation is recaptured at up to 25%, and gains may owe capital-gains tax (a 1031 exchange can defer both). Figures are a year-1 estimate at your 24.0% rate — not tax advice; consult a CPA.
Schools (NCES district)
- District
- Jefferson County
- NCES district ID
- 2102990
- Math proficiency
- 19% ▼ -17.00%
- Reading proficiency
- 35% ▼ -11.00%
- Median HH income
- $47,885
- Composite
- 23.45/100
- National rank
- #7884
- State rank
- #121 of 165 in KY
Livability — Douglass Hills
- Score
- 76/100
- State rank
- #93
- US rank
- #3759
Category grades
Schools grade is shown separately in the Schools card above.
Census & demographics
- Census place
- Douglass Hills, KY
- County
- Jefferson County · 790,184 people
- Metro
- Louisville/Jefferson County, KY-IN
- Population (ZIP)
- 22,798
- Household income
- $96,607
- Rent vs Own
- Severe rent burden
- 437.0
Population outlook (Jefferson County) Hauer SSP2
- Today (2025)
- 823,112 people
- By 2030
- 849,343 · +3.2%
- By 2040
- 895,696 · +8.8%
- By 2050
- 933,630 · +13.4%
- By 2075
- 1,028,262 · +24.9%
- By 2100
- 1,072,675 · +30.3%
Race, ethnicity, and origin ACS 2023
- Neighborhood character
- Predominantly White (83%)
- Race & ethnicity
- White 83% Black 8% Hispanic / Latino 4% Two or more races 4% Asian 3%
- Common ancestry
- Italian 3% Lithuanian 2% Slovak 2%
- Foreign-born
- 6% · Canada
- Languages at home
- 93% English-only · Spanish 3% Other Asian/Pacific 1% Other Indo-European 1%
Political lean MEDSL · Jefferson
- 2024 margin
- D (+16.6) · D 57.4% · R 40.9% · Other 1.7%
- 2008→2024 swing
- +4.5pp toward D · 2008: 12.0pp · 2024: 16.6pp
- All cycles
- 2024: D+16.6 2020: D+20.1 2016: D+13.3 2012: D+11.1 2008: D+12.0
Not yet ingested
- Civics
- —
Market trends
- HPI YoY
- ▼ -286.49%
- Current HPI
- 231.588
- Rent YoY
- ▲ 4.65%
- Metro
- Louisville/Jefferson County, KY-IN
- State GDP YoY
- ▲ 1.81%
- F500 in state
- 4
Industry mix (Fortune 500 HQ in KY)
| Industry | F500 HQs | Revenue |
|---|---|---|
| Healthcare | 1 | $118B |
|
||
| Food / Beverage | 1 | $7B |
|
||
Price history
+9.7% since first listed17 events — show timeline
- 2026-04-11 Price Changed $125,000 Metro Search MLS
- 2026-02-16 Listed $130,000 Metro Search MLS
- 2025-12-31 Listing Removed — Metro Search MLS
- 2025-10-23 Price Changed $133,000 Metro Search MLS
- 2025-06-13 Listed $135,000 Metro Search MLS
- 2010-11-08 Listing Removed — Metro Search MLS
- 2010-05-08 Listed $121,900 Metro Search MLS
- 2009-02-25 Sold (MLS) $122,200 Metro Search MLS
- 2008-10-29 Listing Removed — Metro Search MLS
- 2008-10-28 Listed $122,200 Metro Search MLS
- 2008-05-14 Listed $121,900 Metro Search MLS
- 2008-05-13 Listing Removed — Metro Search MLS
- 2007-11-14 Listed $121,900 Metro Search MLS
- 2007-11-08 Listing Removed — Metro Search MLS
- 2007-05-11 Listing Removed — Metro Search MLS
- 2007-05-11 Listed $115,900 Metro Search MLS
- 2007-02-19 Listed $113,900 Metro Search MLS
Property tax history
-1.5%/yrLatest (2025): $1,095 · -1.9% YoY. Source: county tax records.
Cash-flow waterfall
monthlySold comps — $/sqft
last 12 mo · ≤1 miLoading sold comps…