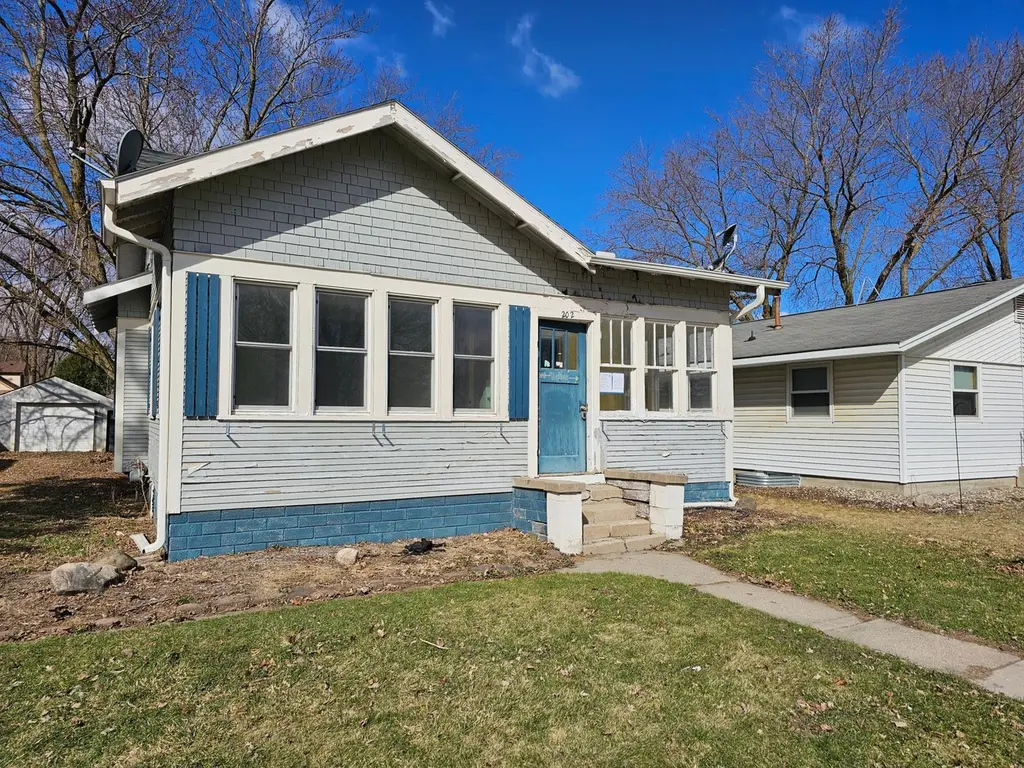
202 5th St SE · Montgomery, MN
Flood risk 1/10 · Minimal
- FEMA flood zone
- X
- Chance of flooding over 30 yrs
- 0.0%
- Est. flood insurance / yr
- $507 – $1,088
Fire risk 1/10 · Minimal
- Est. fire insurance / yr
- $888 – $1,650
Heat risk 2/10 · Minimal
- Hot days now (above 99°F)
- 7 days/yr
- Hot days in 30 yrs
- 15 days/yr
Wind risk 2/10 · Minimal
- Chance of severe wind over 30 yrs
- —
Air-quality risk 2/10 · Minimal
- Unhealthy air days now
- 1 days/yr
- Unhealthy air days in 30 yrs
- 1 days/yr
Risk factors via First Street. Map © Google.
Why this score? — see what drove the B- grade
The composite is a weighted blend of 9 inputs, each scored 0–100. Each bar is that input's sub-score; the figure is the points it added to the 100-point composite (weight × sub-score).
- Cash flow +24.8/30.0
- ARV discount +15.0/15.0
- DSCR +8.0/10.0
- 1% rule +6.4/10.0
- Schools +5.0/10.0
- Livability +3.4/5.0
- Rent growth +2.5/5.0
- Condition / age +2.5/5.0
- Appreciation +0.0/10.0
$165,000
🖨 Deal sheet 📄 Offer letter ✓ Due diligence
Listing remarks MLS
SPECIAL $100 DOWN PAYMENT PROGRAM. REHAB FUND UP TO $11,000 WITH 203B WITH ESCROW. Great potential. 2 bedroom up, 2 bedrooms on m ain level, 1 bath. Large Large back yard. Basement unfinished, but could be converted into living space with added improvements. Investor are welcome after 15 days An older home is made new again! It's hard to imagine it was built in 1928, unless you are in the unfinished basement where the mechanicals are. Minor repairs and some painting and cleaning. Floorplan was re-arranged for better flow and convenience. Features include knockdown ceiling texture, recessed lighting, newer bathrooms, laundry/mudroom, ceiling fans in all bedrooms, newer flooring throughout..
Key facts
- 6,577 sq ft lot
- Garage
- Built 1928
Neighborhood map
What this means for you Summary
Snapshot
- This is a 4-bed/1.0-bath single-family listed at $165k.
Deal economics
- At list price, monthly cash flow is $347 ($4k/yr) — positive.
- The deal already cash-flows at list — no discount required.
- Meets the 1% rule at list price ($2k rent vs $165k).
- Recommended offer: $155k (6.0% below list) — sets the bar for market timing.
- Cap rate 8.8% vs local median 3.2% in Montgomery — top-decile yield for the area; either an underpriced asset or a hidden risk that comps aren't pricing in. Stress-test before assuming the spread holds.
Location & tenants
- Location reads 68/100 on livability (#399 in MN) — a middle-class / working-renter tenant base. Strengths: crime A+, cost of living A+, housing A+; Watch: amenities F, commute F, health & safety F.
- Market conditions: 80 active listings in the ZIP; 60 units permitted in Le Sueur County in 2024 (0 in 5+ unit buildings).
Forward outlook
- Local home prices are declining (-3.0%/yr); year-one equity from $1k of loan paydown is wiped out by about $5k of value loss. Plan a longer hold.
- Le Sueur County population projected to shrink 8% by 2050 — rents likely to lag national; underwrite the cash flow, not the appreciation.
Negotiation context
- It's been on market 66 days — a 6% lower offer ($155k) is reasonable based on typical stale-listing flexibility.
- 9 sale attempts since 30y ago with the ask held roughly flat each time — persistent listings suggest the price (not the market) is what's stuck; bring a comps-based counter.
Risks & watch-outs
- Watch-outs: built in 1928 — expect roof / HVAC / electrical / plumbing capex.
Questions for the listing agent
- It's been on market 66 days. Have you received any prior offers? Is the seller open to a 6% concession, seller financing, or rate buy-down credit?
- Built in 1928 — when were the roof, HVAC, electrical panel, plumbing, and water heater last replaced?
- Why hasn't it sold? Are there any deal-killer items the seller is aware of (foundation, flood, title, zoning, code violations)?
- Is there a deadline driving the sale (1031 exchange, divorce, estate, relocation)? That informs how much negotiation room exists.
- What's the average days-on-market for RENTAL listings here right now (not sales)? A rising rental-DOM trend means longer vacancies and softer asking-rent achievability than the comps imply.
- What's the recent tenant-quality profile in this submarket — average credit score on applications, eviction rate, late-payment / NSF rate, and stable-employment percentage? A property-management company in the area should have these aggregated.
- How much new for-sale + rental construction is in the pipeline within 1–3 miles? Heavy new supply typically softens prices + rents 12–24 months out; constrained supply supports both.
Investment metrics
- 1% rule
- 1.14% ✓
- Cap rate
- 8.81%
- Cash-on-cash
- 9.00%
- DSCR
- 1.40
- GRM
- 7.3
CMA / ARV
- ARV (median comp)
- $293,311
- List price
- $165,000
- Delta
- -43.75%
- Verdict
- UNDERPRICED
- Comps
- 3 within 1.0 mi
Projected returns pro-forma
-3.0% appreciation · 3.0% rent growth · sell at horizon
- IRR
- -2.7%
- Equity multiple
- 0.90×
- Total profit
- $-4,626
- Equity at exit
- $24,602
- IRR
- 7.1%
- Equity multiple
- 1.53×
- Total profit
- $24,531
- Equity at exit
- $14,266
Cash invested: $46,200 (down + closing). Projections, not guarantees.
Landlord ↔ Tenant lean methodology
- Overall (STATE)
- 46 Balanced
- State Minnesota
- 46 Balanced · D+2
- County
- — inherits STATE
- City
- — inherits STATE
ZIP-level market 56069
- Home prices YoY
- -15.8%
- Active inventory
- 80
- Price-to-rent
- 7.3×
Monthly cashflow live
- Estimated rent
- $1,888 medium interval (Pro) →
- Mortgage (P&I)
- −$865
- Tax from tax record
- −$210 /mo · $2,526/yr
- Insurance
- −$69
- HOA
- −$0
- Vacancy / Maint / Mgmt
- −$396
- Net cashflow
- $347
Break-even live
UW: 25.0% down · 7.5% · 30yr · 1.5% tax · 5.0% vac · 8.0% maint · 8.0% mgmt
Financing live
Cash to close
- Down payment
- $41,250
- Closing costs
- $4,950
- Reserves months
- —
- Total cash needed
- —
Loan-product check · same deal, 3 products live
Conventional
25% down · 7.5% · 30yr
- Down + closing
- —
- Monthly P&I
- —
- Monthly cashflow
- —
- DSCR
- —
- Eligible?
- —
Personal DTI + credit; lowest rate.
DSCR
20% down · 8.5% · 30yr
- Down + closing
- —
- Monthly P&I
- —
- Monthly cashflow
- —
- DSCR
- —
- Eligible?
- —
No personal income docs; deal must DSCR.
Hard money
10% down · 12.0% · 12mo
- Down + closing
- —
- Monthly P&I
- —
- Monthly cashflow
- —
- DSCR
- —
- Eligible?
- —
Short-term bridge; refi at stabilization.
Listing history 43 events
-
2026-06-19days on market $165,000 Active 66 DOM
-
2026-06-18days on market $165,000 Active 65 DOM
-
2026-06-17days on market $165,000 Active 64 DOM
-
2026-06-16days on market $165,000 Active 63 DOM
-
2026-06-15days on market $165,000 Active 62 DOM
-
2026-06-14days on market $165,000 Active 60 DOM
-
2026-06-12days on market $165,000 Active 59 DOM
-
2026-06-09days on market $165,000 Active 56 DOM
-
2026-06-08days on market $165,000 Active 55 DOM
-
2026-06-07statusdays on market $165,000 Active 54 DOM
-
2026-06-02days on market $165,000 Contingent - Other 49 DOM
-
2026-06-01days on market $165,000 Contingent - Other 48 DOM
-
2026-05-31days on market $165,000 Contingent - Other 47 DOM
-
2026-05-30days on market $165,000 Contingent - Other 46 DOM
-
2026-05-18historical Contingent - Other 702-char remark
Show marketing remark (702 chars)
SPECIAL $100 DOWN PAYMENT PROGRAM. REHAB FUND UP TO $11,000 WITH 203B WITH ESCROW. Great potential. 2 bedroom up, 2 bedrooms on m ain level, 1 bath. Large Large back yard. Basement unfinished, but could be converted into living space with added improvements. Investor are welcome after 15 days An older home is made new again! It's hard to imagine it was built in 1928, unless you are in the unfinished basement where the mechanicals are. Minor repairs and some painting and cleaning. Floorplan was re-arranged for better flow and convenience. Features include knockdown ceiling texture, recessed lighting, newer bathrooms, laundry/mudroom, ceiling fans in all bedrooms, newer flooring throughout..
-
2026-04-14$165,000 Active 702-char remark
Show marketing remark (702 chars)
SPECIAL $100 DOWN PAYMENT PROGRAM. REHAB FUND UP TO $11,000 WITH 203B WITH ESCROW. Great potential. 2 bedroom up, 2 bedrooms on m ain level, 1 bath. Large Large back yard. Basement unfinished, but could be converted into living space with added improvements. Investor are welcome after 15 days An older home is made new again! It's hard to imagine it was built in 1928, unless you are in the unfinished basement where the mechanicals are. Minor repairs and some painting and cleaning. Floorplan was re-arranged for better flow and convenience. Features include knockdown ceiling texture, recessed lighting, newer bathrooms, laundry/mudroom, ceiling fans in all bedrooms, newer flooring throughout..
-
2023-07-26status Pending
-
2023-07-26historical
-
2023-07-21$180,000 Active
-
2019-07-01soldstatus $164,900 Sold
-
2019-07-01soldstatus $164,900
-
2019-05-22status Pending
-
2019-05-13historical Contingent - Inspection
-
2019-05-08$159,900 Active
-
2016-04-30historical
-
2016-04-05price $129,900
-
2016-03-11price $134,900
-
2015-10-28$139,900 Active
-
2014-06-21historical
-
2014-04-11$124,900 Active
-
2007-10-26soldstatus $106,000
-
2007-09-20historical
-
2007-07-11$120,000
-
2007-05-15historical
-
2007-02-28$134,900
-
2004-06-10soldstatus $144,900
-
2004-05-21soldstatus $144,900
-
2004-04-26historical
-
2004-04-05$144,900
-
1996-02-29soldstatus $71,500
-
1996-02-29soldstatus $71,500
-
1996-01-30historical
-
1996-01-29$68,900
ⓘ Source: listings_history table (triggers on properties + properties_extension) + one-shot
backfill from property_details.listing_events for pre-trigger history.
Tax reassessment forecast MN · Partial reset (capped growth)
- Current annual tax
- $2,526 · $210/mo
- Projected year-2 tax
- $2,526 · $210/mo
- Expected delta
- $0/yr ($0/mo · 0.0%)
ⓘ Screening estimate from a state-policy table — verify with the county assessor before closing.
Climate risk First Street
- Flood 1/10 Low FEMA zone X · 0% chance over 30 yrs
- Wildfire 1/10 Low
- Heat 2/10 Low 7 d/yr ≥99°F today · 15 d/yr by 30 yrs out
- Wind 2/10 Low
- Air quality 2/10 Low 1 unhealthy d/yr today · 1 by 30 yrs out
Nearby sold comps map
Loading sold comps map…
Walkable amenities ~0.75 mi
Loading nearby amenities…
Taxation est. · year 1
- Rental income
- $22,651
- − Mortgage interest
- −$9,243
- − Property taxes
- −$2,526
- − Insurance
- −$825
- − Repairs & maintenance
- −$1,812
- − Management
- −$1,812
- − Depreciation
- −$4,800
- Taxable income
- $1,634
- Est. tax owed @ 24.0%
- −$392
- After-tax cash flow
- $3,768/yr
For passive investors: Depreciation is non-cash, so a rental often shows a tax loss while cash-flowing — sheltering income. Rental losses are passive: they offset passive income freely, and up to $25,000/yr can offset ordinary (W-2) income if you actively participate and your MAGI is under $100k (phasing out to $0 by $150k); unused losses carry forward. On sale, claimed depreciation is recaptured at up to 25%, and gains may owe capital-gains tax (a 1031 exchange can defer both). Figures are a year-1 estimate at your 24.0% rate — not tax advice; consult a CPA.
Schools (NCES district)
No district data.
Livability — Montgomery
- Score
- 68/100
- State rank
- #399
- US rank
- #9396
Category grades
Schools grade is shown separately in the Schools card above.
Census & demographics
- Census place
- Montgomery, MN
- Population (ZIP)
- 4,948
Population outlook (Le Sueur County) Hauer SSP2
- Today (2025)
- 27,622 people
- By 2030
- 27,346 · -1.0%
- By 2040
- 26,451 · -4.2%
- By 2050
- 25,299 · -8.4%
- By 2075
- 23,188 · -16.1%
- By 2100
- 21,103 · -23.6%
Race, ethnicity, and origin ACS 2023
- Neighborhood character
- Predominantly White (93%)
- Race & ethnicity
- White 93% Two or more races 4% Hispanic / Latino 3%
- Common ancestry
- Portuguese 6% Romanian 5% Lithuanian 3%
- Foreign-born
- 2% · Canada
- Languages at home
- 96% English-only · Spanish 2% Russian/Polish/Slavic 1%
Political lean MEDSL · Le Sueur
- 2024 margin
- Solid R (+33.7) · D 32.4% · R 66.0% · Other 1.6%
- 2008→2024 swing
- -29.4pp toward R · 2008: -4.3pp · 2024: -33.7pp
- All cycles
- 2024: R+33.7 2020: R+30.3 2016: R+30.7 2012: R+6.5 2008: R+4.3
Not yet ingested
- Civics
- —
Market trends
- HPI YoY
- ▼ -50.12%
- Current HPI
- 266.5331
- Rent YoY
- —
- Metro
- —
- State GDP YoY
- ▲ 2.41%
- F500 in state
- 34
Industry mix (Fortune 500 HQ in MN)
| Industry | F500 HQs | Revenue |
|---|---|---|
| Healthcare | 2 | $407B |
|
||
| Retail | 2 | $150B |
|
||
| Consumer Goods | 2 | $32B |
|
||
| Industrial Machinery | 2 | $6B |
|
||
| Agriculture | 1 | $40B |
|
||
| Healthcare / Medical Devices | 1 | $32B |
|
||
Price history
+139.5% since first listed29 events — show timeline
- 2026-05-18 Contingent — NORTHSTARMLS as Distributed by MLS Grid
- 2026-04-14 Listed $165,000 NORTHSTARMLS as Distributed by MLS Grid
- 2023-07-26 Pending — NORTHSTARMLS as Distributed by MLS Grid
- 2023-07-26 Listing Removed — NORTHSTARMLS as Distributed by MLS Grid
- 2023-07-21 Listed $180,000 NORTHSTARMLS as Distributed by MLS Grid
- 2019-07-01 Sold (Public Records) $164,900 Public Records
- 2019-07-01 Sold (MLS) $164,900 NORTHSTARMLS as Distributed by MLS Grid
- 2019-05-22 Pending — NORTHSTARMLS as Distributed by MLS Grid
- 2019-05-13 Contingent — NORTHSTARMLS as Distributed by MLS Grid
- 2019-05-08 Listed $159,900 NORTHSTARMLS as Distributed by MLS Grid
- 2016-04-30 Listing Removed — NORTHSTARMLS as Distributed by MLS Grid
- 2016-04-05 Price Changed $129,900 NORTHSTARMLS as Distributed by MLS Grid
- 2016-03-11 Price Changed $134,900 NORTHSTARMLS as Distributed by MLS Grid
- 2015-10-28 Listed $139,900 NORTHSTARMLS as Distributed by MLS Grid
- 2014-06-21 Listing Removed — NORTHSTARMLS as Distributed by MLS Grid
- 2014-04-11 Listed $124,900 NORTHSTARMLS as Distributed by MLS Grid
- 2007-10-26 Sold (MLS) $106,000 NORTHSTARMLS as Distributed by MLS Grid
- 2007-09-20 Listing Removed — NORTHSTARMLS as Distributed by MLS Grid
- 2007-07-11 Listed $120,000 NORTHSTARMLS as Distributed by MLS Grid
- 2007-05-15 Listing Removed — NORTHSTARMLS as Distributed by MLS Grid
- 2007-02-28 Listed $134,900 NORTHSTARMLS as Distributed by MLS Grid
- 2004-06-10 Sold (Public Records) $144,900 Public Records
- 2004-05-21 Sold (MLS) $144,900 NORTHSTARMLS as Distributed by MLS Grid
- 2004-04-26 Listing Removed — NORTHSTARMLS as Distributed by MLS Grid
- 2004-04-05 Listed $144,900 NORTHSTARMLS as Distributed by MLS Grid
- 1996-02-29 Sold (Public Records) $71,500 Public Records
- 1996-02-29 Sold (MLS) $71,500 NORTHSTARMLS as Distributed by MLS Grid
- 1996-01-30 Listing Removed — NORTHSTARMLS as Distributed by MLS Grid
- 1996-01-29 Listed $68,900 NORTHSTARMLS as Distributed by MLS Grid
Property tax history
-2.7%/yrLatest (2025): $2,526 · -7.4% YoY. Source: county tax records.
Cash-flow waterfall
monthlySold comps — $/sqft
last 12 mo · ≤1 miLoading sold comps…