679 19th St W · Dickinson, ND
Flood risk No data
- FEMA flood zone
- —
- Chance of flooding over 30 yrs
- —
- Est. flood insurance / yr
- —
Fire risk No data
- Est. fire insurance / yr
- —
Heat risk No data
- Hot days now (above threshold)
- —
- Hot days in 30 yrs
- —
Wind risk No data
- Chance of severe wind over 30 yrs
- —
Air-quality risk No data
- Unhealthy air days now
- —
- Unhealthy air days in 30 yrs
- —
Risk factors via First Street. Map © Google.
Why this score? — see what drove the B- grade
The composite is a weighted blend of 9 inputs, each scored 0–100. Each bar is that input's sub-score; the figure is the points it added to the 100-point composite (weight × sub-score).
- Cash flow +30.0/30.0
- 1% rule +10.0/10.0
- DSCR +10.0/10.0
- ARV discount +7.5/15.0
- Livability +3.8/5.0
- Schools +3.5/10.0
- Rent growth +3.0/5.0
- Condition / age +1.0/5.0
- Appreciation +0.0/10.0
$65,000
🖨 Deal sheet (PDF) 📄 Offer letter ✓ Due diligence
Listing remarks MLS
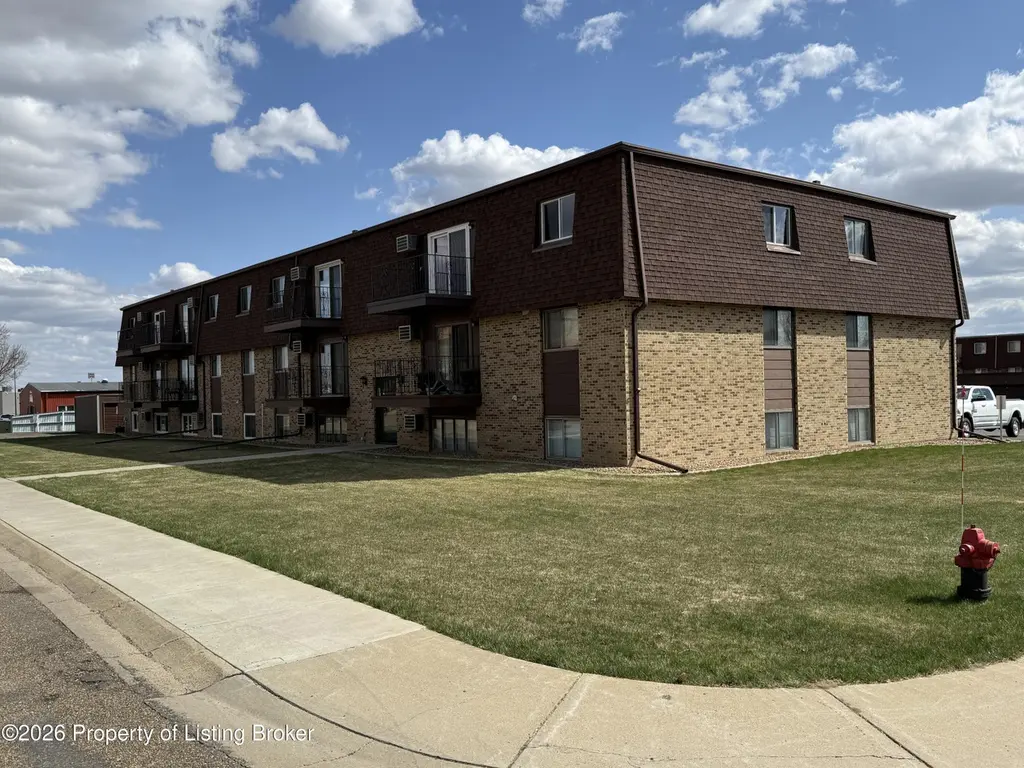
Beautiful 1 bedroom condo with garage. Call for a showing!
Key facts
- 1,319 sq ft lot
- Garage
- Built 1979
Property features AI
Exterior
- Parking: Garage (1 space)
- Utilities: Public sewer
- Home design: Single-family residence; Residential property; Zoned RMD
- Construction: No basement; No foundation details provided
- Exterior features: Public sewer
Interior
- Kitchen: Range; Refrigerator; Gas water heater
- Bathrooms: 1 full bathroom
- Heating & cooling: Has heating; Has cooling
- Interior features: Eat-in kitchen; Window coverings
Neighborhood map
What this means for you Summary
Snapshot
- This is a 1-bed/1.0-bath condo listed at $65k. Condition is rated poor.
Deal economics
- At list price, monthly cash flow is $364 ($4k/yr) — positive.
- The deal already cash-flows at list — no discount required.
- Meets the 1% rule at list price ($1k rent vs $65k).
- Recommended offer: $63k (3.0% below list) — sets the bar for market timing.
- Cap rate 13.0% vs local median 2.9% in Dickinson — top-decile yield for the area; either an underpriced asset or a hidden risk that comps aren't pricing in. Stress-test before assuming the spread holds.
Location & tenants
- Location reads 76/100 on livability (#12 in ND, #3,334 nationally) — a middle-class / working-renter tenant base. Strengths: cost of living A+, housing A+, health & safety A+; Watch: amenities F, commute F.
- Dickinson 1 (town): math 35% / reading 43% proficiency, ranked #29 of 53 in ND (top 55%) — families likely to look elsewhere, expect single-tenant / working-renter base with shorter leases.
- Market conditions: Rents rising (+1.9%/yr); 236 active listings in the ZIP; solid renter incomes; 20 units permitted in Stark County in 2024 (0 in 5+ unit buildings).
- This rent is only 14% of the median local income ($86k/yr) — well below the 30% rent-burden line; pricing power to push rent on renewal without tenant pushback.
Forward outlook
- Local home prices are declining (-3.0%/yr); year-one equity from $449 of loan paydown is wiped out by about $2k of value loss. Plan a longer hold.
- Stark County population projected at +120% by 2050 — long-run rental-demand tailwind backs the buy-and-hold thesis.
- At projected returns (-3.0% appreciation + 1.9% rent growth), your $18k cash investment doubles in ~6 years — after that, you're playing with house money.
Negotiation context
- It's been on market 52 days — a 3% lower offer ($63k) is reasonable based on typical stale-listing flexibility.
- 6 sale attempts since 5y ago with the ask held roughly flat each time — persistent listings suggest the price (not the market) is what's stuck; bring a comps-based counter.
Questions for the listing agent
- It's been on market 52 days. Have you received any prior offers? Is the seller open to a 3% concession, seller financing, or rate buy-down credit?
- Have any recent inspections been done? Can we get a copy of the seller's disclosures and any deferred-maintenance estimates?
- Built in 1979 — when were the roof, HVAC, electrical panel, plumbing, and water heater last replaced?
- Any open or pending special assessments — roof, HVAC, plumbing, elevator, façade? What's the per-unit balance and payoff schedule, and is the seller paying it off at close or rolling it to the buyer?
- Is there a deadline driving the sale (1031 exchange, divorce, estate, relocation)? That informs how much negotiation room exists.
- Schools are B-rated — typically a magnet for longer-tenancy family renters. What's the average tenant stay here, and is there a school-zone premium baked into asking?
- What's the average days-on-market for RENTAL listings here right now (not sales)? A rising rental-DOM trend means longer vacancies and softer asking-rent achievability than the comps imply.
- What's the recent tenant-quality profile in this submarket — average credit score on applications, eviction rate, late-payment / NSF rate, and stable-employment percentage? A property-management company in the area should have these aggregated.
- How much new apartment / multifamily construction is in the pipeline within 1–3 miles? Heavy new supply (>2% of stock underway) typically softens rents 12–24 months out; light construction supports rent growth.
Investment metrics
- 1% rule
- 1.58% ✓
- Cap rate
- 13.02%
- Cash-on-cash
- 24.02%
- DSCR
- 2.07
- GRM
- 5.3
CMA / ARV
No comps found within radius.
Projected returns pro-forma
-3.0% appreciation · 1.95% rent growth · sell at horizon
- IRR
- 16.1%
- Equity multiple
- 1.64×
- Total profit
- $11,613
- Equity at exit
- $9,692
- IRR
- 23.9%
- Equity multiple
- 2.96×
- Total profit
- $35,732
- Equity at exit
- $5,620
Cash invested: $18,200 (down + closing). Projections, not guarantees.
Landlord ↔ Tenant lean methodology
- Overall (STATE)
- 82 Strongly Landlord-Friendly
- State North Dakota
- 82 Strongly Landlord-Friendly · R+20
- County
- — inherits STATE
- City
- — inherits STATE
ZIP-level market 58601
- Rents YoY
- 1.9%
- Active inventory
- 236
- Price-to-rent
- 5.3×
Monthly cashflow live
- Estimated rent
- $1,030 medium interval (Pro) →
- Mortgage (P&I)
- −$341
- Tax est. 1.5%
- −$81 /mo · $975/yr
- Insurance
- −$27
- HOA
- −$0
- Vacancy / Maint / Mgmt
- −$216
- Net cashflow
- $364
Break-even live
Sensitivity live
| Price | -10% $409 | -5% $387 | +0% $364 | +5% $342 | +10% $319 |
|---|---|---|---|---|---|
| Rent | -10% $283 | -5% $324 | +0% $364 | +5% $405 | +10% $446 |
| Rate | -1.0pp $397 | -0.5pp $381 | base $364 | +0.5pp $348 | +1.0pp $330 |
UW: 25.0% down · 7.5% · 30yr · 1.5% tax · 5.0% vac · 8.0% maint · 8.0% mgmt
Financing live
Cash to close
- Down payment
- $16,250
- Closing costs
- $1,950
- Reserves months
- —
- Total cash needed
- —
Loan-product check · same deal, 3 products live
Conventional
25% down · 7.5% · 30yr
- Down + closing
- —
- Monthly P&I
- —
- Monthly cashflow
- —
- DSCR
- —
- Eligible?
- —
Personal DTI + credit; lowest rate.
DSCR
20% down · 8.5% · 30yr
- Down + closing
- —
- Monthly P&I
- —
- Monthly cashflow
- —
- DSCR
- —
- Eligible?
- —
No personal income docs; deal must DSCR.
Hard money
10% down · 12.0% · 12mo
- Down + closing
- —
- Monthly P&I
- —
- Monthly cashflow
- —
- DSCR
- —
- Eligible?
- —
Short-term bridge; refi at stabilization.
HOA detail condo
- Monthly dues
- $0 · $0/yr
- Assessments
- None detected in remarks — confirm with the listing agent.
Listing history 30 events
-
2026-06-21days on market $65,000 Active 52 DOM
-
2026-06-19days on market $65,000 Active 50 DOM
-
2026-06-18days on market $65,000 Active 49 DOM
-
2026-06-17days on market $65,000 Active 48 DOM
-
2026-06-16days on market $65,000 Active 47 DOM
-
2026-06-15days on market $65,000 Active 46 DOM
-
2026-06-14days on market $65,000 Active 44 DOM
-
2026-06-12days on market $65,000 Active 43 DOM
-
2026-06-09days on market $65,000 Active 40 DOM
-
2026-06-08days on market $65,000 Active 39 DOM
-
2026-06-07days on market $65,000 Active 38 DOM
-
2026-06-05days on market $65,000 Active 35 DOM
-
2026-06-03days on market $65,000 Active 34 DOM
-
2026-06-02days on market $65,000 Active 33 DOM
-
2026-06-01days on market $65,000 Active 32 DOM
-
2026-05-31days on market $65,000 Active 31 DOM
-
2026-05-30days on market $65,000 Active 30 DOM
-
2026-04-30$65,000 Active
-
2026-04-29$65,000 Active 58-char remark
Show marketing remark (58 chars)
Beautiful 1 bedroom condo with garage. Call for a showing!
-
2025-11-20soldstatus Closed 233-char remark
Show marketing remark (233 chars)
Meticulously maintained one bedroom, one bathroom condo unit with custom cabinets from August Cabinetry, plush new carpet, and it's own private balcony. This unit does have it's own garage, and the building has laundry on each level!
-
2025-10-11historical Active Under Contract 233-char remark
Show marketing remark (233 chars)
Meticulously maintained one bedroom, one bathroom condo unit with custom cabinets from August Cabinetry, plush new carpet, and it's own private balcony. This unit does have it's own garage, and the building has laundry on each level!
-
2025-07-19$68,500 Active 233-char remark
Show marketing remark (233 chars)
Meticulously maintained one bedroom, one bathroom condo unit with custom cabinets from August Cabinetry, plush new carpet, and it's own private balcony. This unit does have it's own garage, and the building has laundry on each level!
-
2025-05-02soldstatus Closed
-
2025-03-21historical Active Under Contract
-
2025-03-06$72,500 Active
-
2024-09-24soldstatus Closed
-
2024-09-15historical Active Under Contract
-
2024-08-02$50,000 Active
-
2023-09-06historical
-
2021-05-08$49,000
ⓘ Source: listings_history table (triggers on properties + properties_extension) + one-shot
backfill from property_details.listing_events for pre-trigger history.
Nearby sold comps map
Loading sold comps map…
Walkable amenities ~0.75 mi
Loading nearby amenities…
Taxation est. · year 1
- Rental income
- $12,358
- − Mortgage interest
- −$3,641
- − Property taxes
- −$975
- − Insurance
- −$325
- − Repairs & maintenance
- −$989
- − Management
- −$989
- − Depreciation
- −$1,891
- Taxable income
- $3,549
- Est. tax owed @ 24.0%
- −$852
- After-tax cash flow
- $3,521/yr
For passive investors: Depreciation is non-cash, so a rental often shows a tax loss while cash-flowing — sheltering income. Rental losses are passive: they offset passive income freely, and up to $25,000/yr can offset ordinary (W-2) income if you actively participate and your MAGI is under $100k (phasing out to $0 by $150k); unused losses carry forward. On sale, claimed depreciation is recaptured at up to 25%, and gains may owe capital-gains tax (a 1031 exchange can defer both). Figures are a year-1 estimate at your 24.0% rate — not tax advice; consult a CPA.
Condition & rehab AI · 1 photo
This condo requires extensive repairs and updates to its exterior, roof, flooring, and interior walls, significantly impacting its resale and rental value.
Repairs flagged
- Major exterior siding — Severe weathering
- Major roof shingles — Significant wear
- Major flooring — Worn carpet
- Major interior walls — Painted walls with visible wear
Value-add opportunities
- Both repair and replace exterior siding — Improves curb appeal and structural integrity
- Both repair and replace roof shingles — Enhances structural integrity and appearance
- Both replace worn carpet — Enhances comfort and appearance
- Both paint interior walls — Enhances appearance and can hide wear
Renovation cost estimate screening
| Repair item | Severity | Est. cost |
|---|---|---|
| exterior siding · Severe weathering | Major | $15,000–50,000 |
| roof shingles · Significant wear | Major | $15,000–50,000 |
| flooring · Worn carpet | Major | $15,000–50,000 |
| interior walls · Painted walls with visible wear | Major | $15,000–50,000 |
| Total estimated repair cost · 4 items | $60,000–200,000 |
Value-add ROI direction
- Both repair and replace exterior siding — Improves curb appeal and structural integrity ↑
- Both repair and replace roof shingles — Enhances structural integrity and appearance ↑
- Both replace worn carpet — Enhances comfort and appearance ↑
- Both paint interior walls — Enhances appearance and can hide wear ↑
ⓘ Cost ranges are severity-bucket heuristics (US national rule-of-thumb). Get contractor quotes + a written scope before underwriting a rehab budget.
Schools (NCES district)
- District
- Dickinson 1
- NCES district ID
- 3800038
- Math proficiency
- 35% ▼ -12.00%
- Reading proficiency
- 43% ▼ -7.00%
- Median HH income
- $63,270
- Composite
- 34.9/100
- National rank
- #5080
- State rank
- #29 of 53 in ND
Livability — Dickinson
- Score
- 76/100
- State rank
- #12
- US rank
- #3334
Category grades
Schools grade is shown separately in the Schools card above.
Census & demographics
- Census place
- Dickinson, ND
- County
- Stark County · 29,916 people
- City population
- 29,916
- Metro
- Dickinson, ND
- Population (ZIP)
- 29,916
- Household income
- $85,821
- Rent vs Own
- Severe rent burden
- 813.0
Population outlook (Stark County) Hauer SSP2
- Today (2025)
- 50,426 people
- By 2030
- 60,812 · +20.6%
- By 2040
- 84,155 · +66.9%
- By 2050
- 110,718 · +119.6%
- By 2075
- 186,710 · +270.3%
- By 2100
- 264,902 · +425.3%
Race, ethnicity, and origin ACS 2023
- Neighborhood character
- Predominantly White (85%)
- Race & ethnicity
- White 85% Hispanic / Latino 7% Two or more races 5% Black 3% Asian 1%
- Hispanic origin (detail)
- Mexican 5%
- Common ancestry
- Portuguese 9% Scotch-Irish 2% Lithuanian 2%
- Foreign-born
- 4% · Canada, China
- Languages at home
- 92% English-only · Spanish 4% German/W. Germanic 1% Arabic 1%
Political lean MEDSL · Stark
- 2024 margin
- Solid R (+65.6) · D 16.5% · R 82.1% · Other 1.5%
- 2008→2024 swing
- -36.5pp toward R · 2008: -29.1pp · 2024: -65.6pp
- All cycles
- 2024: R+65.6 2020: R+63.9 2016: R+65.8 2012: R+49.4 2008: R+29.1
Not yet ingested
- Civics
- —
Market trends
- HPI YoY
- ▼ -133.57%
- Current HPI
- 188.1029
- Rent YoY
- ▲ 1.95%
- Metro
- Dickinson, ND
- State GDP YoY
- ▲ 2.09%
- F500 in state
- 2
Industry mix (Fortune 500 HQ in ND)
| Industry | F500 HQs | Revenue |
|---|---|---|
| Utilities / Construction | 1 | $6B |
|
||
Price history
+32.7% since first listed13 events — show timeline
- 2026-04-30 Listed $65,000 Badlands BOR MLS
- 2026-04-29 Listed $65,000 Badlands BOR MLS
- 2025-11-20 Sold (MLS) — Badlands BOR MLS
- 2025-10-11 Contingent — Badlands BOR MLS
- 2025-07-19 Listed $68,500 Badlands BOR MLS
- 2025-05-02 Sold (MLS) — Badlands BOR MLS
- 2025-03-21 Contingent — Badlands BOR MLS
- 2025-03-06 Listed $72,500 Badlands BOR MLS
- 2024-09-24 Sold (MLS) — Badlands BOR MLS
- 2024-09-15 Contingent — Badlands BOR MLS
- 2024-08-02 Listed $50,000 Badlands BOR MLS
- 2023-09-06 Delisted — Badlands BOR MLS
- 2021-05-08 Listed $49,000 Badlands BOR MLS
Cash-flow waterfall
monthlySold comps — $/sqft
last 12 mo · ≤1 miLoading sold comps…