9901 State Road 3 #98 · Eaton, IN
Flood risk No data
- FEMA flood zone
- —
- Chance of flooding over 30 yrs
- —
- Est. flood insurance / yr
- —
Fire risk No data
- Est. fire insurance / yr
- —
Heat risk No data
- Hot days now (above threshold)
- —
- Hot days in 30 yrs
- —
Wind risk No data
- Chance of severe wind over 30 yrs
- —
Air-quality risk No data
- Unhealthy air days now
- —
- Unhealthy air days in 30 yrs
- —
Risk factors via First Street. Map © Google.
Why this score? — see what drove the B grade
The composite is a weighted blend of 9 inputs, each scored 0–100. Each bar is that input's sub-score; the figure is the points it added to the 100-point composite (weight × sub-score).
- Cash flow +30.0/30.0
- 1% rule +10.0/10.0
- DSCR +10.0/10.0
- ARV discount +7.5/15.0
- Rent growth +4.5/5.0
- Schools +4.1/10.0
- Condition / age +4.0/5.0
- Livability +3.6/5.0
- Appreciation +0.0/10.0
$69,999
🖨 Deal sheet 📄 Offer letter ✓ Due diligence
Key facts
- Built 2026
- Listed 41 days
Property features AI
Finance
- Other: Address: 9901 State Road 3 #98, Muncie, IN 47303
- Financial info: List price $69,999
Exterior
- Utilities: Natural gas; Central electric for cooling
- Home design: Spec inventory, Cornerstone 66 plan; Single-level entry (information not specified beyond plan)
- Construction: Living area approximately 1,056
- Exterior features: Shake roof
Interior
- Bedrooms: 3 bedrooms
- Bathrooms: 2 full bathrooms
- Heating & cooling: Natural gas forced-air heating; Central air conditioning
- Interior features: 2 total bathrooms
Neighborhood map
What this means for you Summary
Snapshot
- This is a 3-bed/2.0-bath single-family listed at $70k. Condition is rated good.
Deal economics
- At list price, monthly cash flow is $485 ($6k/yr) — positive.
- The deal already cash-flows at list — no discount required.
- Meets the 1% rule at list price ($1k rent vs $70k).
- Recommended offer: $68k (3.0% below list) — sets the bar for market timing.
Location & tenants
- Location reads 71/100 on livability (#132 in IN) — a middle-class / working-renter tenant base. Strengths: crime A+, cost of living A+, housing A+; Watch: employment D+, health & safety D, amenities F.
- Delaware Community School Corporation (rural): math 43% / reading 51% proficiency, ranked #76 of 301 in IN (top 25%) — families likely to look elsewhere, expect single-tenant / working-renter base with shorter leases.
- Market conditions: Rents rising fast (+7.8%/yr); 112 active listings in the ZIP; 171 units permitted in Delaware County in 2024 (57 in 5+ unit buildings).
- This rent runs 31% of the median local income ($48k/yr) — at the standard rent-burdened threshold; future hikes will face affordability resistance.
Forward outlook
- Local home prices are declining (-3.0%/yr); year-one equity from $484 of loan paydown is wiped out by about $2k of value loss. Plan a longer hold.
- Delaware County population projected at -11% by 2050 — secular population decline; favor cash flow + early exit over multi-decade hold.
- At projected returns (-3.0% appreciation + 7.8% rent growth), your $20k cash investment doubles in ~4 years — after that, you're playing with house money.
Negotiation context
- It's been on market 42 days — a 3% lower offer ($68k) is reasonable based on typical stale-listing flexibility.
Questions for the listing agent
- It's been on market 42 days. Have you received any prior offers? Is the seller open to a 3% concession, seller financing, or rate buy-down credit?
- Is there a deadline driving the sale (1031 exchange, divorce, estate, relocation)? That informs how much negotiation room exists.
- What's the average days-on-market for RENTAL listings here right now (not sales)? A rising rental-DOM trend means longer vacancies and softer asking-rent achievability than the comps imply.
- What's the recent tenant-quality profile in this submarket — average credit score on applications, eviction rate, late-payment / NSF rate, and stable-employment percentage? A property-management company in the area should have these aggregated.
- How much new for-sale + rental construction is in the pipeline within 1–3 miles? Heavy new supply typically softens prices + rents 12–24 months out; constrained supply supports both.
Investment metrics
- 1% rule
- 1.75% ✓
- Cap rate
- 14.61%
- Cash-on-cash
- 29.71%
- DSCR
- 2.32
- GRM
- 4.8
CMA / ARV
- ARV (median comp)
- $157,864
- List price
- $69,999
- Delta
- -55.66%
- Verdict
- UNDERPRICED
- Comps
- 8 within 1.0 mi
Projected returns pro-forma
-3.0% appreciation · 7.8% rent growth · sell at horizon
- IRR
- 29.6%
- Equity multiple
- 2.32×
- Total profit
- $25,792
- Equity at exit
- $10,437
- IRR
- 39.6%
- Equity multiple
- 5.62×
- Total profit
- $90,478
- Equity at exit
- $6,052
Cash invested: $19,600 (down + closing). Projections, not guarantees.
Landlord ↔ Tenant lean methodology
- Overall (STATE)
- 90 Strongly Landlord-Friendly
- State Indiana
- 90 Strongly Landlord-Friendly · R+11
- County
- — inherits STATE
- City
- — inherits STATE
ZIP-level market 47303
- Home prices YoY
- -18.0%
- Rents YoY
- 7.8%
- Active inventory
- 112
- Price-to-rent
- 4.8×
Monthly cashflow live
- Estimated rent
- $1,227 medium interval (Pro) →
- Mortgage (P&I)
- −$367
- Tax est. 1.5%
- −$87 /mo · $1,050/yr
- Insurance
- −$29
- HOA
- −$0
- Vacancy / Maint / Mgmt
- −$258
- Net cashflow
- $485
Break-even live
UW: 25.0% down · 7.5% · 30yr · 1.5% tax · 5.0% vac · 8.0% maint · 8.0% mgmt
Financing live
Cash to close
- Down payment
- $17,500
- Closing costs
- $2,100
- Reserves months
- —
- Total cash needed
- —
Loan-product check · same deal, 3 products live
Conventional
25% down · 7.5% · 30yr
- Down + closing
- —
- Monthly P&I
- —
- Monthly cashflow
- —
- DSCR
- —
- Eligible?
- —
Personal DTI + credit; lowest rate.
DSCR
20% down · 8.5% · 30yr
- Down + closing
- —
- Monthly P&I
- —
- Monthly cashflow
- —
- DSCR
- —
- Eligible?
- —
No personal income docs; deal must DSCR.
Hard money
10% down · 12.0% · 12mo
- Down + closing
- —
- Monthly P&I
- —
- Monthly cashflow
- —
- DSCR
- —
- Eligible?
- —
Short-term bridge; refi at stabilization.
Listing history 16 events
-
2026-06-19days on market $69,999 Active 42 DOM
-
2026-06-18days on market $69,999 Active 41 DOM
-
2026-06-17days on market $69,999 Active 40 DOM
-
2026-06-16days on market $69,999 Active 39 DOM
-
2026-06-15days on market $69,999 Active 38 DOM
-
2026-06-14days on market $69,999 Active 36 DOM
-
2026-06-13days on market $69,999 Active 35 DOM
-
2026-06-10days on market $69,999 Active 33 DOM
-
2026-06-09days on market $69,999 Active 32 DOM
-
2026-06-08days on market $69,999 Active 31 DOM
-
2026-06-07days on market $69,999 Active 30 DOM
-
2026-06-02days on market $69,999 Active 25 DOM
-
2026-06-01days on market $69,999 Active 24 DOM
-
2026-05-31days on market $69,999 Active 23 DOM
-
2026-05-30days on market $69,999 Active 22 DOM
-
2026-05-08$69,999 Active
ⓘ Source: listings_history table (triggers on properties + properties_extension) + one-shot
backfill from property_details.listing_events for pre-trigger history.
Nearby sold comps map
Loading sold comps map…
Walkable amenities ~0.75 mi
Loading nearby amenities…
Taxation est. · year 1
- Rental income
- $14,719
- − Mortgage interest
- −$3,921
- − Property taxes
- −$1,050
- − Insurance
- −$350
- − Repairs & maintenance
- −$1,178
- − Management
- −$1,178
- − Depreciation
- −$2,036
- Taxable income
- $5,006
- Est. tax owed @ 24.0%
- −$1,202
- After-tax cash flow
- $4,621/yr
For passive investors: Depreciation is non-cash, so a rental often shows a tax loss while cash-flowing — sheltering income. Rental losses are passive: they offset passive income freely, and up to $25,000/yr can offset ordinary (W-2) income if you actively participate and your MAGI is under $100k (phasing out to $0 by $150k); unused losses carry forward. On sale, claimed depreciation is recaptured at up to 25%, and gains may owe capital-gains tax (a 1031 exchange can defer both). Figures are a year-1 estimate at your 24.0% rate — not tax advice; consult a CPA.
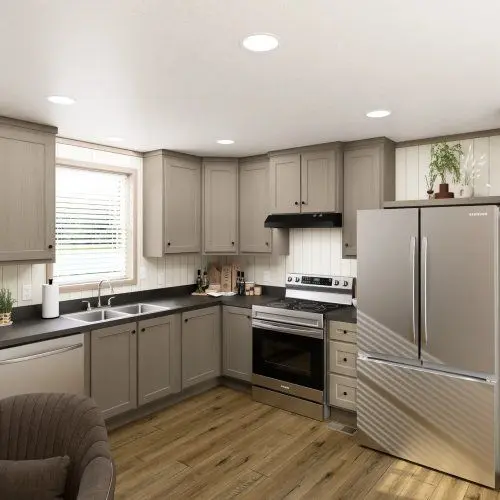
Condition & rehab AI · 11 photos
This home is in excellent condition with modern finishes and a welcoming appearance. It is move-in ready and would benefit from minor updates to further enhance its value.
Value-add opportunities
- Both Painting the interior walls — Fresh paint can enhance the home's curb appeal and interior aesthetics.
- Both Updating the flooring — Replacing worn-out flooring can significantly improve the home's appearance and value.
- Both Upgrading the kitchen appliances — Modernizing the kitchen can attract more buyers and renters.
- Both Adding smart home features — Smart home technology can increase the home's appeal and value, especially for tech-savvy buyers and renters.
Renovation cost estimate screening
Value-add ROI direction
- Both Painting the interior walls — Fresh paint can enhance the home's curb appeal and interior aesthetics. ↑
- Both Updating the flooring — Replacing worn-out flooring can significantly improve the home's appearance and value. ↑
- Both Upgrading the kitchen appliances — Modernizing the kitchen can attract more buyers and renters. ↑
- Both Adding smart home features — Smart home technology can increase the home's appeal and value, especially for tech-savvy buyers and renters. ↑
ⓘ Cost ranges are severity-bucket heuristics (US national rule-of-thumb). Get contractor quotes + a written scope before underwriting a rehab budget.
Schools (NCES district)
- District
- Delaware Community School Corporation
- NCES district ID
- 1802660
- Math proficiency
- 43% ▼ -13.00%
- Reading proficiency
- 51% ▼ -10.00%
- Median HH income
- $54,665
- Composite
- 40.72/100
- National rank
- #3659
- State rank
- #76 of 301 in IN
Livability — Eaton
- Score
- 71/100
- State rank
- #132
- US rank
- #6844
Category grades
Schools grade is shown separately in the Schools card above.
Census & demographics
- County
- Delaware County · 84,658 people
- Metro
- Muncie, IN
- Population (ZIP)
- 24,392
- Household income
- $47,674
- Rent vs Own
- Severe rent burden
- 1434.0
Population outlook (Delaware County) Hauer SSP2
- Today (2025)
- 113,036 people
- By 2030
- 111,313 · -1.5%
- By 2040
- 106,432 · -5.8%
- By 2050
- 100,747 · -10.9%
- By 2075
- 91,000 · -19.5%
- By 2100
- 80,687 · -28.6%
Race, ethnicity, and origin ACS 2023
- Neighborhood character
- Predominantly White (82%)
- Race & ethnicity
- White 82% Black 9% Two or more races 5% Hispanic / Latino 3%
- Common ancestry
- Italian 4% Slovak 3% Lithuanian 2%
- Foreign-born
- 2% · Canada
- Languages at home
- 97% English-only · Spanish 1%
Political lean MEDSL · Delaware
- 2024 margin
- R (+15.8) · D 41.2% · R 57.0% · Other 1.8%
- 2008→2024 swing
- -30.8pp toward R · 2008: 15.0pp · 2024: -15.8pp
- All cycles
- 2024: R+15.8 2020: R+13.2 2016: R+13.7 2012: D+3.1 2008: D+15.0
Not yet ingested
- Civics
- —
Market trends
- HPI YoY
- ▼ -50.45%
- Current HPI
- 229.8654
- Rent YoY
- ▲ 7.80%
- Metro
- Muncie, IN
- State GDP YoY
- ▲ 2.90%
- F500 in state
- 18
Industry mix (Fortune 500 HQ in IN)
| Industry | F500 HQs | Revenue |
|---|---|---|
| Industrial Machinery | 2 | $37B |
|
||
| Healthcare | 1 | $177B |
|
||
| Pharmaceuticals | 1 | $45B |
|
||
| Metals / Steel | 1 | $18B |
|
||
| Agriculture | 1 | $17B |
|
||
| Packaging | 1 | $12B |
|
||
Cash-flow waterfall
monthlySold comps — $/sqft
last 12 mo · ≤1 miLoading sold comps…