 🏷️ Likely Rental
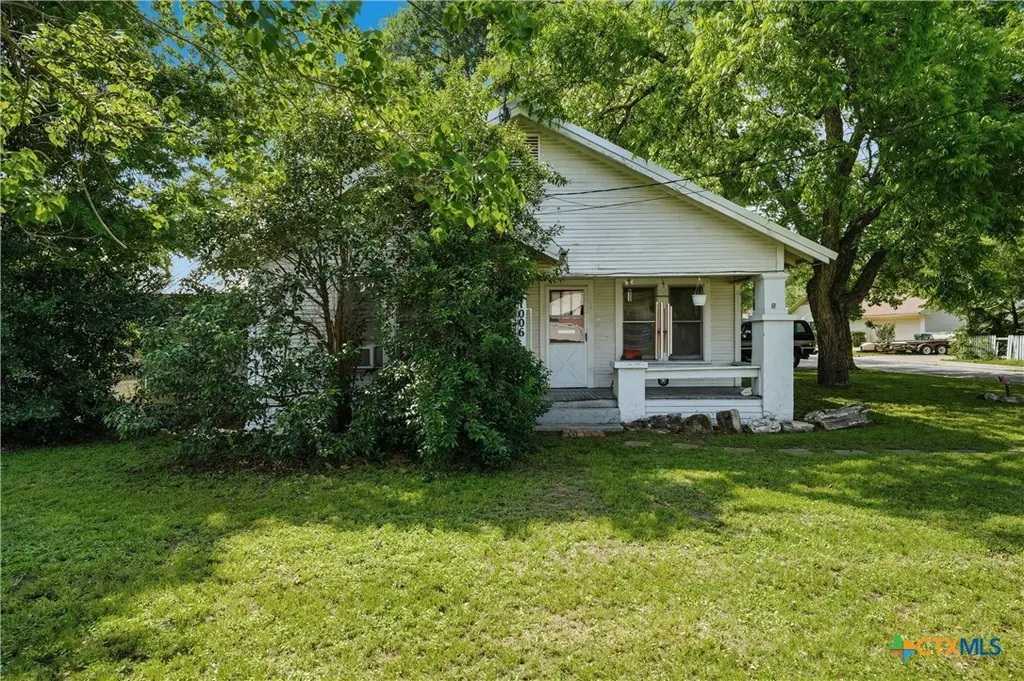
1006 N Fannin Ave · Cameron, TX
Flood risk 1/10 · Minimal
- FEMA flood zone
- X
- Chance of flooding over 30 yrs
- 0.0%
- Est. flood insurance / yr
- $507 – $1,088
Fire risk 4/10 · Minor
- Est. fire insurance / yr
- $1,222 – $2,270
Heat risk 8/10 · Major
- Hot days now (above 109°F)
- 7 days/yr
- Hot days in 30 yrs
- 24 days/yr
Wind risk 8/10 · Major
- Chance of severe wind over 30 yrs
- 80.0%
Air-quality risk 1/10 · Minimal
- Unhealthy air days now
- 0 days/yr
- Unhealthy air days in 30 yrs
- 0 days/yr
Risk factors via First Street. Map © Google.
Why this score? — see what drove the B grade
The composite is a weighted blend of 9 inputs, each scored 0–100. Each bar is that input's sub-score; the figure is the points it added to the 100-point composite (weight × sub-score).
- Cash flow +28.4/30.0
- ARV discount +15.0/15.0
- DSCR +10.0/10.0
- 1% rule +8.8/10.0
- Schools +3.7/10.0
- Livability +3.2/5.0
- Rent growth +2.5/5.0
- Condition / age +2.5/5.0
- Appreciation +0.0/10.0
$104,900
🖨 Deal sheet (PDF) 📄 Offer letter ✓ Due diligence
Listing remarks
Investor Special – Tenant-Occupied Opportunity in Cameron, TX Don’t miss this income-producing opportunity in the growing community of Cameron! This tenant-occupied property is perfect for investors looking to expand their portfolio with immediate cash flow. The home is currently leased, offering a turnkey investment with an established tenant already in place. Whether you’re a seasoned investor or just getting started, this property offers great potential at an affordable price point. Please do not disturb tenant. Showings by appointment only.
Key facts
- 7,405 sq ft lot
- 2 parking spots
- Listed 9 days
Property features AI
Finance
- HOA & community: Curbs in the community
Exterior
- Parking: Carport with 2 spaces
- Utilities: Electricity available; Public water; Public sewer; Public trash collection
- Home design: Single-story home; Resale property; Pillar/post/pier foundation; Metal roof; Lap siding exterior
- Construction: Built (year per assessor)
- Exterior features: Covered patio; Covered porch/patio; Back yard with chain link fencing; Corner lot; City lot with mature trees; Less than quarter-acre lot; City street frontage
Interior
- Flooring: Laminate flooring
- Bathrooms: 2 full bathrooms
- Heating & cooling: Wall/window cooling units; Window heating unit
- Interior features: All bedrooms located on the main level; Ceiling fans; Eat-in kitchen
- Laundry & utility: Dedicated laundry room; Electric water heater
Neighborhood map
What this means for you Summary
Snapshot
- This is a 3-bed/2.0-bath single-family listed at $105k.
Deal economics
- At list price, monthly cash flow is $338 ($4k/yr) — positive.
- The deal already cash-flows at list — no discount required.
- Meets the 1% rule at list price ($1k rent vs $105k).
- Cap rate 10.2% vs local median 2.9% in Cameron — top-decile yield for the area; either an underpriced asset or a hidden risk that comps aren't pricing in. Stress-test before assuming the spread holds.
Location & tenants
- Location reads 64/100 on livability (#812 in TX) — a middle-class / working-renter tenant base. Strengths: cost of living A+, housing A+, crime B+; Watch: amenities F, commute F, employment D-.
- Cameron ISD (rural): math 44% / reading 44% proficiency, ranked #312 of 826 in TX (top 38%) — families likely to look elsewhere, expect single-tenant / working-renter base with shorter leases; 67% free/reduced lunch — lower-income household profile, screen leases tightly.
- Zoned schools: Ben Milam El (421 students, 81% FRL); Cameron Middle (math 47% / reading 46%, grade D+, #443 of 1,662 statewide, top 28%, 356 students, 73% FRL); Cameron Yoe H S (math 32% / reading 42%, grade F, #897 of 1,632 statewide, top 57%, 474 students, 69% FRL).
- Market conditions: 134 active listings in the ZIP; 1 comparable units currently listed for rent nearby; 77 units permitted in Milam County in 2024 (0 in 5+ unit buildings).
Forward outlook
- Local home prices are declining (-3.0%/yr); year-one equity from $725 of loan paydown is wiped out by about $3k of value loss. Plan a longer hold.
- Milam County population projected to shrink 9% by 2050 — rents likely to lag national; underwrite the cash flow, not the appreciation.
- At projected returns (-3.0% appreciation + 3.0% rent growth), your $29k cash investment doubles in ~9 years — after that, you're playing with house money.
Negotiation context
- Only 9 days on market — expect competitive offers; lowballing is unlikely to land.
Risks & watch-outs
- Climate carrying-cost: severe wind risk, 80% chance of damaging wind over 30y; extreme-heat days projected 7→24/yr by 2055 (HVAC capex compounding) — expect insurance premiums to compound above CPI over the hold.
Questions for the listing agent
- Is there a deadline driving the sale (1031 exchange, divorce, estate, relocation)? That informs how much negotiation room exists.
- Schools are F-rated, which usually means shorter tenancies and higher turnover. Who's the typical renter profile here, and what's been the actual vacancy rate?
- What's the average days-on-market for RENTAL listings here right now (not sales)? A rising rental-DOM trend means longer vacancies and softer asking-rent achievability than the comps imply.
- What's the recent tenant-quality profile in this submarket — average credit score on applications, eviction rate, late-payment / NSF rate, and stable-employment percentage? A property-management company in the area should have these aggregated.
- How much new for-sale + rental construction is in the pipeline within 1–3 miles? Heavy new supply typically softens prices + rents 12–24 months out; constrained supply supports both.
Investment metrics
- 1% rule
- 1.38% ✓
- Cap rate
- 10.16%
- Cash-on-cash
- 13.81%
- DSCR
- 1.61
- GRM
- 6.0
CMA / ARV
- ARV (median comp)
- $193,113
- List price
- $104,900
- Delta
- -45.68%
- Verdict
- UNDERPRICED
- Comps
- 20 within 1.0 mi
Show comp detail 12 sales within ~0.75 mi
| Address | Dist | Beds/Ba | Sqft | Sold | Price | $/sf | Match |
|---|---|---|---|---|---|---|---|
| 805 N Central Ave | 0.11mi | 3/1.5 | 1,575 (-6%) | 2mo | $65,000 | $41 | 80 |
| 606 E 6th St | 0.36mi | 3/1.5 | 1,722 (+2%) | 3mo | $250,000 | $145 | 75 |
| 1506 Washington St | 0.28mi | 3/2.0 | 1,742 (+4%) | 9mo | $407,340 | $234 | 73 |
| 400 E 6th St | 0.28mi | 3/2.0 | 1,598 (-5%) | 12mo | $169,000 | $106 | 69 |
| 406 E 12th | 0.17mi | 2/1.0 (-1) | 1,565 (-7%) | 7mo | $155,000 | $99 | 66 |
| 701 E 15th St | 0.34mi | 3/1.0 | 1,764 (+5%) | 8mo | $150,000 | $85 | 65 |
| 712 E 16th St | 0.49mi | 3/2.0 | 1,540 (-8%) | 7mo | $230,000 | $149 | 58 |
| 803 E 15th St | 0.44mi | 3/2.0 | 1,482 (-12%) | 4mo | $140,000 | $94 | 56 |
| 605 N Lee Ave | 0.32mi | 4/2.0 (+1) | 1,728 (+3%) | 24mo | $196,900 | $114 | 56 |
| 1007 N Jackson Ave | 0.44mi | 3/1.0 | 1,464 (-13%) | 2mo | $230,000 | $157 | 52 |
| 1101 N Central Ave N | 0.03mi | 2/2.0 (-1) | 1,917 (+14%) | 22mo | $245,000 | $128 | 52 |
| 1600 N Cleveland Ave | 0.60mi | 2/2.0 (-1) | 1,580 (-6%) | 11mo | $155,000 | $98 | 48 |
Match score weights: distance 35% · size 25% · config 20% · recency 20%. Top-matched comps best support the ARV.
Projected returns pro-forma
-3.0% appreciation · 3.0% rent growth · sell at horizon
- IRR
- 4.1%
- Equity multiple
- 1.16×
- Total profit
- $4,609
- Equity at exit
- $15,641
- IRR
- 13.6%
- Equity multiple
- 2.09×
- Total profit
- $32,037
- Equity at exit
- $9,070
Cash invested: $29,372 (down + closing). Projections, not guarantees.
Landlord ↔ Tenant lean methodology
- Overall (STATE)
- 87 Strongly Landlord-Friendly
- State Texas
- 87 Strongly Landlord-Friendly · R+5
- County
- — inherits STATE
- City
- — inherits STATE
ZIP-level market 76520
- Home prices YoY
- -31.4%
- Active inventory
- 134
- Price-to-rent
- 6.0×
Monthly cashflow live
- Estimated rent
- $1,450 medium interval (Pro) →
- Mortgage (P&I)
- −$550
- Tax from tax record
- −$214 /mo · $2,563/yr
- Insurance
- −$44
- HOA
- −$0
- Vacancy / Maint / Mgmt
- −$304
- Net cashflow
- $338
Break-even live
Sensitivity live
| Price | -10% $397 | -5% $368 | +0% $338 | +5% $308 | +10% $279 |
|---|---|---|---|---|---|
| Rent | -10% $224 | -5% $281 | +0% $338 | +5% $395 | +10% $453 |
| Rate | -1.0pp $391 | -0.5pp $365 | base $338 | +0.5pp $311 | +1.0pp $283 |
UW: 25.0% down · 7.5% · 30yr · 1.5% tax · 5.0% vac · 8.0% maint · 8.0% mgmt
Financing live
Cash to close
- Down payment
- $26,225
- Closing costs
- $3,147
- Reserves months
- —
- Total cash needed
- —
Loan-product check · same deal, 3 products live
Conventional
25% down · 7.5% · 30yr
- Down + closing
- —
- Monthly P&I
- —
- Monthly cashflow
- —
- DSCR
- —
- Eligible?
- —
Personal DTI + credit; lowest rate.
DSCR
20% down · 8.5% · 30yr
- Down + closing
- —
- Monthly P&I
- —
- Monthly cashflow
- —
- DSCR
- —
- Eligible?
- —
No personal income docs; deal must DSCR.
Hard money
10% down · 12.0% · 12mo
- Down + closing
- —
- Monthly P&I
- —
- Monthly cashflow
- —
- DSCR
- —
- Eligible?
- —
Short-term bridge; refi at stabilization.
Rent comps 1 comps
| Address | Beds | Baths | Sqft | Rent | $/sqft | DOM | Units | Dist |
|---|---|---|---|---|---|---|---|---|
| 100 E 7th St Cameron, TX | 3.0 | 2.0 | 1200 | $1,450 | $1.21 | 9d | 1 | 0.22mi |
Listing history 8 events
-
2026-05-08status Pending 571-char remark
-
2026-05-05historical Active Under Contract 571-char remark
-
2026-04-29$104,900 Active 571-char remark
-
2025-03-19soldstatus
-
2017-02-23soldstatus
-
2015-03-27soldstatus
-
2007-04-26soldstatus
-
2001-08-24soldstatus
ⓘ Source: listings_history table (triggers on properties + properties_extension) + one-shot
backfill from property_details.listing_events for pre-trigger history.
Tax reassessment forecast TX · Resets to sale price
- Current annual tax
- $2,563 · $214/mo
- Projected year-2 tax
- $2,563 · $214/mo
- Expected delta
- $0/yr ($0/mo · 0.0%)
ⓘ Screening estimate from a state-policy table — verify with the county assessor before closing.
Climate risk First Street
- Flood 1/10 Low FEMA zone X · 0% chance over 30 yrs
- Wildfire 4/10 Moderate
- Heat 8/10 Severe 7 d/yr ≥109°F today · 24 d/yr by 30 yrs out
- Wind 8/10 Severe 80% chance of damaging wind over 30 yrs
- Air quality 1/10 Low 0 unhealthy d/yr today · 0 by 30 yrs out
Nearby sold comps map
Loading sold comps map…
Walkable amenities ~0.75 mi
Loading nearby amenities…
Taxation est. · year 1
- Rental income
- $17,400
- − Mortgage interest
- −$5,876
- − Property taxes
- −$2,563
- − Insurance
- −$524
- − Repairs & maintenance
- −$1,392
- − Management
- −$1,392
- − Depreciation
- −$3,052
- Taxable income
- $2,601
- Est. tax owed @ 24.0%
- −$624
- After-tax cash flow
- $3,433/yr
For passive investors: Depreciation is non-cash, so a rental often shows a tax loss while cash-flowing — sheltering income. Rental losses are passive: they offset passive income freely, and up to $25,000/yr can offset ordinary (W-2) income if you actively participate and your MAGI is under $100k (phasing out to $0 by $150k); unused losses carry forward. On sale, claimed depreciation is recaptured at up to 25%, and gains may owe capital-gains tax (a 1031 exchange can defer both). Figures are a year-1 estimate at your 24.0% rate — not tax advice; consult a CPA.
Schools (NCES district)
- District
- Cameron ISD
- NCES district ID
- 4812640
- Math proficiency
- 44% ▼ -2.00%
- Reading proficiency
- 44% ▲ 5.00%
- Median HH income
- $37,973
- Composite
- 36.67/100
- National rank
- #4611
- State rank
- #312 of 826 in TX
Livability — Cameron
- Score
- 64/100
- State rank
- #812
- US rank
- #14747
Category grades
Schools grade is shown separately in the Schools card above.
Census & demographics
- Census place
- Cameron, TX
- Population (ZIP)
- 8,098
Population outlook (Milam County) Hauer SSP2
- Today (2025)
- 24,051 people
- By 2030
- 23,613 · -1.8%
- By 2040
- 22,693 · -5.6%
- By 2050
- 21,879 · -9.0%
- By 2075
- 20,974 · -12.8%
- By 2100
- 19,414 · -19.3%
Race, ethnicity, and origin ACS 2023
- Neighborhood character
- Diverse neighborhood (Simpson 0.65)
- Race & ethnicity
- White 47% Hispanic / Latino 32% Black 18% Two or more races 11%
- Hispanic origin (detail)
- Mexican 31%
- Common ancestry
- Portuguese 2% Serbian 1% Slovak 1%
- Foreign-born
- 5% · Canada
- Languages at home
- 79% English-only · Spanish 20%
Political lean MEDSL · Milam
- 2024 margin
- Solid R (+57.3) · D 21.0% · R 78.3%
- 2008→2024 swing
- -31.3pp toward R · 2008: -26.0pp · 2024: -57.3pp
- All cycles
- 2024: R+57.3 2020: R+51.9 2016: R+49.9 2012: R+34.6 2008: R+26.0
Not yet ingested
- Civics
- —
Market trends
- HPI YoY
- ▼ -76.27%
- Current HPI
- 167.0164
- Rent YoY
- —
- Metro
- —
- State GDP YoY
- ▲ 3.95%
- F500 in state
- 110
Industry mix (Fortune 500 HQ in TX)
| Industry | F500 HQs | Revenue |
|---|---|---|
| Energy | 16 | $1,198B |
|
||
| Technology | 5 | $198B |
|
||
| Engineering / Construction | 4 | $72B |
|
||
| Energy Services | 3 | $60B |
|
||
| Utilities | 3 | $41B |
|
||
| Healthcare | 2 | $330B |
|
||
Price history
+0.0% since first listed9 events — show timeline
- 2026-06-12 Sold (MLS) $104,900 CTXMLS
- 2026-05-08 Pending — CTXMLS
- 2026-05-05 Contingent — CTXMLS
- 2026-04-29 Listed $104,900 CTXMLS
- 2025-03-19 Sold (Public Records) — Public Records
- 2017-02-23 Sold (Public Records) — Public Records
- 2015-03-27 Sold (Public Records) — Public Records
- 2007-04-26 Sold (Public Records) — Public Records
- 2001-08-24 Sold (Public Records) — Public Records
Property tax history
+12.0%/yrLatest (2025): $2,563 · +14.7% YoY. Source: county tax records.
Cash-flow waterfall
monthlySold comps — $/sqft
last 12 mo · ≤1 miLoading sold comps…