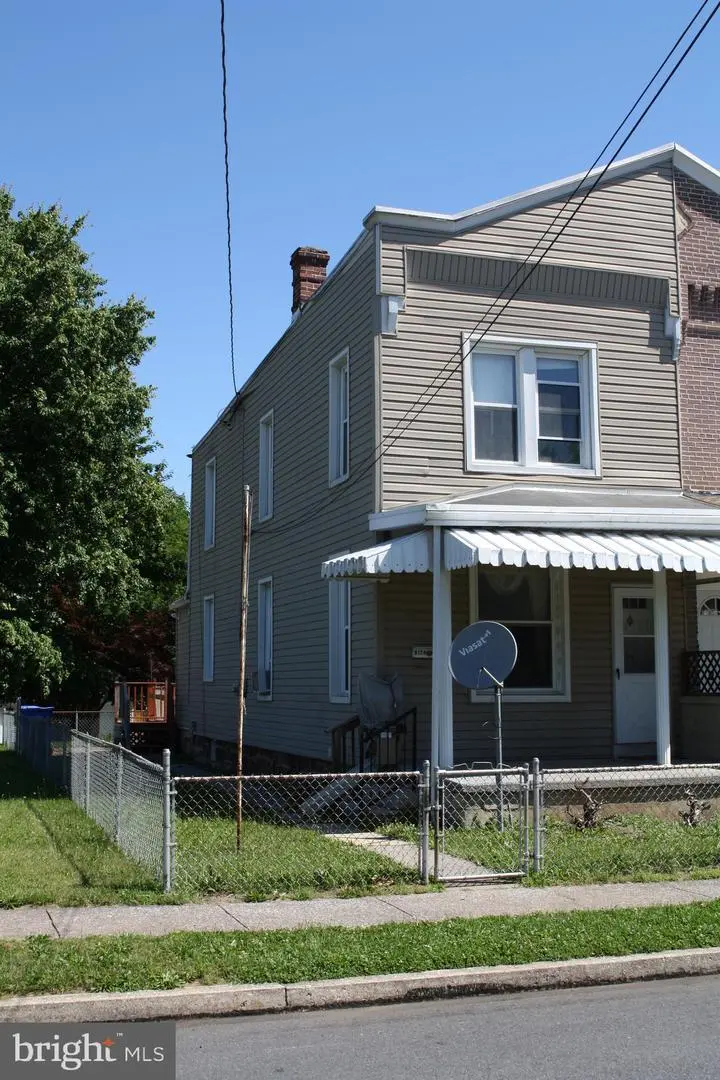
6724 Somerset St · Rutherford, PA
Flood risk 1/10 · Minimal
- FEMA flood zone
- X (unshaded)
- Chance of flooding over 30 yrs
- 0.0%
- Est. flood insurance / yr
- $473 – $860
Fire risk 1/10 · Minimal
- Est. fire insurance / yr
- $511 – $949
Heat risk 5/10 · Moderate
- Hot days now (above 100°F)
- 7 days/yr
- Hot days in 30 yrs
- 15 days/yr
Wind risk 3/10 · Minor
- Chance of severe wind over 30 yrs
- 7.0%
Air-quality risk 3/10 · Minor
- Unhealthy air days now
- 2 days/yr
- Unhealthy air days in 30 yrs
- 4 days/yr
Risk factors via First Street. Map © Google.
Why this score? — see what drove the B grade
The composite is a weighted blend of 9 inputs, each scored 0–100. Each bar is that input's sub-score; the figure is the points it added to the 100-point composite (weight × sub-score).
- Cash flow +26.6/30.0
- ARV discount +15.0/15.0
- DSCR +9.1/10.0
- 1% rule +6.4/10.0
- Schools +3.6/10.0
- Rent growth +3.4/5.0
- Livability +3.4/5.0
- Condition / age +2.5/5.0
- Appreciation +0.0/10.0
$160,000
🖨 Deal sheet (PDF) 📄 Offer letter ✓ Due diligence
Listing remarks MLS
Nice, affordable duplex home located on a quite street. Large eat-in-kitchen with pantry, good cabinet and counter space, laundry closet and access to nice deck and backyard. Corner cupboard stays. Very large dining room/living room combination. Roof is 6 years old, and exterior is vinyl siding. All appliances are included.
Key facts
- New kitchen
- Fresh paint
- New carpet
Tags
Property features AI
Finance
- Other: Fee simple ownership
- HOA & community: Ground rent paid annually
Exterior
- Parking: On-street parking
- Utilities: Public water; Public sewer; 100 amp electric service; Electric hot water; Cable TV available; Phone service available
- Home design: Semi-detached structure; Two floors; Entry level: 1; Main entrance faces south; Level lot
- Construction: Brick construction; Stone foundation
- Exterior features: Sidewalks; Partially fenced yard; Deck(s); Porch(es); Shed
Interior
- Kitchen: Eat-in kitchen; Pantry
- Bedrooms: Three bedrooms on the upper level
- Flooring: Carpet; Vinyl
- Bathrooms: One full bathroom on upper level; One half bathroom on main level
- Heating & cooling: Forced air heating (oil-fired); Window cooling units
- Interior features: Ceiling fans; Combination dining and living area; Eat-in kitchen; Pantry; 5 total rooms
- Laundry & utility: Laundry on main floor
Neighborhood map
What this means for you Summary
Snapshot
- This is a 2-bed/1.5-bath townhouse listed at $160k.
Deal economics
- At list price, monthly cash flow is $429 ($5k/yr) — positive.
- The deal already cash-flows at list — no discount required.
- Meets the 1% rule at list price ($2k rent vs $160k).
Location & tenants
- Location reads 67/100 on livability (#1,007 in PA) — a middle-class / working-renter tenant base. Strengths: cost of living A+, housing A+, employment A-; Watch: amenities F, commute F, health & safety F.
- Central Dauphin SD (suburban): math 30% / reading 52% proficiency, ranked #305 of 539 in PA (top 57%) — families likely to look elsewhere, expect single-tenant / working-renter base with shorter leases.
- Zoned schools: Rutherford El Sch (math 22% / reading 47%, grade F, #1,049 of 1,518 statewide, top 71%, 441 students, 100% FRL); Central Dauphin East Ms (math 11% / reading 42%, grade F, #410 of 512 statewide, top 80%, 779 students, 99% FRL); Central Dauphin East Shs (math 50% / reading 15%, grade F, #330 of 437 statewide, top 76%, 1,590 students, 100% FRL) — zoned schools average 100% FRL vs 33% district-wide (67 pts higher); higher-poverty schools than district average — tighter screening recommended.
- Market conditions: Rents rising (+3.8%/yr); 178 active listings in the ZIP; 6 comparable units currently listed for rent nearby; rentals at typical pace (median 15d on market — plan ~3-4 weeks tenant-placement turnaround); solid renter incomes; 540 units permitted in Dauphin County in 2024 (194 in 5+ unit buildings).
Forward outlook
- Local home prices are declining (-3.0%/yr); year-one equity from $1k of loan paydown is wiped out by about $5k of value loss. Plan a longer hold.
- At projected returns (-3.0% appreciation + 3.8% rent growth), your $45k cash investment doubles in ~9 years — after that, you're playing with house money.
Negotiation context
- Only 6 days on market — expect competitive offers; lowballing is unlikely to land.
- 3 sale attempts since 21y ago with the ask held roughly flat each time — persistent listings suggest the price (not the market) is what's stuck; bring a comps-based counter.
- Current owner paid $80k; list at $160k implies a 100% gain — meaningful room to come down on a strong offer.
Risks & watch-outs
- Watch-outs: built in 1915 — expect roof / HVAC / electrical / plumbing capex.
- Climate carrying-cost: extreme-heat days projected 7→15/yr by 2055 (HVAC capex compounding) — expect insurance premiums to compound above CPI over the hold.
Questions for the listing agent
- Built in 1915 — when were the roof, HVAC, electrical panel, plumbing, and water heater last replaced?
- Is there a deadline driving the sale (1031 exchange, divorce, estate, relocation)? That informs how much negotiation room exists.
- Schools are D-rated, which usually means shorter tenancies and higher turnover. Who's the typical renter profile here, and what's been the actual vacancy rate?
- What's the average days-on-market for RENTAL listings here right now (not sales)? A rising rental-DOM trend means longer vacancies and softer asking-rent achievability than the comps imply.
- What's the recent tenant-quality profile in this submarket — average credit score on applications, eviction rate, late-payment / NSF rate, and stable-employment percentage? A property-management company in the area should have these aggregated.
- How much new for-sale + rental construction is in the pipeline within 1–3 miles? Heavy new supply typically softens prices + rents 12–24 months out; constrained supply supports both.
Investment metrics
- 1% rule
- 1.14% ✓
- Cap rate
- 9.51%
- Cash-on-cash
- 11.49%
- DSCR
- 1.51
- GRM
- 7.3
CMA / ARV
- ARV (on-the-fly)
- $215,600
- Comps found
- 12
Show comp detail 12 sales within ~0.75 mi
| Address | Dist | Beds/Ba | Sqft | Sold | Price | $/sf | Match |
|---|---|---|---|---|---|---|---|
| 210 N 67th St | 0.09mi | 3/1.0 (+1) | 1,280 (+4%) | 3mo | $169,000 | $132 | 80 |
| 6861 Huntingdon St | 0.11mi | 3/1.0 (+1) | 1,220 (-1%) | 12mo | $180,000 | $148 | 76 |
| 6755 Somerset St | 0.03mi | 3/1.0 (+1) | 1,120 (-9%) | 7mo | $180,000 | $161 | 71 |
| 7237 Huntingdon St | 0.37mi | 2/2.5 | 1,308 (+6%) | 2mo | $240,000 | $183 | 67 |
| 260 N 67th St | 0.08mi | 3/1.5 (+1) | 1,376 (+12%) | 12mo | $184,900 | $134 | 62 |
| 73 N 72nd St | 0.34mi | 2/1.5 | 1,120 (-9%) | 9mo | $210,000 | $188 | 61 |
| 7214 Huntingdon St | 0.32mi | 2/2.5 | 1,374 (+12%) | 2mo | $240,000 | $175 | 60 |
| 7100 Clearfield St | 0.28mi | 3/1.0 (+1) | 1,080 (-12%) | 2mo | $190,000 | $176 | 58 |
| 6980 Clearfield St | 0.21mi | 3/1.0 (+1) | 1,400 (+14%) | 7mo | $168,000 | $120 | 55 |
| 7246 Huntingdon St | 0.38mi | 2/2.5 | 1,374 (+12%) | 8mo | $222,900 | $162 | 53 |
| 7951 Jefferson St | 0.74mi | 3/1.5 (+1) | 1,224 (-1%) | 8mo | $227,500 | $186 | 52 |
| 7258 Clearfield St | 0.43mi | 2/2.5 | 1,374 (+12%) | 8mo | $250,000 | $182 | 50 |
Match score weights: distance 35% · size 25% · config 20% · recency 20%. Top-matched comps best support the ARV.
Projected returns pro-forma
-3.0% appreciation · 3.76% rent growth · sell at horizon
- IRR
- 1.6%
- Equity multiple
- 1.06×
- Total profit
- $2,779
- Equity at exit
- $23,857
- IRR
- 11.9%
- Equity multiple
- 1.97×
- Total profit
- $43,355
- Equity at exit
- $13,834
Cash invested: $44,800 (down + closing). Projections, not guarantees.
Landlord ↔ Tenant lean methodology
- Overall (STATE)
- 62 Landlord-Friendly
- State Pennsylvania
- 62 Landlord-Friendly · EVEN
- County
- — inherits STATE
- City
- — inherits STATE
ZIP-level market 17111
- Rents YoY
- 3.8%
- Active inventory
- 178
- Price-to-rent
- 7.3×
Monthly cashflow live
- Estimated rent
- $1,826 high interval (Pro) →
- Mortgage (P&I)
- −$839
- Tax from tax record
- −$108 /mo · $1,297/yr
- Insurance
- −$67
- HOA
- −$0
- Vacancy / Maint / Mgmt
- −$384
- Net cashflow
- $429
Break-even live
Sensitivity live
| Price | -10% $520 | -5% $474 | +0% $429 | +5% $384 | +10% $338 |
|---|---|---|---|---|---|
| Rent | -10% $285 | -5% $357 | +0% $429 | +5% $501 | +10% $573 |
| Rate | -1.0pp $510 | -0.5pp $470 | base $429 | +0.5pp $388 | +1.0pp $345 |
UW: 25.0% down · 7.5% · 30yr · 1.5% tax · 5.0% vac · 8.0% maint · 8.0% mgmt
Financing live
Cash to close
- Down payment
- $40,000
- Closing costs
- $4,800
- Reserves months
- —
- Total cash needed
- —
Loan-product check · same deal, 3 products live
Conventional
25% down · 7.5% · 30yr
- Down + closing
- —
- Monthly P&I
- —
- Monthly cashflow
- —
- DSCR
- —
- Eligible?
- —
Personal DTI + credit; lowest rate.
DSCR
20% down · 8.5% · 30yr
- Down + closing
- —
- Monthly P&I
- —
- Monthly cashflow
- —
- DSCR
- —
- Eligible?
- —
No personal income docs; deal must DSCR.
Hard money
10% down · 12.0% · 12mo
- Down + closing
- —
- Monthly P&I
- —
- Monthly cashflow
- —
- DSCR
- —
- Eligible?
- —
Short-term bridge; refi at stabilization.
Rent comps 6 comps
| Address | Beds | Baths | Sqft | Rent | $/sqft | DOM | Units | Dist |
|---|---|---|---|---|---|---|---|---|
| 50 N 67th St Unit 3 Harrisburg, PA | 2.0 | 1.0 | 770 | $1,525 | $1.98 | 44d | 1 | 0.17mi |
| 6550 Somerset St Harrisburg, PA | 3.0 | 2.0 | 1488 | $2,250 | $1.51 | 14d | 1 | 0.19mi |
| 7214 Huntingdon St Harrisburg, PA | 2.0 | 2.5 | 1374 | $1,900 | $1.38 | 44d | 1 | 0.33mi |
| 7466 Stephen Dr Harrisburg, PA | 2.0–3.0 | 2.5 | 1626 | $1,789 | $1.10 | 14d | 1 | 0.59mi |
| 54 N 62nd St Unit 1 Harrisburg, PA | 3.0 | 2.0 | 1340 | $1,750 | $1.31 | 14d | 1 | 0.63mi |
| 303 Hamilton Cir Harrisburg, PA | 2.0 | 1.5 | 1096 | $1,576 | $1.44 | 14d | 2 | 1.44mi |
Listing history 6 events
-
2026-06-13statusdays on market $160,000 Pending 6 DOM
-
2026-06-10days on market $160,000 Active 5 DOM
-
2026-06-09days on market $160,000 Active 4 DOM
-
2026-06-08days on market $160,000 Active 3 DOM
-
2026-06-07remarks 375-char remark
-
2026-06-07$160,000 Active 2 DOM
ⓘ Source: listings_history table (triggers on properties + properties_extension) + one-shot
backfill from property_details.listing_events for pre-trigger history.
Tax reassessment forecast PA · Partial reset (capped growth)
- Current annual tax
- $1,297 · $108/mo
- Projected year-2 tax
- $1,913 · $159/mo
- Expected delta
- +$615/yr (+$51/mo · 47.4%)
ⓘ Screening estimate from a state-policy table — verify with the county assessor before closing.
Climate risk First Street
- Flood 1/10 Low FEMA zone X (unshaded) · 0% chance over 30 yrs
- Wildfire 1/10 Low
- Heat 5/10 Major 7 d/yr ≥100°F today · 15 d/yr by 30 yrs out
- Wind 3/10 Moderate 7% chance of damaging wind over 30 yrs
- Air quality 3/10 Moderate 2 unhealthy d/yr today · 4 by 30 yrs out
Nearby sold comps map
Loading sold comps map…
Walkable amenities ~0.75 mi
Loading nearby amenities…
Taxation est. · year 1
- Rental income
- $21,917
- − Mortgage interest
- −$8,962
- − Property taxes
- −$1,297
- − Insurance
- −$800
- − Repairs & maintenance
- −$1,753
- − Management
- −$1,753
- − Depreciation
- −$4,655
- Taxable income
- $2,696
- Est. tax owed @ 24.0%
- −$647
- After-tax cash flow
- $4,502/yr
For passive investors: Depreciation is non-cash, so a rental often shows a tax loss while cash-flowing — sheltering income. Rental losses are passive: they offset passive income freely, and up to $25,000/yr can offset ordinary (W-2) income if you actively participate and your MAGI is under $100k (phasing out to $0 by $150k); unused losses carry forward. On sale, claimed depreciation is recaptured at up to 25%, and gains may owe capital-gains tax (a 1031 exchange can defer both). Figures are a year-1 estimate at your 24.0% rate — not tax advice; consult a CPA.
Schools (NCES district)
- District
- Central Dauphin SD
- NCES district ID
- 4205400
- Math proficiency
- 30% ▼ -12.00%
- Reading proficiency
- 52% ▼ -7.00%
- Median HH income
- $62,792
- Composite
- 36.46/100
- National rank
- #4664
- State rank
- #305 of 539 in PA
Livability — Rutherford
- Score
- 67/100
- State rank
- #1007
- US rank
- #11116
Category grades
Schools grade is shown separately in the Schools card above.
Census & demographics
- Census place
- Rutherford, PA
- County
- Dauphin County · 247,857 people
- City population
- 35,818
- Metro
- Harrisburg-Carlisle, PA
- Population (ZIP)
- 36,744
- Household income
- $86,385
- Rent vs Own
- Severe rent burden
- 756.0
Population outlook (Dauphin County) Hauer SSP2
- Today (2025)
- 281,628 people
- By 2030
- 283,549 · +0.7%
- By 2040
- 285,385 · +1.3%
- By 2050
- 286,188 · +1.6%
- By 2075
- 291,053 · +3.3%
- By 2100
- 282,374 · +0.3%
Race, ethnicity, and origin ACS 2023
- Neighborhood character
- Diverse neighborhood (Simpson 0.65)
- Race & ethnicity
- White 53% Black 22% Asian 13% Hispanic / Latino 8% Two or more races 6%
- Hispanic origin (detail)
- Mexican 1% Puerto Rican 4%
- Common ancestry
- Romanian 4% Lithuanian 1% Serbian 1%
- Foreign-born
- 14% · India, Canada, Vietnam
- Languages at home
- 83% English-only · Other Indo-European 7% Spanish 6% Vietnamese 1%
Political lean MEDSL · Dauphin
- 2024 margin
- Lean D (+5.9) · D 52.4% · R 46.5% · Other 1.1%
- 2008→2024 swing
- -3.1pp toward R · 2008: 9.1pp · 2024: 5.9pp
- All cycles
- 2024: D+5.9 2020: D+8.5 2016: D+2.8 2012: D+6.0 2008: D+9.1
Not yet ingested
- Civics
- —
Market trends
- HPI YoY
- ▼ -140.67%
- Current HPI
- 236.6936
- Rent YoY
- ▲ 3.76%
- Metro
- Harrisburg-Carlisle, PA
- State GDP YoY
- ▲ 1.68%
- F500 in state
- 34
Industry mix (Fortune 500 HQ in PA)
| Industry | F500 HQs | Revenue |
|---|---|---|
| Healthcare | 2 | $309B |
|
||
| Insurance | 2 | $27B |
|
||
| Telecommunications / Media | 1 | $124B |
|
||
| Industrial Distribution | 1 | $22B |
|
||
| Financial Services | 1 | $20B |
|
||
| Chemicals / Materials | 1 | $18B |
|
||
Price history
+92.8% since first listed9 events — show timeline
- 2026-06-05 Listed $160,000 BRIGHT MLS
- 2018-11-14 Sold (Public Records) $80,000 Public Records
- 2018-11-06 Sold (MLS) $80,000 BRIGHT MLS
- 2018-10-18 Pending — BRIGHT MLS
- 2018-08-16 Price Changed $85,900 BRIGHT MLS
- 2018-06-12 Listed $89,900 BRIGHT MLS
- 2005-08-30 Sold (Public Records) $84,000 Public Records
- 2005-08-29 Sold (MLS) $84,000 BRIGHT MLS
- 2005-08-01 Listed $83,000 BRIGHT MLS
Property tax history
+1.9%/yrLatest (2026): $1,297 · +5.5% YoY. Source: county tax records.
Cash-flow waterfall
monthlySold comps — $/sqft
last 12 mo · ≤1 miLoading sold comps…