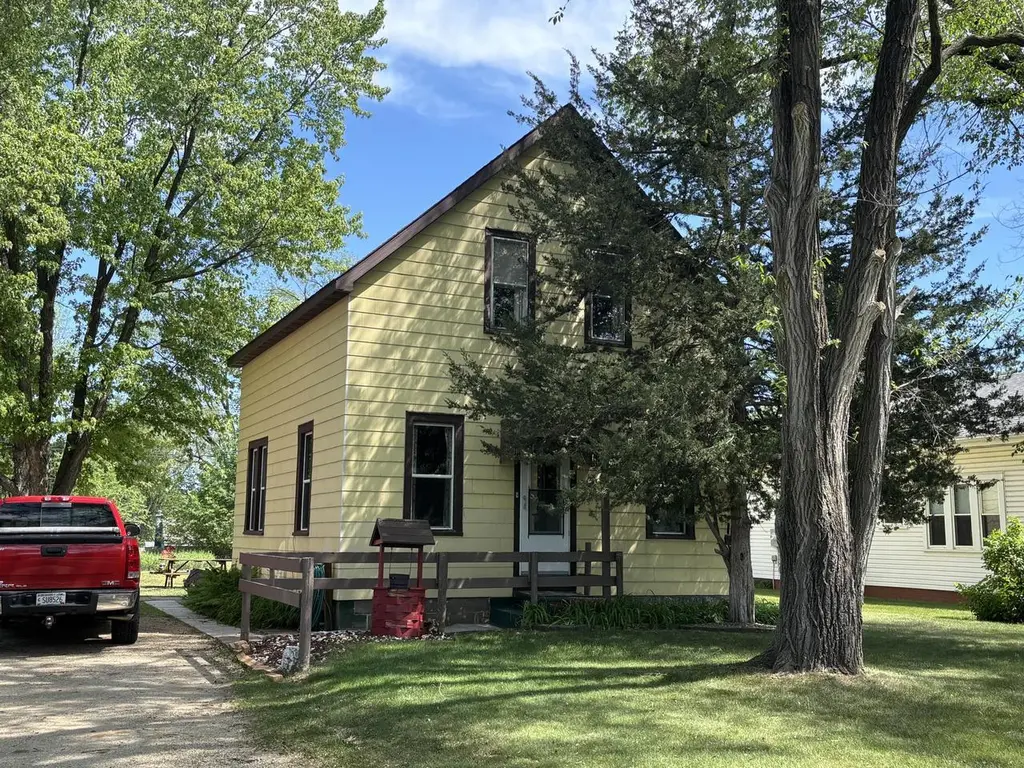
2707 Boschert St · La Crosse, WI
Flood risk 1/10 · Minimal
- FEMA flood zone
- X (unshaded)
- Chance of flooding over 30 yrs
- 0.0%
- Est. flood insurance / yr
- $473 – $860
Fire risk 1/10 · Minimal
- Est. fire insurance / yr
- $636 – $1,182
Heat risk 2/10 · Minimal
- Hot days now (above 99°F)
- 7 days/yr
- Hot days in 30 yrs
- 14 days/yr
Wind risk 2/10 · Minimal
- Chance of severe wind over 30 yrs
- —
Air-quality risk 1/10 · Minimal
- Unhealthy air days now
- 0 days/yr
- Unhealthy air days in 30 yrs
- 0 days/yr
Risk factors via First Street. Map © Google.
Why this score? — see what drove the B- grade
The composite is a weighted blend of 9 inputs, each scored 0–100. Each bar is that input's sub-score; the figure is the points it added to the 100-point composite (weight × sub-score).
- Cash flow +30.0/30.0
- 1% rule +10.0/10.0
- DSCR +10.0/10.0
- ARV discount +7.5/15.0
- Livability +3.5/5.0
- Rent growth +3.2/5.0
- Schools +2.7/10.0
- Condition / age +2.5/5.0
- Appreciation +0.0/10.0
$109,500
🖨 Deal sheet 📄 Offer letter ✓ Due diligence
Listing remarks
Opportunity knocks in the Town of Shelby! This 4 bedroom, 1 bath home offers incredible potential for the right buyer willing to bring their vision & elbow grease. Priced to sell, this is a fantastic chance to build sweat equity or take on your next investment project. Conveniently located near shopping, dining, & everyday amenities including Shelby Mall & Walmart. The location is hard to beat & house sits on a spacious 1/4-acre lot & in an area surrounded by many well-kept homes. No garage, but ample outdoor space for parking or future improvements. Whether you're a first-time buyer with vision, investor, or flipper, this one is packed with potential. Town of
Key facts
- Ample outdoor space
- Moved around 1950
- Built around 1900
Tags
Property features AI
Finance
- Other: Estimated living area range: 1501-1750
Exterior
- Parking: 1 parking space
- Utilities: Municipal sewer; Well water; Natural gas
- Home design: Single-family, 2-story home; Residential zoning; Year built: see remarks
- Construction: Other construction details; see remarks
- Exterior features: Aluminum trim; Garden shed; Lot less than 1/2 acre
Interior
- Kitchen: Kitchen 19 x 14 (Main); Range; Refrigerator
- Bedrooms: Master bedroom 11 x 11 (Main); Bedroom 2 20 x 8 (Upper); Bedroom 3 10 x 10 (Upper); Bedroom 4 10 x 8 (Upper)
- Bathrooms: One full bathroom with a shower stall
- Heating & cooling: Forced air heating; Natural gas fuel
- Interior features: Living room 11 x 11 (Main); Dining room 11 x 8 (Main); Den/office 11 x 11 (Main); Basement: block, crawl space, full (partial)
- Laundry & utility: No specific laundry appliances listed
Neighborhood map
What this means for you Summary
Snapshot
- This is a 4-bed/1.0-bath single-family listed at $110k.
Deal economics
- At list price, monthly cash flow is $713 ($9k/yr) — positive.
- The deal already cash-flows at list — no discount required.
- Meets the 1% rule at list price ($2k rent vs $110k).
- Cap rate 14.1% vs local median 3.0% in La Crosse — top-decile yield for the area; either an underpriced asset or a hidden risk that comps aren't pricing in. Stress-test before assuming the spread holds.
Location & tenants
- Location reads 69/100 on livability (#339 in WI) — a middle-class / working-renter tenant base. Strengths: cost of living A+, housing A+; Watch: employment C-, schools D+, health & safety D.
- La Crosse School District (urban): math 29% / reading 34% proficiency, ranked #267 of 342 in WI (top 78%) — families likely to look elsewhere, expect single-tenant / working-renter base with shorter leases.
- Market conditions: Rents rising (+2.7%/yr); 222 active listings in the ZIP; 268 units permitted in La Crosse County in 2024 (10 in 5+ unit buildings).
- This rent runs 36% of the median local income ($62k/yr) — at the standard rent-burdened threshold; future hikes will face affordability resistance.
Forward outlook
- Local home prices are declining (-3.0%/yr); year-one equity from $757 of loan paydown is wiped out by about $3k of value loss. Plan a longer hold.
- La Crosse County population projected at +14% by 2050 — modest demand growth; plan on rents tracking national, not racing it.
- At projected returns (-3.0% appreciation + 2.7% rent growth), your $31k cash investment doubles in ~5 years — after that, you're playing with house money.
Negotiation context
- Only 7 days on market — expect competitive offers; lowballing is unlikely to land.
Risks & watch-outs
- Watch-outs: built in 1900 — expect roof / HVAC / electrical / plumbing capex.
Questions for the listing agent
- Built in 1900 — when were the roof, HVAC, electrical panel, plumbing, and water heater last replaced?
- Is there a deadline driving the sale (1031 exchange, divorce, estate, relocation)? That informs how much negotiation room exists.
- Schools are D-rated, which usually means shorter tenancies and higher turnover. Who's the typical renter profile here, and what's been the actual vacancy rate?
- Crime grade is F in this area — have there been break-ins, vandalism, or insurance claims at this property in the last 3 years? What carrier currently insures it and at what premium?
- What's the average days-on-market for RENTAL listings here right now (not sales)? A rising rental-DOM trend means longer vacancies and softer asking-rent achievability than the comps imply.
- What's the recent tenant-quality profile in this submarket — average credit score on applications, eviction rate, late-payment / NSF rate, and stable-employment percentage? A property-management company in the area should have these aggregated.
- How much new for-sale + rental construction is in the pipeline within 1–3 miles? Heavy new supply typically softens prices + rents 12–24 months out; constrained supply supports both.
Investment metrics
- 1% rule
- 1.68% ✓
- Cap rate
- 14.11%
- Cash-on-cash
- 27.91%
- DSCR
- 2.24
- GRM
- 5.0
CMA / ARV
- ARV (on-the-fly)
- $271,752
- Comps found
- 12
Show comp detail 12 sales within ~0.75 mi
| Address | Dist | Beds/Ba | Sqft | Sold | Price | $/sf | Match |
|---|---|---|---|---|---|---|---|
| 2933 Birch St | 0.47mi | 4/2.0 | 1,634 (+2%) | 7mo | $235,000 | $144 | 66 |
| 3144 25th Street St S | 0.70mi | 4/2.0 | 1,652 (+3%) | 1mo | $280,000 | $169 | 58 |
| 3420 Cliffside Dr | 0.73mi | 4/2.0 | 1,581 (-2%) | 2mo | $319,900 | $202 | 57 |
| 3409 Birch St | 0.62mi | 4/2.0 | 1,700 (+6%) | 3mo | $295,000 | $174 | 55 |
| 2423 Robinsdale Ave | 0.58mi | 3/2.0 (-1) | 1,680 (+4%) | 5mo | $250,000 | $149 | 52 |
| 3400 28th Street St S | 0.47mi | 3/2.0 (-1) | 1,766 (+10%) | 1mo | $245,000 | $139 | 52 |
| 3167 31st Street St S | 0.71mi | 4/2.0 | 1,500 (-7%) | 2mo | $331,000 | $221 | 50 |
| 3110 27th Street St S | 0.75mi | 4/2.0 | 1,713 (+6%) | 0mo | $250,000 | $146 | 50 |
| 3315 Leonard St | 0.64mi | 3/2.0 (-1) | 1,700 (+6%) | 3mo | $316,000 | $186 | 49 |
| 4605 Juniper St | 0.64mi | 3/2.0 (-1) | 1,695 (+5%) | 8mo | $239,900 | $142 | 46 |
| 3147 29th Street South St | 0.69mi | 4/1.0 | 1,416 (-12%) | 4mo | $240,000 | $169 | 44 |
| 3150 25th Street St S | 0.69mi | 3/2.0 (-1) | 1,400 (-13%) | 1mo | $305,000 | $218 | 36 |
Match score weights: distance 35% · size 25% · config 20% · recency 20%. Top-matched comps best support the ARV.
Projected returns pro-forma
-3.0% appreciation · 2.72% rent growth · sell at horizon
- IRR
- 21.7%
- Equity multiple
- 1.89×
- Total profit
- $27,168
- Equity at exit
- $16,327
- IRR
- 29.6%
- Equity multiple
- 3.61×
- Total profit
- $80,090
- Equity at exit
- $9,468
Cash invested: $30,660 (down + closing). Projections, not guarantees.
Landlord ↔ Tenant lean methodology
- Overall (STATE)
- 73 Landlord-Friendly
- State Wisconsin
- 73 Landlord-Friendly · R+2
- County
- — inherits STATE
- City
- — inherits STATE
ZIP-level market 54601
- Rents YoY
- 2.7%
- Active inventory
- 222
- Price-to-rent
- 5.0×
Monthly cashflow live
- Estimated rent
- $1,835 medium interval (Pro) →
- Mortgage (P&I)
- −$574
- Tax from tax record
- −$116 /mo · $1,398/yr
- Insurance
- −$46
- HOA
- −$0
- Vacancy / Maint / Mgmt
- −$385
- Net cashflow
- $713
Break-even live
UW: 25.0% down · 7.5% · 30yr · 1.5% tax · 5.0% vac · 8.0% maint · 8.0% mgmt
Financing live
Cash to close
- Down payment
- $27,375
- Closing costs
- $3,285
- Reserves months
- —
- Total cash needed
- —
Loan-product check · same deal, 3 products live
Conventional
25% down · 7.5% · 30yr
- Down + closing
- —
- Monthly P&I
- —
- Monthly cashflow
- —
- DSCR
- —
- Eligible?
- —
Personal DTI + credit; lowest rate.
DSCR
20% down · 8.5% · 30yr
- Down + closing
- —
- Monthly P&I
- —
- Monthly cashflow
- —
- DSCR
- —
- Eligible?
- —
No personal income docs; deal must DSCR.
Hard money
10% down · 12.0% · 12mo
- Down + closing
- —
- Monthly P&I
- —
- Monthly cashflow
- —
- DSCR
- —
- Eligible?
- —
Short-term bridge; refi at stabilization.
Listing history 7 events
-
2026-06-05status $109,500 Pending 7 DOM
-
2026-06-03days on market $109,500 Active 7 DOM
-
2026-06-02days on market $109,500 Active 6 DOM
-
2026-06-01days on market $109,500 Active 5 DOM
-
2026-05-31days on market $109,500 Active 4 DOM
-
2026-05-30days on market $109,500 Active 3 DOM
-
2026-05-27$109,500 Active
ⓘ Source: listings_history table (triggers on properties + properties_extension) + one-shot
backfill from property_details.listing_events for pre-trigger history.
Tax reassessment forecast WI · Partial reset (capped growth)
- Current annual tax
- $1,398 · $116/mo
- Projected year-2 tax
- $1,712 · $143/mo
- Expected delta
- +$314/yr (+$26/mo · 22.5%)
ⓘ Screening estimate from a state-policy table — verify with the county assessor before closing.
Climate risk First Street
- Flood 1/10 Low FEMA zone X (unshaded) · 0% chance over 30 yrs
- Wildfire 1/10 Low
- Heat 2/10 Low 7 d/yr ≥99°F today · 14 d/yr by 30 yrs out
- Wind 2/10 Low
- Air quality 1/10 Low 0 unhealthy d/yr today · 0 by 30 yrs out
Nearby sold comps map
Loading sold comps map…
Walkable amenities ~0.75 mi
Loading nearby amenities…
Taxation est. · year 1
- Rental income
- $22,015
- − Mortgage interest
- −$6,134
- − Property taxes
- −$1,398
- − Insurance
- −$548
- − Repairs & maintenance
- −$1,761
- − Management
- −$1,761
- − Depreciation
- −$3,185
- Taxable income
- $7,228
- Est. tax owed @ 24.0%
- −$1,735
- After-tax cash flow
- $6,821/yr
For passive investors: Depreciation is non-cash, so a rental often shows a tax loss while cash-flowing — sheltering income. Rental losses are passive: they offset passive income freely, and up to $25,000/yr can offset ordinary (W-2) income if you actively participate and your MAGI is under $100k (phasing out to $0 by $150k); unused losses carry forward. On sale, claimed depreciation is recaptured at up to 25%, and gains may owe capital-gains tax (a 1031 exchange can defer both). Figures are a year-1 estimate at your 24.0% rate — not tax advice; consult a CPA.
Schools (NCES district)
- District
- La Crosse School District
- NCES district ID
- 5507530
- Math proficiency
- 29% ▼ -8.00%
- Reading proficiency
- 34% ▼ -4.00%
- Median HH income
- $42,924
- Composite
- 26.76/100
- National rank
- #7135
- State rank
- #267 of 342 in WI
Livability — La Crosse
- Score
- 69/100
- State rank
- #339
- US rank
- #8671
Category grades
Schools grade is shown separately in the Schools card above.
Census & demographics
- County
- La Crosse County · 89,439 people
- City population
- 64,135
- Metro
- La Crosse-Onalaska, WI-MN
- Population (ZIP)
- 50,397
- Household income
- $61,639
- Rent vs Own
- Severe rent burden
- 2352.0
Population outlook (La Crosse County) Hauer SSP2
- Today (2025)
- 126,082 people
- By 2030
- 130,161 · +3.2%
- By 2040
- 137,231 · +8.8%
- By 2050
- 143,506 · +13.8%
- By 2075
- 160,149 · +27.0%
- By 2100
- 166,408 · +32.0%
Race, ethnicity, and origin ACS 2023
- Neighborhood character
- Predominantly White (89%)
- Race & ethnicity
- White 89% Asian 4% Two or more races 3% Hispanic / Latino 3% Black 1%
- Common ancestry
- Portuguese 14% Romanian 6% Lithuanian 2%
- Foreign-born
- 3% · Canada
- Languages at home
- 95% English-only · Spanish 2% Other Asian/Pacific 1% Other Indo-European 1%
Political lean MEDSL · La Crosse
- 2024 margin
- Lean D (+9.4) · D 54.0% · R 44.6% · Other 1.4%
- 2008→2024 swing
- -14.1pp toward R · 2008: 23.4pp · 2024: 9.4pp
- All cycles
- 2024: D+9.4 2020: D+13.5 2016: D+9.6 2012: D+17.3 2008: D+23.4
Not yet ingested
- Civics
- —
Market trends
- HPI YoY
- ▼ -186.70%
- Current HPI
- 236.4506
- Rent YoY
- ▲ 2.72%
- Metro
- La Crosse-Onalaska, WI-MN
- State GDP YoY
- ▲ 2.10%
- F500 in state
- 20
Industry mix (Fortune 500 HQ in WI)
| Industry | F500 HQs | Revenue |
|---|---|---|
| Industrial Machinery | 4 | $23B |
|
||
| Industrial Technology | 2 | $36B |
|
||
| Insurance | 1 | $36B |
|
||
| Professional Services | 1 | $19B |
|
||
| Utilities | 1 | $9B |
|
||
| Consumer Goods | 1 | $3B |
|
||
Price history
1 event — show timeline
- 2026-05-27 Listed $109,500 METROMLS
Property tax history
+1.6%/yrLatest (2025): $1,398 · +7.4% YoY. Source: county tax records.
Cash-flow waterfall
monthlySold comps — $/sqft
last 12 mo · ≤1 miLoading sold comps…