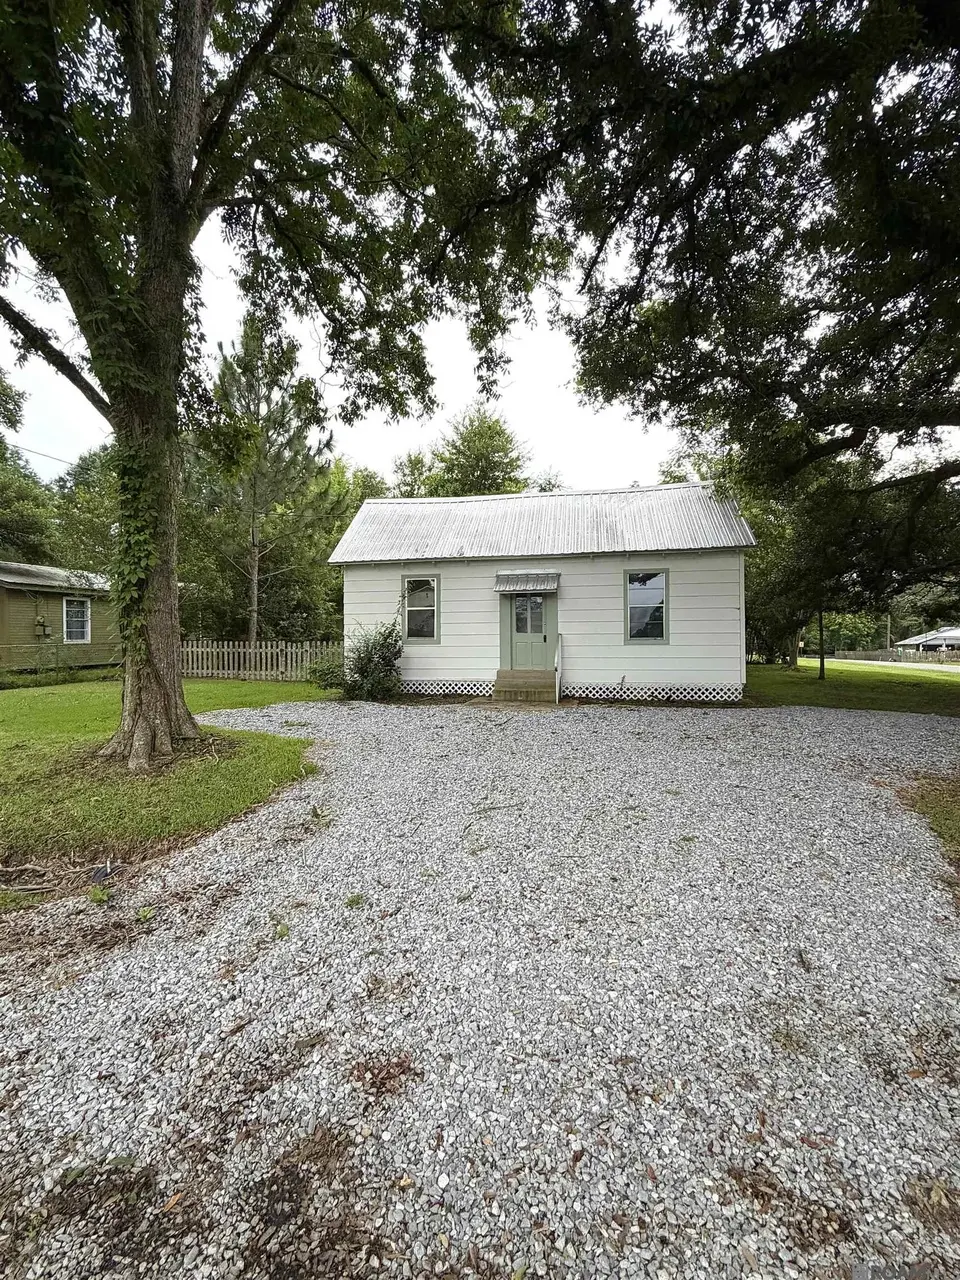
1412 Chestnut St · Jackson, LA
Flood risk 1/10 · Minimal
- FEMA flood zone
- X (unshaded)
- Chance of flooding over 30 yrs
- 0.0%
- Est. flood insurance / yr
- $507 – $1,088
Fire risk 3/10 · Minor
- Est. fire insurance / yr
- $1,269 – $2,357
Heat risk 7/10 · Major
- Hot days now (above 108°F)
- 7 days/yr
- Hot days in 30 yrs
- 19 days/yr
Wind risk 8/10 · Major
- Chance of severe wind over 30 yrs
- 99.0%
Air-quality risk 2/10 · Minimal
- Unhealthy air days now
- 1 days/yr
- Unhealthy air days in 30 yrs
- 2 days/yr
Risk factors via First Street. Map © Google.
Why this score? — see what drove the B- grade
The composite is a weighted blend of 9 inputs, each scored 0–100. Each bar is that input's sub-score; the figure is the points it added to the 100-point composite (weight × sub-score).
- Cash flow +30.0/30.0
- DSCR +10.0/10.0
- 1% rule +7.7/10.0
- ARV discount +7.7/15.0
- Livability +3.1/5.0
- Rent growth +2.5/5.0
- Condition / age +2.5/5.0
- Schools +2.0/10.0
- Appreciation +0.0/10.0
$118,000
🖨 Deal sheet 📄 Offer letter ✓ Due diligence
Listing remarks
Adorable 2BR/1BA cottage in Jackson, LA featuring a metal roof, fenced backyard, beautiful shade trees, and plenty of small town charm. This cozy home offers low-maintenance living and would make a great starter home, rental property, or place to downsize. Don't miss this affordable opportunity! THE LISTING AGENT MAKES NO REPRESENTATIONS AND OR WARRANTIES, EXPRESSED OR IMPLIED, REGARDING THE PROPERTY'S CONDITION, SUITABILITY FOR A PARTICULAR PURPOSE, OR ANY OTHER ASPECT OF THE PROPERTY. THE BUYER IS ADVISED TO VERIFY ALL INFORMATION PROVIDED IN THE LISTING WITH THEIR OWN SOURCES.
Key facts
- Metal roof
- Shade trees
- Fenced backyard
Tags
Property features AI
Finance
- Other: Located in the Town of Jackson subdivision; Elementary/Middle/High school district: East Feliciana Parish
Exterior
- Parking: 3 parking spaces
- Utilities: Public water; Public sewer
- Home design: Detached single-family residence; Residential property
- Construction: Foundation: Other
- Exterior features: Wood fencing; Metal roof; Lot approximately 0.13 acres with roughly 75 x 75 dimensions
Interior
- Bathrooms: 1 full bathroom
- Heating & cooling: Window unit(s) for cooling; Space heater for heating
- Interior features: Window cooling units; Space heater for heating
Neighborhood map
What this means for you Summary
Snapshot
- This is a 2-bed/1.0-bath single-family listed at $118k.
Deal economics
- At list price, monthly cash flow is $492 ($6k/yr) — positive.
- The deal already cash-flows at list — no discount required.
- Meets the 1% rule at list price ($2k rent vs $118k).
- Cap rate 11.3% vs local median 1.9% in Jackson — top-decile yield for the area; either an underpriced asset or a hidden risk that comps aren't pricing in. Stress-test before assuming the spread holds.
Location & tenants
- Location reads 61/100 on livability (#239 in LA) — a middle-class / working-renter tenant base. Strengths: cost of living A+, housing A+; Watch: schools D+, crime F, amenities F.
- East Feliciana Parish (rural): math 19% / reading 28% proficiency, ranked #62 of 98 in LA (top 63%) — low school quality limits family demand, transient renter base, plan for 1-2y turnover; 75% free/reduced lunch — lower-income household profile, screen leases tightly.
- Market conditions: 65 active listings in the ZIP; 1 comparable units currently listed for rent nearby; 42 units permitted in East Feliciana Parish in 2024 (0 in 5+ unit buildings).
Forward outlook
- Local home prices are declining (-3.0%/yr); year-one equity from $816 of loan paydown is wiped out by about $4k of value loss. Plan a longer hold.
- East Feliciana County population projected at -18% by 2050 — secular population decline; favor cash flow + early exit over multi-decade hold.
- At projected returns (-3.0% appreciation + 3.0% rent growth), your $33k cash investment doubles in ~7 years — after that, you're playing with house money.
Negotiation context
- Only 14 days on market — expect competitive offers; lowballing is unlikely to land.
- 9 sale attempts since 20y ago with the ask held roughly flat each time — persistent listings suggest the price (not the market) is what's stuck; bring a comps-based counter.
- Current owner paid $58k; list at $118k implies a 103% gain — meaningful room to come down on a strong offer.
Risks & watch-outs
- Watch-outs: built in 1950 — expect roof / HVAC / electrical / plumbing capex.
- Climate carrying-cost: severe wind risk, 99% chance of damaging wind over 30y; extreme-heat days projected 7→19/yr by 2055 (HVAC capex compounding) — expect insurance premiums to compound above CPI over the hold.
Questions for the listing agent
- Built in 1950 — when were the roof, HVAC, electrical panel, plumbing, and water heater last replaced?
- Is there a deadline driving the sale (1031 exchange, divorce, estate, relocation)? That informs how much negotiation room exists.
- Schools are D-rated, which usually means shorter tenancies and higher turnover. Who's the typical renter profile here, and what's been the actual vacancy rate?
- Crime grade is F in this area — have there been break-ins, vandalism, or insurance claims at this property in the last 3 years? What carrier currently insures it and at what premium?
- What's the average days-on-market for RENTAL listings here right now (not sales)? A rising rental-DOM trend means longer vacancies and softer asking-rent achievability than the comps imply.
- What's the recent tenant-quality profile in this submarket — average credit score on applications, eviction rate, late-payment / NSF rate, and stable-employment percentage? A property-management company in the area should have these aggregated.
- How much new for-sale + rental construction is in the pipeline within 1–3 miles? Heavy new supply typically softens prices + rents 12–24 months out; constrained supply supports both.
Investment metrics
- 1% rule
- 1.27% ✓
- Cap rate
- 11.29%
- Cash-on-cash
- 17.86%
- DSCR
- 1.79
- GRM
- 6.6
CMA / ARV
- ARV (on-the-fly)
- $118,436
- Comps found
- 2
Show comp detail 2 sales within ~0.75 mi
| Address | Dist | Beds/Ba | Sqft | Sold | Price | $/sf | Match |
|---|---|---|---|---|---|---|---|
| 3036 Bourbon St | 0.17mi | 2/1.0 | 904 (-12%) | 17mo | $105,000 | $116 | 59 |
| 2222 Highway 10 | 0.61mi | 2/1.0 | 1,154 (+13%) | 11mo | $89,900 | $78 | 41 |
Match score weights: distance 35% · size 25% · config 20% · recency 20%. Top-matched comps best support the ARV.
Projected returns pro-forma
-3.0% appreciation · 3.0% rent growth · sell at horizon
- IRR
- 9.3%
- Equity multiple
- 1.37×
- Total profit
- $12,151
- Equity at exit
- $17,594
- IRR
- 18.5%
- Equity multiple
- 2.53×
- Total profit
- $50,702
- Equity at exit
- $10,202
Cash invested: $33,040 (down + closing). Projections, not guarantees.
Landlord ↔ Tenant lean methodology
- Overall (STATE)
- 90 Strongly Landlord-Friendly
- State Louisiana
- 90 Strongly Landlord-Friendly · R+12
- County
- — inherits STATE
- City
- — inherits STATE
ZIP-level market 70748
- Home prices YoY
- -26.2%
- Active inventory
- 65
- Price-to-rent
- 6.6×
Monthly cashflow live
- Estimated rent
- $1,500 medium interval (Pro) →
- Mortgage (P&I)
- −$619
- Tax from tax record
- −$25 /mo · $303/yr
- Insurance
- −$49
- HOA
- −$0
- Vacancy / Maint / Mgmt
- −$315
- Net cashflow
- $492
Break-even live
UW: 25.0% down · 7.5% · 30yr · 1.5% tax · 5.0% vac · 8.0% maint · 8.0% mgmt
Financing live
Cash to close
- Down payment
- $29,500
- Closing costs
- $3,540
- Reserves months
- —
- Total cash needed
- —
Loan-product check · same deal, 3 products live
Conventional
25% down · 7.5% · 30yr
- Down + closing
- —
- Monthly P&I
- —
- Monthly cashflow
- —
- DSCR
- —
- Eligible?
- —
Personal DTI + credit; lowest rate.
DSCR
20% down · 8.5% · 30yr
- Down + closing
- —
- Monthly P&I
- —
- Monthly cashflow
- —
- DSCR
- —
- Eligible?
- —
No personal income docs; deal must DSCR.
Hard money
10% down · 12.0% · 12mo
- Down + closing
- —
- Monthly P&I
- —
- Monthly cashflow
- —
- DSCR
- —
- Eligible?
- —
Short-term bridge; refi at stabilization.
Rent comps 1 comps
| Address | Beds | Baths | Sqft | Rent | $/sqft | DOM | Units | Dist |
|---|---|---|---|---|---|---|---|---|
| 1731 Walnut St Jackson, LA | 3.0 | 1.0 | 1500 | $1,500 | $1.00 | 23d | 1 | 0.46mi |
Listing history 11 events
-
2026-06-18days on market $118,000 Active 14 DOM
-
2026-06-17days on market $118,000 Active 13 DOM
-
2026-06-16days on market $118,000 Active 12 DOM
-
2026-06-15days on market $118,000 Active 11 DOM
-
2026-06-14days on market $118,000 Active 9 DOM
-
2026-06-10days on market $118,000 Active 6 DOM
-
2026-06-09days on market $118,000 Active 5 DOM
-
2026-06-08days on market $118,000 Active 4 DOM
-
2026-06-07days on market $118,000 Active 3 DOM
-
2026-06-05remarks 586-char remark
-
2026-06-05$118,000 Active 1 DOM
ⓘ Source: listings_history table (triggers on properties + properties_extension) + one-shot
backfill from property_details.listing_events for pre-trigger history.
Tax reassessment forecast LA · Resets to sale price
- Current annual tax
- $303 · $25/mo
- Projected year-2 tax
- $649 · $54/mo
- Expected delta
- +$346/yr (+$29/mo · 114.5%)
ⓘ Screening estimate from a state-policy table — verify with the county assessor before closing.
Climate risk First Street
- Flood 1/10 Low FEMA zone X (unshaded) · 0% chance over 30 yrs
- Wildfire 3/10 Moderate
- Heat 7/10 Severe 7 d/yr ≥108°F today · 19 d/yr by 30 yrs out
- Wind 8/10 Severe 99% chance of damaging wind over 30 yrs
- Air quality 2/10 Low 1 unhealthy d/yr today · 2 by 30 yrs out
Nearby sold comps map
Loading sold comps map…
Walkable amenities ~0.75 mi
Loading nearby amenities…
Taxation est. · year 1
- Rental income
- $18,000
- − Mortgage interest
- −$6,610
- − Property taxes
- −$303
- − Insurance
- −$590
- − Repairs & maintenance
- −$1,440
- − Management
- −$1,440
- − Depreciation
- −$3,433
- Taxable income
- $4,185
- Est. tax owed @ 24.0%
- −$1,004
- After-tax cash flow
- $4,897/yr
For passive investors: Depreciation is non-cash, so a rental often shows a tax loss while cash-flowing — sheltering income. Rental losses are passive: they offset passive income freely, and up to $25,000/yr can offset ordinary (W-2) income if you actively participate and your MAGI is under $100k (phasing out to $0 by $150k); unused losses carry forward. On sale, claimed depreciation is recaptured at up to 25%, and gains may owe capital-gains tax (a 1031 exchange can defer both). Figures are a year-1 estimate at your 24.0% rate — not tax advice; consult a CPA.
Schools (NCES district)
- District
- East Feliciana Parish
- NCES district ID
- 2200600
- Math proficiency
- 19% ▼ -36.00%
- Reading proficiency
- 28% ▼ -37.00%
- Median HH income
- $43,478
- Composite
- 20.16/100
- National rank
- #8636
- State rank
- #62 of 98 in LA
Livability — Jackson
- Score
- 61/100
- State rank
- #239
- US rank
- #18179
Category grades
Schools grade is shown separately in the Schools card above.
Census & demographics
- Census place
- Jackson, LA
- City population
- 7,016
- Population (ZIP)
- 7,016
Population outlook (East Feliciana County) Hauer SSP2
- Today (2025)
- 18,858 people
- By 2030
- 18,225 · -3.4%
- By 2040
- 16,760 · -11.1%
- By 2050
- 15,456 · -18.0%
- By 2075
- 13,112 · -30.5%
- By 2100
- 11,117 · -41.0%
Race, ethnicity, and origin ACS 2023
- Neighborhood character
- Diverse neighborhood (Simpson 0.61)
- Race & ethnicity
- Black 47% White 41% Two or more races 9% Hispanic / Latino 5% Native American 1%
- Common ancestry
- Lithuanian 7% Italian 4% Slovak 1%
- Foreign-born
- 1% · Canada
- Languages at home
- 97% English-only · Spanish 1% French/Haitian/Cajun 1%
Political lean MEDSL · East Feliciana
- 2024 margin
- Strong R (+22.2) · D 38.3% · R 60.5% · Other 1.2%
- 2008→2024 swing
- -11.7pp toward R · 2008: -10.6pp · 2024: -22.2pp
- All cycles
- 2024: R+22.2 2020: R+17.0 2016: R+13.3 2012: R+7.3 2008: R+10.6
Not yet ingested
- Civics
- —
Market trends
- HPI YoY
- ▼ -48.49%
- Current HPI
- 136.6804
- Rent YoY
- —
- Metro
- —
- State GDP YoY
- ▲ 3.29%
- F500 in state
- 10
Industry mix (Fortune 500 HQ in LA)
| Industry | F500 HQs | Revenue |
|---|---|---|
| Telecommunications | 2 | $23B |
|
||
| Utilities | 1 | $12B |
|
||
| Wholesale / Distribution | 1 | $5B |
|
||
| Advertising | 1 | $2B |
|
||
Price history
+237.1% since first listed20 events — show timeline
- 2026-06-04 Listed $118,000 GBRMLS
- 2026-01-29 Price Changed $119,000 AcadianaMLS
- 2026-01-29 Price Changed $119,000 GBRMLS
- 2025-11-07 Listed $125,000 AcadianaMLS
- 2025-11-07 Listed $125,000 GBRMLS
- 2023-08-15 Sold (Public Records) $58,000 Public Records
- 2023-08-14 Sold (MLS) — GBRMLS
- 2023-07-10 Pending — GBRMLS
- 2023-06-22 Price Changed $73,000 GBRMLS
- 2023-05-17 Price Changed $75,000 GBRMLS
- 2023-05-17 Relisted — GBRMLS
- 2023-05-08 Pending — GBRMLS
- 2023-04-02 Price Changed $89,900 GBRMLS
- 2023-03-22 Relisted — GBRMLS
- 2023-02-25 Delisted — GBRMLS
- 2023-02-14 Listed $73,000 AcadianaMLS
- 2023-02-14 Listed $95,000 GBRMLS
- 2006-05-04 Sold (MLS) — GBRMLS
- 2006-03-22 Listed $35,000 AcadianaMLS
- 2006-03-22 Listed $35,000 GBRMLS
Property tax history
+3.7%/yrLatest (2025): $303 · -10.1% YoY. Source: county tax records.
Cash-flow waterfall
monthlySold comps — $/sqft
last 12 mo · ≤1 miLoading sold comps…