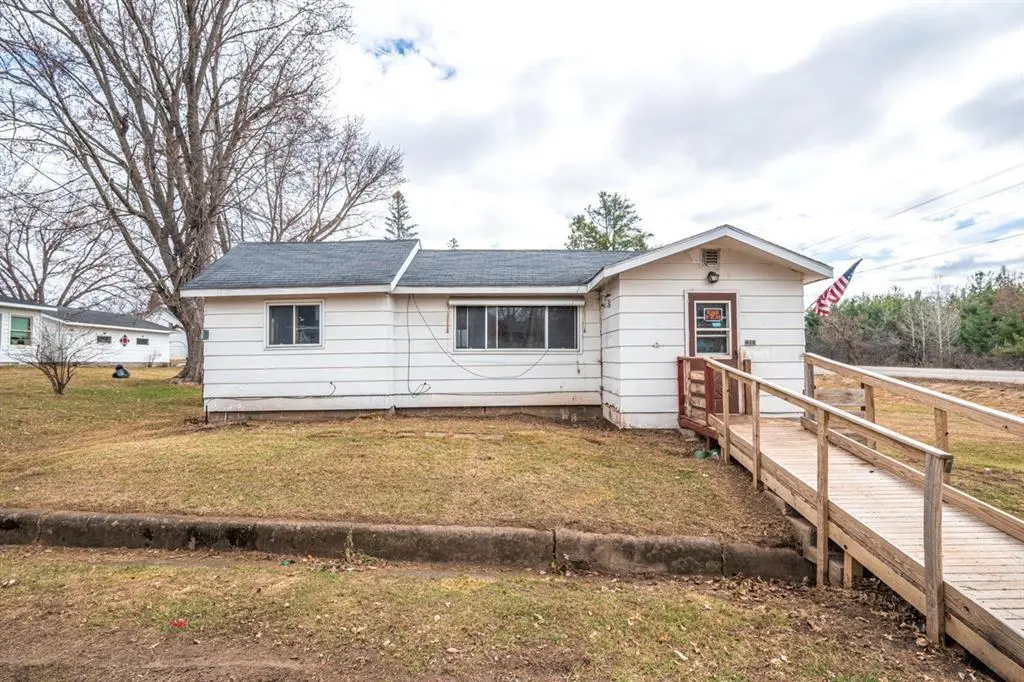
610 2nd St · Bruce, WI
Flood risk 1/10 · Minimal
- FEMA flood zone
- X (unshaded)
- Chance of flooding over 30 yrs
- 0.0%
- Est. flood insurance / yr
- $473 – $860
Fire risk 3/10 · Minor
- Est. fire insurance / yr
- $636 – $1,182
Heat risk 1/10 · Minimal
- Hot days now (above 95°F)
- 7 days/yr
- Hot days in 30 yrs
- 13 days/yr
Wind risk 1/10 · Minimal
- Chance of severe wind over 30 yrs
- —
Air-quality risk 2/10 · Minimal
- Unhealthy air days now
- 1 days/yr
- Unhealthy air days in 30 yrs
- 1 days/yr
Risk factors via First Street. Map © Google.
Why this score? — see what drove the B+ grade
The composite is a weighted blend of 9 inputs, each scored 0–100. Each bar is that input's sub-score; the figure is the points it added to the 100-point composite (weight × sub-score).
- Cash flow +30.0/30.0
- ARV discount +15.0/15.0
- 1% rule +10.0/10.0
- DSCR +10.0/10.0
- Livability +3.0/5.0
- Schools +2.9/10.0
- Rent growth +2.5/5.0
- Condition / age +2.5/5.0
- Appreciation +0.0/10.0
$61,700
🖨 Deal sheet 📄 Offer letter ✓ Due diligence
Listing remarks MLS
Opportunity awaits at 610 N 2nd St in Bruce! This two-bedroom home offers convenient main floor living with both bedrooms, a full bath, kitchen, and a spacious living area all on one level. The lower level is unfinished and includes a tuck-under style garage, providing additional storage and flexibility. Located in the Village of Bruce, this property presents a great opportunity for owner-occupants or investors to add value and make it their own.
Key facts
- Main floor living
- Additional storage
- 0.23 acre lot
Tags
Neighborhood map
What this means for you Summary
Snapshot
- This is a 2-bed/1.0-bath other listed at $62k.
Deal economics
- At list price, monthly cash flow is $489 ($6k/yr) — positive.
- The deal already cash-flows at list — no discount required.
- Meets the 1% rule at list price ($1k rent vs $62k).
- Recommended offer: $60k (3.0% below list) — sets the bar for market timing.
Location & tenants
- Location reads 60/100 on livability (#700 in WI) — a middle-class / working-renter tenant base. Strengths: cost of living A+, housing A; Watch: crime C-, health & safety D, schools D-.
- Bruce School District (rural): math 40% / reading 30% proficiency, ranked #240 of 342 in WI (top 70%) — families likely to look elsewhere, expect single-tenant / working-renter base with shorter leases.
- Market conditions: 135 active listings in the ZIP; 90 units permitted in Rusk County in 2024 (0 in 5+ unit buildings).
Forward outlook
- Local home prices are declining (-3.0%/yr); year-one equity from $427 of loan paydown is wiped out by about $2k of value loss. Plan a longer hold.
- Rusk County population projected at -29% by 2050 — secular population decline; favor cash flow + early exit over multi-decade hold.
- At projected returns (-3.0% appreciation + 3.0% rent growth), your $17k cash investment doubles in ~4 years — after that, you're playing with house money.
Negotiation context
- It's been on market 45 days — a 3% lower offer ($60k) is reasonable based on typical stale-listing flexibility.
Questions for the listing agent
- It's been on market 45 days. Have you received any prior offers? Is the seller open to a 3% concession, seller financing, or rate buy-down credit?
- Built in 1965 — when were the roof, HVAC, electrical panel, plumbing, and water heater last replaced?
- Is there a deadline driving the sale (1031 exchange, divorce, estate, relocation)? That informs how much negotiation room exists.
- Schools are D-rated, which usually means shorter tenancies and higher turnover. Who's the typical renter profile here, and what's been the actual vacancy rate?
- What's the average days-on-market for RENTAL listings here right now (not sales)? A rising rental-DOM trend means longer vacancies and softer asking-rent achievability than the comps imply.
- What's the recent tenant-quality profile in this submarket — average credit score on applications, eviction rate, late-payment / NSF rate, and stable-employment percentage? A property-management company in the area should have these aggregated.
- How much new for-sale + rental construction is in the pipeline within 1–3 miles? Heavy new supply typically softens prices + rents 12–24 months out; constrained supply supports both.
Investment metrics
- 1% rule
- 1.87% ✓
- Cap rate
- 15.80%
- Cash-on-cash
- 33.96%
- DSCR
- 2.51
- GRM
- 4.5
CMA / ARV
- ARV (median comp)
- $88,120
- List price
- $61,700
- Delta
- -29.98%
- Verdict
- UNDERPRICED
- Comps
- 8 within 1.0 mi
Projected returns pro-forma
-3.0% appreciation · 3.0% rent growth · sell at horizon
- IRR
- 29.3%
- Equity multiple
- 2.22×
- Total profit
- $21,153
- Equity at exit
- $9,200
- IRR
- 36.7%
- Equity multiple
- 4.39×
- Total profit
- $58,570
- Equity at exit
- $5,335
Cash invested: $17,276 (down + closing). Projections, not guarantees.
Landlord ↔ Tenant lean methodology
- Overall (STATE)
- 73 Landlord-Friendly
- State Wisconsin
- 73 Landlord-Friendly · R+2
- County
- — inherits STATE
- City
- — inherits STATE
ZIP-level market 54868
- Home prices YoY
- -33.3%
- Active inventory
- 135
- Price-to-rent
- 4.5×
Monthly cashflow live
- Estimated rent
- $1,151 medium interval (Pro) →
- Mortgage (P&I)
- −$324
- Tax from tax record
- −$71 /mo · $857/yr
- Insurance
- −$26
- HOA
- −$0
- Vacancy / Maint / Mgmt
- −$242
- Net cashflow
- $489
Break-even live
UW: 25.0% down · 7.5% · 30yr · 1.5% tax · 5.0% vac · 8.0% maint · 8.0% mgmt
Financing live
Cash to close
- Down payment
- $15,425
- Closing costs
- $1,851
- Reserves months
- —
- Total cash needed
- —
Loan-product check · same deal, 3 products live
Conventional
25% down · 7.5% · 30yr
- Down + closing
- —
- Monthly P&I
- —
- Monthly cashflow
- —
- DSCR
- —
- Eligible?
- —
Personal DTI + credit; lowest rate.
DSCR
20% down · 8.5% · 30yr
- Down + closing
- —
- Monthly P&I
- —
- Monthly cashflow
- —
- DSCR
- —
- Eligible?
- —
No personal income docs; deal must DSCR.
Hard money
10% down · 12.0% · 12mo
- Down + closing
- —
- Monthly P&I
- —
- Monthly cashflow
- —
- DSCR
- —
- Eligible?
- —
Short-term bridge; refi at stabilization.
Listing history 4 events
-
2026-05-12price $61,700 450-char remark
Show marketing remark (450 chars)
Opportunity awaits at 610 N 2nd St in Bruce! This two-bedroom home offers convenient main floor living with both bedrooms, a full bath, kitchen, and a spacious living area all on one level. The lower level is unfinished and includes a tuck-under style garage, providing additional storage and flexibility. Located in the Village of Bruce, this property presents a great opportunity for owner-occupants or investors to add value and make it their own.
-
2026-04-11$72,500 Active 450-char remark
Show marketing remark (450 chars)
Opportunity awaits at 610 N 2nd St in Bruce! This two-bedroom home offers convenient main floor living with both bedrooms, a full bath, kitchen, and a spacious living area all on one level. The lower level is unfinished and includes a tuck-under style garage, providing additional storage and flexibility. Located in the Village of Bruce, this property presents a great opportunity for owner-occupants or investors to add value and make it their own.
-
2022-08-23soldstatus $100,000
-
2021-11-30soldstatus $50,000
ⓘ Source: listings_history table (triggers on properties + properties_extension) + one-shot
backfill from property_details.listing_events for pre-trigger history.
Tax reassessment forecast WI · Partial reset (capped growth)
- Current annual tax
- $857 · $71/mo
- Projected year-2 tax
- $999 · $83/mo
- Expected delta
- +$142/yr (+$12/mo · 16.6%)
ⓘ Screening estimate from a state-policy table — verify with the county assessor before closing.
Climate risk First Street
- Flood 1/10 Low FEMA zone X (unshaded) · 0% chance over 30 yrs
- Wildfire 3/10 Moderate
- Heat 1/10 Low 7 d/yr ≥95°F today · 13 d/yr by 30 yrs out
- Wind 1/10 Low
- Air quality 2/10 Low 1 unhealthy d/yr today · 1 by 30 yrs out
Nearby sold comps map
Loading sold comps map…
Walkable amenities ~0.75 mi
Loading nearby amenities…
Taxation est. · year 1
- Rental income
- $13,816
- − Mortgage interest
- −$3,456
- − Property taxes
- −$857
- − Insurance
- −$308
- − Repairs & maintenance
- −$1,105
- − Management
- −$1,105
- − Depreciation
- −$1,795
- Taxable income
- $5,189
- Est. tax owed @ 24.0%
- −$1,245
- After-tax cash flow
- $4,621/yr
For passive investors: Depreciation is non-cash, so a rental often shows a tax loss while cash-flowing — sheltering income. Rental losses are passive: they offset passive income freely, and up to $25,000/yr can offset ordinary (W-2) income if you actively participate and your MAGI is under $100k (phasing out to $0 by $150k); unused losses carry forward. On sale, claimed depreciation is recaptured at up to 25%, and gains may owe capital-gains tax (a 1031 exchange can defer both). Figures are a year-1 estimate at your 24.0% rate — not tax advice; consult a CPA.
Schools (NCES district)
- District
- Bruce School District
- NCES district ID
- 5501830
- Math proficiency
- 40% ▼ -10.00%
- Reading proficiency
- 30% ▼ -4.00%
- Median HH income
- $40,032
- Composite
- 29.45/100
- National rank
- #6516
- State rank
- #240 of 342 in WI
Livability — Bruce
- Score
- 60/100
- State rank
- #700
- US rank
- #18959
Category grades
Schools grade is shown separately in the Schools card above.
Census & demographics
- Census place
- Bruce, WI
- Population (ZIP)
- 16,054
Population outlook (Rusk County) Hauer SSP2
- Today (2025)
- 12,916 people
- By 2030
- 12,181 · -5.7%
- By 2040
- 10,611 · -17.8%
- By 2050
- 9,174 · -29.0%
- By 2075
- 7,137 · -44.7%
- By 2100
- 5,766 · -55.4%
Race, ethnicity, and origin ACS 2023
- Neighborhood character
- Predominantly White (93%)
- Race & ethnicity
- White 93% Hispanic / Latino 3% Two or more races 2%
- Common ancestry
- Portuguese 17% Lithuanian 6% Romanian 5%
- Foreign-born
- 2% · Canada
- Languages at home
- 98% English-only · Spanish 1%
Political lean MEDSL · Rusk
- 2024 margin
- Solid R (+38.0) · D 30.5% · R 68.5% · Other 1.0%
- 2008→2024 swing
- -46.3pp toward R · 2008: 8.3pp · 2024: -38.0pp
- All cycles
- 2024: R+38.0 2020: R+34.7 2016: R+34.0 2012: R+3.9 2008: D+8.3
Not yet ingested
- Civics
- —
Market trends
- HPI YoY
- ▼ -110.44%
- Current HPI
- 221.0095
- Rent YoY
- —
- Metro
- —
- State GDP YoY
- ▲ 2.10%
- F500 in state
- 20
Industry mix (Fortune 500 HQ in WI)
| Industry | F500 HQs | Revenue |
|---|---|---|
| Industrial Machinery | 4 | $23B |
|
||
| Industrial Technology | 2 | $36B |
|
||
| Insurance | 1 | $36B |
|
||
| Professional Services | 1 | $19B |
|
||
| Utilities | 1 | $9B |
|
||
| Consumer Goods | 1 | $3B |
|
||
Price history
+23.4% since first listed4 events — show timeline
- 2026-05-12 Price Changed $61,700 RANWW
- 2026-04-11 Listed $72,500 RANWW
- 2022-08-23 Sold (Public Records) $100,000 Public Records
- 2021-11-30 Sold (Public Records) $50,000 Public Records
Property tax history
+7.7%/yrLatest (2025): $857 · +25.3% YoY. Source: county tax records.
Cash-flow waterfall
monthlySold comps — $/sqft
last 12 mo · ≤1 miLoading sold comps…