66047 EATON RD. Plan · Pinellas Park, FL
Flood risk No data
- FEMA flood zone
- —
- Chance of flooding over 30 yrs
- —
- Est. flood insurance / yr
- —
Fire risk No data
- Est. fire insurance / yr
- —
Heat risk No data
- Hot days now (above threshold)
- —
- Hot days in 30 yrs
- —
Wind risk No data
- Chance of severe wind over 30 yrs
- —
Air-quality risk No data
- Unhealthy air days now
- —
- Unhealthy air days in 30 yrs
- —
Risk factors via First Street. Map © Google.
Why this score? — see what drove the B+ grade
The composite is a weighted blend of 9 inputs, each scored 0–100. Each bar is that input's sub-score; the figure is the points it added to the 100-point composite (weight × sub-score).
- Cash flow +30.0/30.0
- ARV discount +15.0/15.0
- DSCR +10.0/10.0
- 1% rule +8.9/10.0
- Condition / age +5.0/5.0
- Schools +4.3/10.0
- Livability +3.9/5.0
- Rent growth +1.2/5.0
- Appreciation +0.0/10.0
$157,995
🖨 Deal sheet (PDF) 📄 Offer letter ✓ Due diligence
Listing remarks
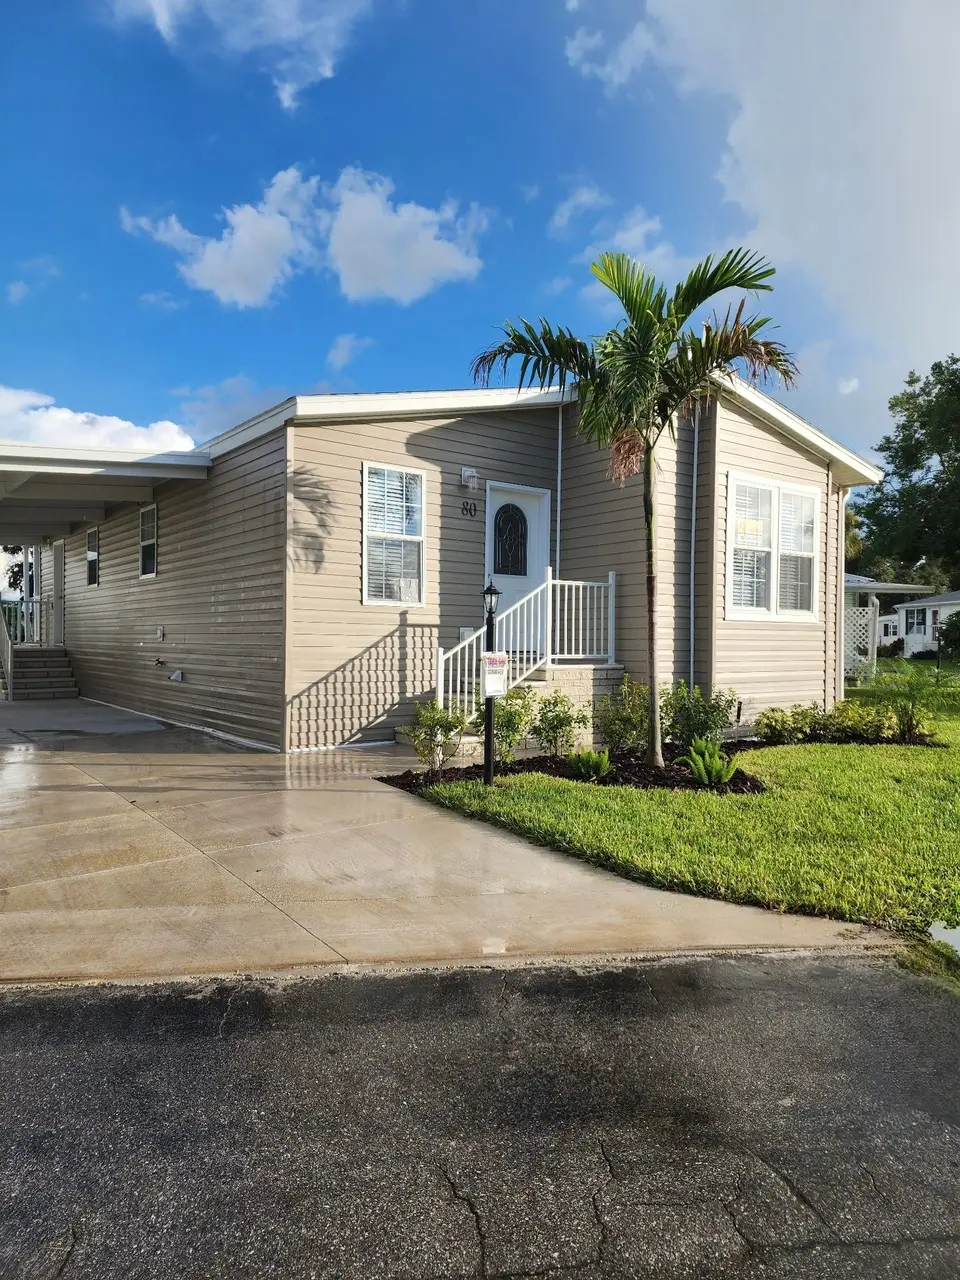
Be the first to snag this brand new 3-bedroom home, now under construction. Luxury vinyl flooring throughout and light taupe walls, the place is flooded with natural light thanks to energy-efficient windows, creating a bright and inviting space for your personal touch. The kitchen features sleek light gray laminate cabinetry and a center island with tons of storage, seamlessly connecting to the living and dining areas perfect for hosting your next dinner party. Plus, you'll have a carport and garden shed for added convenience. Nestled in our beautiful 55+ community, you're just a stone's throw away from all the amenities. You'll love living just minutes away from the best beaches, dining an
Key facts
- Minutes from tampa
- Carport
- Garden shed
Tags
Property features AI
Finance
- Financial info: List price: $157,995
Exterior
- Home design: Single-family plan: 66047 EATON RD.; Active listing
Interior
- Bedrooms: 3 bedrooms
- Bathrooms: 2 full bathrooms
- Interior features: Living area of 1,456 (listed)
Neighborhood map
What this means for you Summary
Snapshot
- This is a 3-bed/2.0-bath manufactured listed at $158k. Condition is rated excellent.
Deal economics
- At list price, monthly cash flow is $637 ($8k/yr) — positive.
- The deal already cash-flows at list — no discount required.
- Meets the 1% rule at list price ($2k rent vs $158k).
- Recommended offer: $149k (6.0% below list) — sets the bar for market timing.
- Cap rate 11.1% vs local median 4.0% in Pinellas Park — top-decile yield for the area; either an underpriced asset or a hidden risk that comps aren't pricing in. Stress-test before assuming the spread holds.
Location & tenants
- Location reads 78/100 on livability (#170 in FL, #2,546 nationally) — a middle-class / working-renter tenant base. Strengths: commute A+, cost of living A+, housing A+; Watch: employment D+, amenities F.
- Pinellas (suburban): math 51% / reading 51% proficiency, ranked #31 of 73 in FL (top 42%) — acceptable for families but not a draw, mixed tenant base, ~2y average lease.
- Zoned schools: Cross Bayou Elementary School (math 42% / reading 32%, grade F, #1,609 of 2,144 statewide, top 77%, 356 students, 64% FRL); Fitzgerald Middle School (math 50% / reading 47%, grade C-, #274 of 571 statewide, top 50%, 1,033 students, 62% FRL); Pinellas Park High School (math 28% / reading 35%, grade F, #424 of 667 statewide, top 64%, 1,919 students, 57% FRL).
- Zoned-school proficiency averages 39% at this address vs 51% district-wide (-12 pts) — the specific schools serving this property underperform the Pinellas average; the district grade overstates school quality for this exact location.
- Market conditions: Rents falling (-5.3%/yr); 203 active listings in the ZIP; 18 comparable units currently listed for rent nearby; rentals leasing fast (median 12d on market — plan ~1-2 weeks tenant-placement turnaround); 2,676 units permitted in Pinellas County in 2024 (1,422 in 5+ unit buildings).
- This rent runs 40% of the median local income ($66k/yr) — at the standard rent-burdened threshold; future hikes will face affordability resistance.
Forward outlook
- Local home prices are declining (-3.0%/yr); year-one equity from $1k of loan paydown is wiped out by about $5k of value loss. Plan a longer hold.
- Pinellas County population projected at +14% by 2050 — modest demand growth; plan on rents tracking national, not racing it.
- At projected returns (-3.0% appreciation + 0.0% rent growth), your $44k cash investment doubles in ~10 years — after that, you're playing with house money.
Negotiation context
- It's been on market 89 days — a 6% lower offer ($149k) is reasonable based on typical stale-listing flexibility.
Questions for the listing agent
- It's been on market 89 days. Have you received any prior offers? Is the seller open to a 6% concession, seller financing, or rate buy-down credit?
- Why hasn't it sold? Are there any deal-killer items the seller is aware of (foundation, flood, title, zoning, code violations)?
- Is there a deadline driving the sale (1031 exchange, divorce, estate, relocation)? That informs how much negotiation room exists.
- Schools are D-rated, which usually means shorter tenancies and higher turnover. Who's the typical renter profile here, and what's been the actual vacancy rate?
- What's the average days-on-market for RENTAL listings here right now (not sales)? A rising rental-DOM trend means longer vacancies and softer asking-rent achievability than the comps imply.
- What's the recent tenant-quality profile in this submarket — average credit score on applications, eviction rate, late-payment / NSF rate, and stable-employment percentage? A property-management company in the area should have these aggregated.
- How much new for-sale + rental construction is in the pipeline within 1–3 miles? Heavy new supply typically softens prices + rents 12–24 months out; constrained supply supports both.
Investment metrics
- 1% rule
- 1.39% ✓
- Cap rate
- 11.13%
- Cash-on-cash
- 17.28%
- DSCR
- 1.77
- GRM
- 6.0
CMA / ARV
- ARV (on-the-fly)
- $221,312
- Comps found
- 8
Show comp detail 8 sales within ~0.75 mi
| Address | Dist | Beds/Ba | Sqft | Sold | Price | $/sf | Match |
|---|---|---|---|---|---|---|---|
| 6099 107th Ave N | 0.58mi | 3/2.0 | 1,344 (-8%) | 2mo | $162,000 | $121 | 58 |
| 9790 66th St N #391 | 0.73mi | 3/2.0 | 1,404 (-4%) | 7mo | $213,805 | $152 | 54 |
| 6151 109th Ave N | 0.51mi | 3/2.0 | 1,620 (+11%) | 5mo | $236,000 | $146 | 53 |
| 6036 110th Ave N | 0.68mi | 3/2.0 | 1,512 (+4%) | 11mo | $240,000 | $159 | 53 |
| 9790 66th St N #89 | 0.73mi | 3/2.0 | 1,512 (+4%) | 11mo | $200,000 | $132 | 50 |
| 6051 106th Ave N | 0.63mi | 3/2.0 | 1,296 (-11%) | 9mo | $199,900 | $154 | 45 |
| 6144 103rd Ave N | 0.56mi | 3/2.0 | 1,296 (-11%) | 21mo | $200,000 | $154 | 38 |
| 9790 66th St N #235 | 0.73mi | 3/1.5 | 1,254 (-14%) | 14mo | $105,000 | $84 | 30 |
Match score weights: distance 35% · size 25% · config 20% · recency 20%. Top-matched comps best support the ARV.
Projected returns pro-forma
-3.0% appreciation · 0.0% rent growth · sell at horizon
- IRR
- 5.2%
- Equity multiple
- 1.19×
- Total profit
- $8,588
- Equity at exit
- $23,558
- IRR
- 11.7%
- Equity multiple
- 1.79×
- Total profit
- $35,068
- Equity at exit
- $13,661
Cash invested: $44,239 (down + closing). Projections, not guarantees.
Landlord ↔ Tenant lean methodology
- Overall (STATE)
- 87 Strongly Landlord-Friendly
- State Florida
- 87 Strongly Landlord-Friendly · R+3
- County
- — inherits STATE
- City
- — inherits STATE
ZIP-level market 33782
- Rents YoY
- -5.3%
- Active inventory
- 203
- Price-to-rent
- 6.0×
Monthly cashflow live
- Estimated rent
- $2,188 high interval (Pro) →
- Mortgage (P&I)
- −$829
- Tax est. 1.5%
- −$197 /mo · $2,370/yr
- Insurance
- −$66
- HOA
- −$0
- Vacancy / Maint / Mgmt
- −$460
- Net cashflow
- $637
Break-even live
Sensitivity live
| Price | -10% $746 | -5% $692 | +0% $637 | +5% $582 | +10% $528 |
|---|---|---|---|---|---|
| Rent | -10% $464 | -5% $551 | +0% $637 | +5% $723 | +10% $810 |
| Rate | -1.0pp $717 | -0.5pp $677 | base $637 | +0.5pp $596 | +1.0pp $554 |
UW: 25.0% down · 7.5% · 30yr · 1.5% tax · 5.0% vac · 8.0% maint · 8.0% mgmt
Financing live
Cash to close
- Down payment
- $39,499
- Closing costs
- $4,740
- Reserves months
- —
- Total cash needed
- —
Loan-product check · same deal, 3 products live
Conventional
25% down · 7.5% · 30yr
- Down + closing
- —
- Monthly P&I
- —
- Monthly cashflow
- —
- DSCR
- —
- Eligible?
- —
Personal DTI + credit; lowest rate.
DSCR
20% down · 8.5% · 30yr
- Down + closing
- —
- Monthly P&I
- —
- Monthly cashflow
- —
- DSCR
- —
- Eligible?
- —
No personal income docs; deal must DSCR.
Hard money
10% down · 12.0% · 12mo
- Down + closing
- —
- Monthly P&I
- —
- Monthly cashflow
- —
- DSCR
- —
- Eligible?
- —
Short-term bridge; refi at stabilization.
Rent comps 18 comps
| Address | Beds | Baths | Sqft | Rent | $/sqft | DOM | Units | Dist |
|---|---|---|---|---|---|---|---|---|
| 6132 100th Cir N Pinellas Park, FL | 3.0 | 1.0 | 901 | $1,995 | $2.21 | 25d | 1 | 0.70mi |
| 6388 93rd Ter Pinellas Park, FL | 2.0 | 2.0 | 1245 | $2,095 | $1.68 | 15d | 1 | 0.87mi |
| 6740 121st Ave #6 Largo, FL | 2.0 | 2.5 | 1118 | $1,735 | $1.55 | 25d | 1 | 0.87mi |
| 5501 110th Ave N Pinellas Park, FL | 1.0–3.0 | 1.0–2.0 | 1001 | $2,317 | $2.31 | 3d | 12 | 1.08mi |
| 5641 94th Ter N Pinellas Park, FL | 3.0 | 2.0 | 1066 | $2,200 | $2.06 | 9d | 1 | 1.24mi |
| 5865 92nd Ave N Pinellas Park, FL | 3.0 | 2.0 | 1062 | $2,400 | $2.26 | 19d | 1 | 1.25mi |
| 10770 US Highway 19 N #605 Pinellas Park, FL | 2.0 | 2.0 | 1000 | $1,800 | $1.80 | 25d | 1 | 1.26mi |
| 12700 66th St Largo, FL | 1.0–3.0 | 1.0–2.0 | 1105 | $2,680 | $2.43 | 3d | 20 | 1.35mi |
| 5691 92nd Ave N Pinellas Park, FL | 3.0 | 2.0 | 1152 | $2,300 | $2.00 | 5d | 1 | 1.37mi |
| 5358 97th Ter N Pinellas Park, FL | 3.0 | 2.0 | 1158 | $2,360 | $2.04 | 5d | 1 | 1.41mi |
| 12711 Pineforest Way E Largo, FL | 3.0 | 2.0 | 1496 | $1,890 | $1.26 | 12d | 1 | 1.42mi |
| 12711 Pineforest Way E Largo, FL | 3.0 | 2.0 | 1496 | $1,890 | $1.26 | 11d | 1 | 1.42mi |
| 6960 Versailles Unit 6960 Pinellas Park, FL | 2.0 | 2.0 | 1109 | $1,695 | $1.53 | 5d | 1 | 1.43mi |
| 7077 Versailles Unit 7077 Pinellas Park, FL | 2.0 | 2.0 | 1350 | $1,695 | $1.26 | 5d | 1 | 1.44mi |
| 8303 Bardmoor Blvd #105 Seminole, FL | 2.0 | 1.0 | 880 | $1,800 | $2.05 | 25d | 1 | 1.45mi |
| 8303 Bardmoor Blvd Seminole, FL | 2.0 | 1.0 | 880 | $1,850 | $2.10 | 13d | 1 | 1.47mi |
| 6622 83rd Ave N Pinellas Park, FL | 2.0 | 2.5 | 1730 | $2,500 | $1.45 | 3d | 1 | 1.49mi |
| 8330 63rd Way N Pinellas Park, FL | 4.0 | 2.0 | 1354 | $2,475 | $1.83 | 5d | 1 | 1.49mi |
Listing history 13 events
-
2026-06-22days on market $157,995 Active 89 DOM
-
2026-06-18days on market $157,995 Active 86 DOM
-
2026-06-17days on market $157,995 Active 85 DOM
-
2026-06-16days on market $157,995 Active 84 DOM
-
2026-06-15days on market $157,995 Active 83 DOM
-
2026-06-13days on market $157,995 Active 81 DOM
-
2026-06-09days on market $157,995 Active 77 DOM
-
2026-06-08days on market $157,995 Active 76 DOM
-
2026-06-07days on market $157,995 Active 75 DOM
-
2026-06-04days on market $157,995 Active 72 DOM
-
2026-06-03days on market $157,995 Active 71 DOM
-
2026-06-01days on market $157,995 Active 69 DOM
-
2026-05-31days on market $157,995 Active 68 DOM
ⓘ Source: listings_history table (triggers on properties + properties_extension) + one-shot
backfill from property_details.listing_events for pre-trigger history.
Nearby sold comps map
Loading sold comps map…
Walkable amenities ~0.75 mi
Loading nearby amenities…
Taxation est. · year 1
- Rental income
- $26,261
- − Mortgage interest
- −$8,850
- − Property taxes
- −$2,370
- − Insurance
- −$790
- − Repairs & maintenance
- −$2,101
- − Management
- −$2,101
- − Depreciation
- −$4,596
- Taxable income
- $5,453
- Est. tax owed @ 24.0%
- −$1,309
- After-tax cash flow
- $6,335/yr
For passive investors: Depreciation is non-cash, so a rental often shows a tax loss while cash-flowing — sheltering income. Rental losses are passive: they offset passive income freely, and up to $25,000/yr can offset ordinary (W-2) income if you actively participate and your MAGI is under $100k (phasing out to $0 by $150k); unused losses carry forward. On sale, claimed depreciation is recaptured at up to 25%, and gains may owe capital-gains tax (a 1031 exchange can defer both). Figures are a year-1 estimate at your 24.0% rate — not tax advice; consult a CPA.
Condition & rehab AI · 11 photos
This brand new 3-bedroom manufactured home is move-in ready with excellent condition and no visible repairs needed. It offers luxury vinyl flooring, energy-efficient windows, and a well-maintained exterior. Consider landscaping and smart home features to further enhance its value.
Value-add opportunities
- Both Landscaping and curb appeal improvements — Enhances curb appeal and adds value
- Both Add a small outdoor seating area — Improves functionality and adds value
- Both Install smart home features — Enhances convenience and adds value
Renovation cost estimate screening
Value-add ROI direction
- Both Landscaping and curb appeal improvements — Enhances curb appeal and adds value ↑
- Both Add a small outdoor seating area — Improves functionality and adds value ↑
- Both Install smart home features — Enhances convenience and adds value ↑
ⓘ Cost ranges are severity-bucket heuristics (US national rule-of-thumb). Get contractor quotes + a written scope before underwriting a rehab budget.
Schools (NCES district)
- District
- Pinellas
- NCES district ID
- 1201560
- Math proficiency
- 51% ▼ -5.00%
- Reading proficiency
- 51% ▼ -3.00%
- Median HH income
- $46,270
- Composite
- 43.27/100
- National rank
- #3046
- State rank
- #31 of 73 in FL
Livability — Pinellas Park
- Score
- 78/100
- State rank
- #170
- US rank
- #2546
Category grades
Schools grade is shown separately in the Schools card above.
Census & demographics
- Census place
- Pinellas Park, FL
- County
- Pinellas County · 939,478 people
- City population
- 50,533
- Metro
- Tampa-St. Petersburg-Clearwater, FL
- Population (ZIP)
- 22,461
- Household income
- $66,461
- Rent vs Own
- Severe rent burden
- 486.0
Population outlook (Pinellas County) Hauer SSP2
- Today (2025)
- 1,027,532 people
- By 2030
- 1,063,586 · +3.5%
- By 2040
- 1,125,020 · +9.5%
- By 2050
- 1,168,637 · +13.7%
- By 2075
- 1,265,188 · +23.1%
- By 2100
- 1,260,357 · +22.7%
Race, ethnicity, and origin ACS 2023
- Neighborhood character
- Predominantly White (68%)
- Race & ethnicity
- White 68% Hispanic / Latino 12% Asian 12% Two or more races 8% Black 5%
- Hispanic origin (detail)
- Mexican 3% Puerto Rican 2% Cuban 2%
- Common ancestry
- Lithuanian 3% Italian 3% Romanian 2%
- Foreign-born
- 17% · Canada, Vietnam, China
- Languages at home
- 78% English-only · Spanish 9% Vietnamese 7% Other Indo-European 2%
Political lean MEDSL · Pinellas
- 2024 margin
- Lean R (+5.2) · D 46.9% · R 52.1%
- 2008→2024 swing
- -13.5pp toward R · 2008: 8.3pp · 2024: -5.2pp
- All cycles
- 2024: R+5.2 2020: D+0.2 2016: R+1.1 2012: D+5.6 2008: D+8.3
Not yet ingested
- Civics
- —
Market trends
- HPI YoY
- ▼ -250.17%
- Current HPI
- 314.1689
- Rent YoY
- ▼ -5.28%
- Metro
- Tampa-St. Petersburg-Clearwater, FL
- State GDP YoY
- ▲ 3.28%
- F500 in state
- 36
Industry mix (Fortune 500 HQ in FL)
| Industry | F500 HQs | Revenue |
|---|---|---|
| Industrial Technology | 2 | $29B |
|
||
| Insurance | 2 | $17B |
|
||
| Retail | 1 | $60B |
|
||
| Technology Distribution | 1 | $58B |
|
||
| Homebuilding | 1 | $35B |
|
||
| Technology Manufacturing | 1 | $35B |
|
||
Cash-flow waterfall
monthlySold comps — $/sqft
last 12 mo · ≤1 miLoading sold comps…