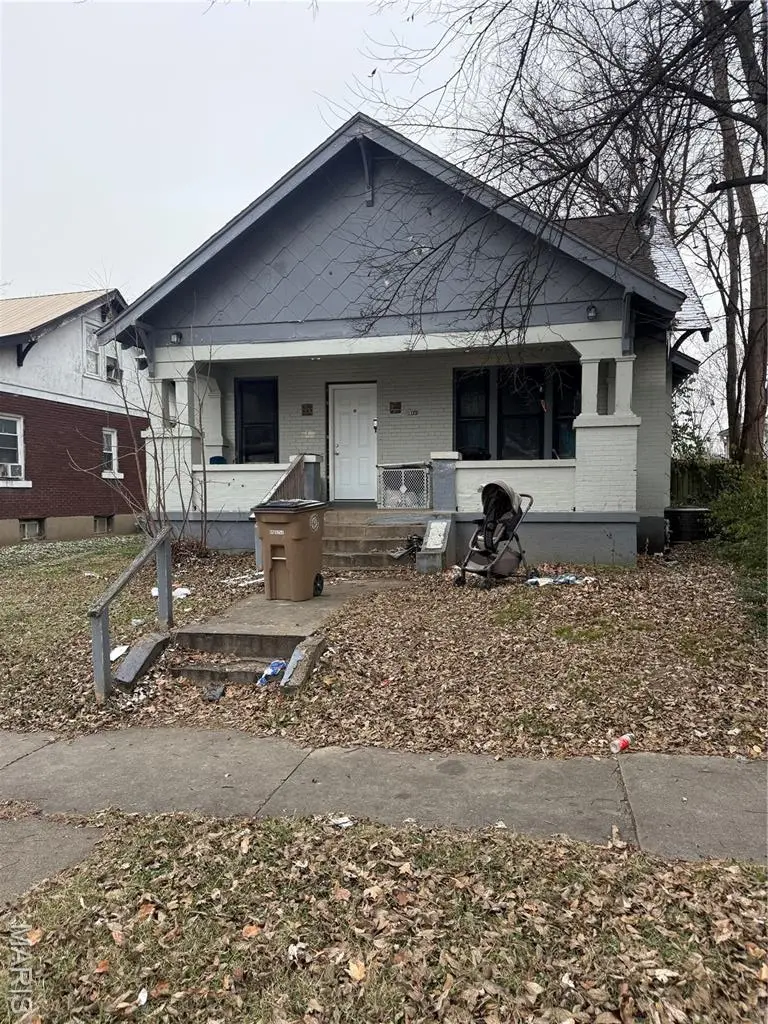
303 S Hanover St · Cape Girardeau, MO
Flood risk 1/10 · Minimal
- FEMA flood zone
- X (unshaded)
- Chance of flooding over 30 yrs
- 0.0%
- Est. flood insurance / yr
- $473 – $860
Fire risk 1/10 · Minimal
- Est. fire insurance / yr
- $1,054 – $1,958
Heat risk 5/10 · Moderate
- Hot days now (above 108°F)
- 7 days/yr
- Hot days in 30 yrs
- 21 days/yr
Wind risk 2/10 · Minimal
- Chance of severe wind over 30 yrs
- 3.0%
Air-quality risk 2/10 · Minimal
- Unhealthy air days now
- 0 days/yr
- Unhealthy air days in 30 yrs
- 2 days/yr
Risk factors via First Street. Map © Google.
Why this score? — see what drove the C grade
The composite is a weighted blend of 9 inputs, each scored 0–100. Each bar is that input's sub-score; the figure is the points it added to the 100-point composite (weight × sub-score).
- Cash flow +25.2/30.0
- DSCR +8.3/10.0
- ARV discount +7.5/15.0
- 1% rule +5.4/10.0
- Livability +3.2/5.0
- Schools +3.1/10.0
- Rent growth +2.5/5.0
- Condition / age +2.5/5.0
- Appreciation +0.0/10.0
$114,900
🖨 Deal sheet 📄 Offer letter ✓ Due diligence
Listing remarks MLS
Home is listed $10,000 under appraisal! Home is HUGE! Large living area, large kitchen space and spacious bedrooms! This would be a great investment opportunity (as it's currently leased at $1350) OR would make an excellent home for any buyers! Recent remodel added two bedrooms upstairs and an additional bathroom- making this a 5 bedroom, 2 bathroom home! This home is listed with a package and can be purchased together or individually.
Key facts
- 4,573 sq ft lot
- Built 1940
- Listed 144 days
Neighborhood map
What this means for you Summary
Snapshot
- This is a 3-bed/1.0-bath single-family listed at $115k.
Deal economics
- At list price, monthly cash flow is $257 ($3k/yr) — positive.
- The deal already cash-flows at list — no discount required.
- Meets the 1% rule at list price ($1k rent vs $115k).
- Recommended offer: $101k (12.0% below list) — sets the bar for market timing.
- Cap rate 9.0% vs local median 3.9% in Cape Girardeau — top-decile yield for the area; either an underpriced asset or a hidden risk that comps aren't pricing in. Stress-test before assuming the spread holds.
Location & tenants
- Location reads 64/100 on livability (#297 in MO) — a middle-class / working-renter tenant base. Strengths: cost of living A+, housing A+; Watch: schools C-, employment D+, crime F.
- Cape Girardeau 63 (urban): math 33% / reading 42% proficiency, ranked #188 of 324 in MO (top 58%) — families likely to look elsewhere, expect single-tenant / working-renter base with shorter leases; 60% free/reduced lunch — lower-income household profile, screen leases tightly.
- Market conditions: 41 active listings in the ZIP; 1 comparable units currently listed for rent nearby; lower-income renter base — watch delinquency; 81 units permitted in Cape Girardeau County in 2024 (0 in 5+ unit buildings).
- This rent runs 37% of the median local income ($39k/yr) — at the standard rent-burdened threshold; future hikes will face affordability resistance.
Forward outlook
- Local home prices are declining (-3.0%/yr); year-one equity from $794 of loan paydown is wiped out by about $3k of value loss. Plan a longer hold.
- Cape Girardeau County population projected at +17% by 2050 — long-run rental-demand tailwind backs the buy-and-hold thesis.
Negotiation context
- It's been on market 144 days — a 12% lower offer ($101k) is reasonable based on typical stale-listing flexibility.
- 4 sale attempts since 7y ago with the ask held roughly flat each time — persistent listings suggest the price (not the market) is what's stuck; bring a comps-based counter.
Risks & watch-outs
- Watch-outs: built in 1940 — expect roof / HVAC / electrical / plumbing capex.
- Climate carrying-cost: extreme-heat days projected 7→21/yr by 2055 (HVAC capex compounding) — expect insurance premiums to compound above CPI over the hold.
Questions for the listing agent
- It's been on market 144 days. Have you received any prior offers? Is the seller open to a 12% concession, seller financing, or rate buy-down credit?
- Built in 1940 — when were the roof, HVAC, electrical panel, plumbing, and water heater last replaced?
- Why hasn't it sold? Are there any deal-killer items the seller is aware of (foundation, flood, title, zoning, code violations)?
- Is there a deadline driving the sale (1031 exchange, divorce, estate, relocation)? That informs how much negotiation room exists.
- Crime grade is F in this area — have there been break-ins, vandalism, or insurance claims at this property in the last 3 years? What carrier currently insures it and at what premium?
- What's the average days-on-market for RENTAL listings here right now (not sales)? A rising rental-DOM trend means longer vacancies and softer asking-rent achievability than the comps imply.
- What's the recent tenant-quality profile in this submarket — average credit score on applications, eviction rate, late-payment / NSF rate, and stable-employment percentage? A property-management company in the area should have these aggregated.
- How much new for-sale + rental construction is in the pipeline within 1–3 miles? Heavy new supply typically softens prices + rents 12–24 months out; constrained supply supports both.
Investment metrics
- 1% rule
- 1.04% ✓
- Cap rate
- 8.98%
- Cash-on-cash
- 9.60%
- DSCR
- 1.43
- GRM
- 8.0
CMA / ARV
- ARV (median comp)
- $74,143
- List price
- $114,900
- Delta
- 54.97%
- Verdict
- OVERPRICED
- Comps
- 20 within 1.0 mi
Show comp detail 12 sales within ~0.75 mi
| Address | Dist | Beds/Ba | Sqft | Sold | Price | $/sf | Match |
|---|---|---|---|---|---|---|---|
| 803 William St | 0.24mi | 3/1.0 | 1,680 (-6%) | 6mo | $84,900 | $51 | 74 |
| 1601 Bloomfield St | 0.35mi | 3/2.0 | 1,692 (-5%) | 3mo | $99,900 | $59 | 68 |
| 1013 William St | 0.10mi | 4/2.0 (+1) | 1,530 (-14%) | 5mo | $68,900 | $45 | 58 |
| 1609 Themis St | 0.64mi | 3/2.0 | 1,694 (-5%) | 1mo | $229,900 | $136 | 56 |
| 1803 Montgomery St | 0.64mi | 2/1.0 (-1) | 1,706 (-5%) | 5mo | $140,000 | $82 | 53 |
| 29 N Henderson Ave | 0.39mi | 3/1.5 | 1,576 (-12%) | 9mo | $179,000 | $114 | 53 |
| 222 Good Hope St | 0.69mi | 3/2.0 | 1,692 (-5%) | 4mo | $275,000 | $163 | 51 |
| 605 Albert St | 0.72mi | 2/2.0 (-1) | 1,740 (-3%) | 6mo | $159,000 | $91 | 48 |
| 1716 Whitener St | 0.73mi | 3/2.0 | 1,620 (-9%) | 4mo | $225,000 | $139 | 43 |
| 1455 Whitener St | 0.49mi | 2/2.0 (-1) | 2,026 (+13%) | 6mo | $127,000 | $63 | 41 |
| 1827 William St | 0.58mi | 4/1.5 (+1) | 2,056 (+15%) | 2mo | $174,000 | $85 | 40 |
| 1903 Brink Ave | 0.74mi | 3/2.0 | 1,984 (+11%) | 8mo | $150,000 | $76 | 37 |
Match score weights: distance 35% · size 25% · config 20% · recency 20%. Top-matched comps best support the ARV.
Projected returns pro-forma
-3.0% appreciation · 3.0% rent growth · sell at horizon
- IRR
- -1.9%
- Equity multiple
- 0.93×
- Total profit
- $-2,280
- Equity at exit
- $17,132
- IRR
- 7.8%
- Equity multiple
- 1.59×
- Total profit
- $18,921
- Equity at exit
- $9,934
Cash invested: $32,172 (down + closing). Projections, not guarantees.
Landlord ↔ Tenant lean methodology
- Overall (STATE)
- 81 Strongly Landlord-Friendly
- State Missouri
- 81 Strongly Landlord-Friendly · R+10
- County
- — inherits STATE
- City
- — inherits STATE
ZIP-level market 63703
- Home prices YoY
- -29.3%
- Active inventory
- 41
- Price-to-rent
- 8.0×
Monthly cashflow live
- Estimated rent
- $1,196 medium interval (Pro) →
- Mortgage (P&I)
- −$603
- Tax from tax record
- −$37 /mo · $442/yr
- Insurance
- −$48
- HOA
- −$0
- Vacancy / Maint / Mgmt
- −$251
- Net cashflow
- $257
Break-even live
UW: 25.0% down · 7.5% · 30yr · 1.5% tax · 5.0% vac · 8.0% maint · 8.0% mgmt
Financing live
Cash to close
- Down payment
- $28,725
- Closing costs
- $3,447
- Reserves months
- —
- Total cash needed
- —
Loan-product check · same deal, 3 products live
Conventional
25% down · 7.5% · 30yr
- Down + closing
- —
- Monthly P&I
- —
- Monthly cashflow
- —
- DSCR
- —
- Eligible?
- —
Personal DTI + credit; lowest rate.
DSCR
20% down · 8.5% · 30yr
- Down + closing
- —
- Monthly P&I
- —
- Monthly cashflow
- —
- DSCR
- —
- Eligible?
- —
No personal income docs; deal must DSCR.
Hard money
10% down · 12.0% · 12mo
- Down + closing
- —
- Monthly P&I
- —
- Monthly cashflow
- —
- DSCR
- —
- Eligible?
- —
Short-term bridge; refi at stabilization.
Rent comps 1 comps
| Address | Beds | Baths | Sqft | Rent | $/sqft | DOM | Units | Dist |
|---|---|---|---|---|---|---|---|---|
| Cape Girardeau Cape Girardeau, MO | 1.0–3.0 | 1.0–2.0 | 931 | $1,000 | $1.07 | 43d | 7 | 0.96mi |
Listing history 13 events
-
2026-05-31days on market $114,900 Active 144 DOM
-
2026-05-30days on market $114,900 Active 143 DOM
-
2026-01-07$114,900 Active 445-char remark
Show marketing remark (445 chars)
Home is listed $10,000 under appraisal! Home is HUGE! Large living area, large kitchen space and spacious bedrooms! This would be a great investment opportunity (as it's currently leased at $1350) OR would make an excellent home for any buyers! Recent remodel added two bedrooms upstairs and an additional bathroom- making this a 5 bedroom, 2 bathroom home! This home is listed with a package and can be purchased together or individually.
-
2026-01-07historical $114,900 445-char remark
Show marketing remark (445 chars)
Home is listed $10,000 under appraisal! Home is HUGE! Large living area, large kitchen space and spacious bedrooms! This would be a great investment opportunity (as it's currently leased at $1350) OR would make an excellent home for any buyers! Recent remodel added two bedrooms upstairs and an additional bathroom- making this a 5 bedroom, 2 bathroom home! This home is listed with a package and can be purchased together or individually.
-
2024-05-02historical
-
2023-09-27$135,000 Active
-
2022-12-28soldstatus
-
2022-12-22soldstatus Closed
-
2022-11-14status Pending
-
2022-09-15$59,900 Active
-
2019-07-31$38,000
-
2019-07-29soldstatus Closed
-
2005-03-17soldstatus
ⓘ Source: listings_history table (triggers on properties + properties_extension) + one-shot
backfill from property_details.listing_events for pre-trigger history.
Tax reassessment forecast MO · Resets to sale price
- Current annual tax
- $442 · $37/mo
- Projected year-2 tax
- $1,115 · $93/mo
- Expected delta
- +$672/yr (+$56/mo · 151.9%)
ⓘ Screening estimate from a state-policy table — verify with the county assessor before closing.
Climate risk First Street
- Flood 1/10 Low FEMA zone X (unshaded) · 0% chance over 30 yrs
- Wildfire 1/10 Low
- Heat 5/10 Major 7 d/yr ≥108°F today · 21 d/yr by 30 yrs out
- Wind 2/10 Low 3% chance of damaging wind over 30 yrs
- Air quality 2/10 Low 0 unhealthy d/yr today · 2 by 30 yrs out
Nearby sold comps map
Loading sold comps map…
Walkable amenities ~0.75 mi
Loading nearby amenities…
Taxation est. · year 1
- Rental income
- $14,348
- − Mortgage interest
- −$6,436
- − Property taxes
- −$442
- − Insurance
- −$574
- − Repairs & maintenance
- −$1,148
- − Management
- −$1,148
- − Depreciation
- −$3,343
- Taxable income
- $1,257
- Est. tax owed @ 24.0%
- −$302
- After-tax cash flow
- $2,786/yr
For passive investors: Depreciation is non-cash, so a rental often shows a tax loss while cash-flowing — sheltering income. Rental losses are passive: they offset passive income freely, and up to $25,000/yr can offset ordinary (W-2) income if you actively participate and your MAGI is under $100k (phasing out to $0 by $150k); unused losses carry forward. On sale, claimed depreciation is recaptured at up to 25%, and gains may owe capital-gains tax (a 1031 exchange can defer both). Figures are a year-1 estimate at your 24.0% rate — not tax advice; consult a CPA.
Schools (NCES district)
- District
- Cape Girardeau 63
- NCES district ID
- 2907120
- Math proficiency
- 33% ▼ -6.00%
- Reading proficiency
- 42% ▼ -7.00%
- Median HH income
- $40,543
- Composite
- 31.49/100
- National rank
- #5974
- State rank
- #188 of 324 in MO
Livability — Cape Girardeau
- Score
- 64/100
- State rank
- #297
- US rank
- #13759
Category grades
Schools grade is shown separately in the Schools card above.
Census & demographics
- Census place
- Cape Girardeau, MO
- County
- Cape Girardeau County · 75,175 people
- City population
- 47,546
- Metro
- Cape Girardeau, MO-IL
- Population (ZIP)
- 8,201
- Household income
- $38,695
- Rent vs Own
- Severe rent burden
- 617.0
Population outlook (Cape Girardeau County) Hauer SSP2
- Today (2025)
- 84,807 people
- By 2030
- 88,016 · +3.8%
- By 2040
- 93,914 · +10.7%
- By 2050
- 99,541 · +17.4%
- By 2075
- 114,527 · +35.0%
- By 2100
- 121,718 · +43.5%
Race, ethnicity, and origin ACS 2023
- Neighborhood character
- Predominantly White (69%)
- Race & ethnicity
- White 69% Black 19% Two or more races 5% Hispanic / Latino 5%
- Hispanic origin (detail)
- Mexican 4% Puerto Rican 1%
- Common ancestry
- Slovak 2% Lithuanian 2% Italian 2%
- Foreign-born
- 4% · Canada, Jamaica
- Languages at home
- 94% English-only · Spanish 3% Russian/Polish/Slavic 1% Other Indo-European 1%
Political lean MEDSL · Cape Girardeau
- 2024 margin
- Solid R (+46.5) · D 26.2% · R 72.7% · Other 1.1%
- 2008→2024 swing
- -12.9pp toward R · 2008: -33.6pp · 2024: -46.5pp
- All cycles
- 2024: R+46.5 2020: R+45.0 2016: R+50.1 2012: R+43.8 2008: R+33.6
Not yet ingested
- Civics
- —
Market trends
- HPI YoY
- ▼ -63.10%
- Current HPI
- 152.013
- Rent YoY
- —
- Metro
- Cape Girardeau, MO-IL
- State GDP YoY
- ▲ 1.84%
- F500 in state
- 20
Industry mix (Fortune 500 HQ in MO)
| Industry | F500 HQs | Revenue |
|---|---|---|
| Healthcare | 1 | $163B |
|
||
| Insurance | 1 | $21B |
|
||
| Industrial Technology | 1 | $17B |
|
||
| Retail | 1 | $16B |
|
||
| Industrial Distribution | 1 | $10B |
|
||
| Utilities | 1 | $9B |
|
||
Price history
+202.4% since first listed11 events — show timeline
- 2026-01-07 Listed $114,900 MARIS as Distributed by MLS Grid
- 2026-01-07 Coming Soon $114,900 MARIS as Distributed by MLS Grid
- 2024-05-02 Delisted — MARIS as Distributed by MLS Grid
- 2023-09-27 Listed $135,000 MARIS as Distributed by MLS Grid
- 2022-12-28 Sold (Public Records) — Public Records
- 2022-12-22 Sold (MLS) — MARIS as Distributed by MLS Grid
- 2022-11-14 Pending — MARIS as Distributed by MLS Grid
- 2022-09-15 Listed $59,900 MARIS as Distributed by MLS Grid
- 2019-07-31 Listed $38,000 MARIS as Distributed by MLS Grid
- 2019-07-29 Sold (MLS) — MARIS as Distributed by MLS Grid
- 2005-03-17 Sold (Public Records) — Public Records
Property tax history
+1.2%/yrLatest (2025): $442 · +5.4% YoY. Source: county tax records.
Cash-flow waterfall
monthlySold comps — $/sqft
last 12 mo · ≤1 miLoading sold comps…