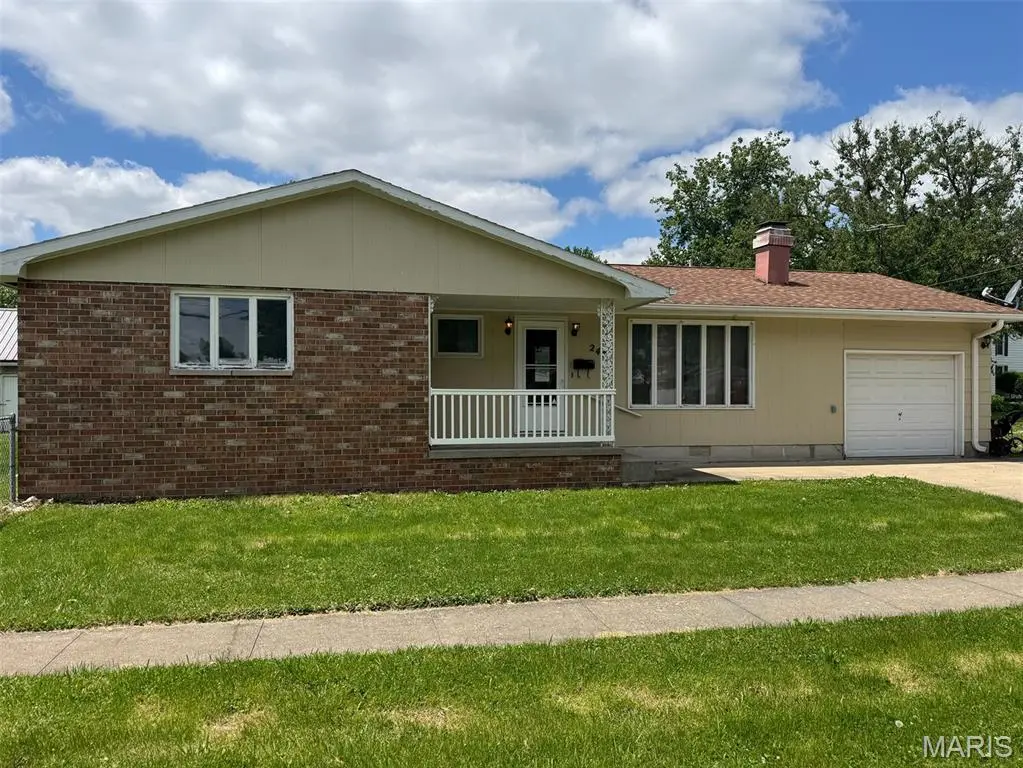
240 S Jefferson St · Kahoka, MO
Flood risk 1/10 · Minimal
- FEMA flood zone
- X (unshaded)
- Chance of flooding over 30 yrs
- 0.0%
- Est. flood insurance / yr
- $473 – $860
Fire risk 2/10 · Minimal
- Est. fire insurance / yr
- $1,054 – $1,958
Heat risk 3/10 · Minor
- Hot days now (above 106°F)
- 7 days/yr
- Hot days in 30 yrs
- 16 days/yr
Wind risk 2/10 · Minimal
- Chance of severe wind over 30 yrs
- 0.0%
Air-quality risk 2/10 · Minimal
- Unhealthy air days now
- 2 days/yr
- Unhealthy air days in 30 yrs
- 2 days/yr
Risk factors via First Street. Map © Google.
Why this score? — see what drove the C+ grade
The composite is a weighted blend of 9 inputs, each scored 0–100. Each bar is that input's sub-score; the figure is the points it added to the 100-point composite (weight × sub-score).
- Cash flow +18.2/30.0
- ARV discount +15.0/15.0
- Appreciation +7.6/10.0
- DSCR +5.7/10.0
- 1% rule +4.1/10.0
- Livability +3.3/5.0
- Schools +2.6/10.0
- Rent growth +2.5/5.0
- Condition / age +2.5/5.0
$125,000
🖨 Deal sheet (PDF) 📄 Offer letter ✓ Due diligence
Listing remarks
Welcome to this inviting 3-bedroom, 1.5-bathroom single-family residence that is conveniently located in Kahoka. Situated on a spacious corner lot, this property offers both privacy and room to spread out. Inside, you’ll find a thoughtfully designed layout with plenty of space for everyday living and entertaining. The attached garage provides convenience and protection from the elements, making daily routines a breeze. Step outside and discover a large, chain-linked fenced backyard—ideal for pets, play, or creating your own outdoor fun. The concrete patio offers the perfect setting for summer barbecues, relaxing evenings, or hosting of friends and family. With its generous lot s
Key facts
- Concrete patio
- Corner lot
- 0.32 acre lot
Tags
Property features AI
Finance
- Other: Equipment shed and outbuilding on the property
Exterior
- Parking: Attached garage (1 car) with garage door opener; Driveway with concrete surface; Garage faces front
- Utilities: Public water; Public sewer; Electricity connected (220 volts available); Natural gas connected
- Home design: Single-family residence; One level
- Construction: Brick construction
- Exterior features: Private yard; Front and back yard
Interior
- Bedrooms: Three bedrooms on the main level
- Bathrooms: One full bath and one half bath on the main level
- Heating & cooling: Natural gas heating; Central air conditioning
- Interior features: Fireplace in the family room (wood burning)
- Laundry & utility: Laundry available in multiple locations
Neighborhood map
What this means for you Summary
Snapshot
- This is a 3-bed/1.5-bath single-family listed at $125k.
Deal economics
- At list price, monthly cash flow is $112 ($1k/yr) — positive.
- The deal already cash-flows at list — no discount required.
- To meet the 1% rule (rent ≥ 1% of price), the offer needs to be $113k (9.3% below list).
- Recommended offer: $113k (9.3% below list) — sets the bar for 1% rule.
Location & tenants
- Location reads 66/100 on livability (#236 in MO) — a middle-class / working-renter tenant base. Strengths: cost of living A+, crime B+, housing B+; Watch: health & safety C-, employment D, amenities F.
- Clark County R-I (rural): math 29% / reading 32% proficiency, ranked #268 of 324 in MO (top 83%) — families likely to look elsewhere, expect single-tenant / working-renter base with shorter leases.
- Zoned schools: Black Hawk Elem. (math 32% / reading 27%, grade F, #813 of 1,115 statewide, top 75%, 365 students, 56% FRL); Clark Co. Middle (math 24% / reading 27%, grade F, #319 of 391 statewide, top 82%, 258 students, 53% FRL); Clark Co. High (math 27% / reading 42%, grade F, #321 of 521 statewide, top 67%, 308 students, 46% FRL).
- Market conditions: 9 active listings in the ZIP; 2 units permitted in Clark County in 2024 (0 in 5+ unit buildings).
Forward outlook
- In year one you build about $7k of equity ($864 loan paydown + $6k appreciation (5.2% local appreciation)).
- Clark County population projected at -26% by 2050 — secular population decline; favor cash flow + early exit over multi-decade hold.
- At projected returns (5.2% appreciation + 3.0% rent growth), your $35k cash investment doubles in ~4 years — after that, you're playing with house money.
- By year 5, paydown + projected appreciation supports a ~$32k cash-out refi (75% LTV) — recoverable capital for the next deal without selling this one.
Negotiation context
- Only 1 days on market — expect competitive offers; lowballing is unlikely to land.
Questions for the listing agent
- Built in 1973 — when were the roof, HVAC, electrical panel, plumbing, and water heater last replaced?
- Is there a deadline driving the sale (1031 exchange, divorce, estate, relocation)? That informs how much negotiation room exists.
- What's the average days-on-market for RENTAL listings here right now (not sales)? A rising rental-DOM trend means longer vacancies and softer asking-rent achievability than the comps imply.
- What's the recent tenant-quality profile in this submarket — average credit score on applications, eviction rate, late-payment / NSF rate, and stable-employment percentage? A property-management company in the area should have these aggregated.
- How much new for-sale + rental construction is in the pipeline within 1–3 miles? Heavy new supply typically softens prices + rents 12–24 months out; constrained supply supports both.
Investment metrics
- 1% rule
- 0.91% ✗
- Cap rate
- 7.37%
- Cash-on-cash
- 3.84%
- DSCR
- 1.17
- GRM
- 9.2
CMA / ARV
- ARV (on-the-fly)
- $153,600
- Comps found
- 3
Show comp detail 3 sales within ~0.75 mi
| Address | Dist | Beds/Ba | Sqft | Sold | Price | $/sf | Match |
|---|---|---|---|---|---|---|---|
| 404 W Thompson St | 0.04mi | 2/1.0 (-1) | 1,400 (-12%) | 1mo | $109,000 | $78 | 69 |
| 729 W Court St | 0.47mi | 3/2.0 | 1,400 (-12%) | 1mo | $169,900 | $121 | 54 |
| 269 Garfield St | 0.75mi | 3/1.5 | 1,650 (+3%) | 12mo | $159,000 | $96 | 50 |
Match score weights: distance 35% · size 25% · config 20% · recency 20%. Top-matched comps best support the ARV.
Projected returns pro-forma
5.17% appreciation · 3.0% rent growth · sell at horizon
- IRR
- 16.6%
- Equity multiple
- 2.06×
- Total profit
- $37,159
- Equity at exit
- $72,163
- IRR
- 16.8%
- Equity multiple
- 4.02×
- Total profit
- $105,555
- Equity at exit
- $125,655
Cash invested: $35,000 (down + closing). Projections, not guarantees.
Landlord ↔ Tenant lean methodology
- Overall (STATE)
- 81 Strongly Landlord-Friendly
- State Missouri
- 81 Strongly Landlord-Friendly · R+10
- County
- — inherits STATE
- City
- — inherits STATE
ZIP-level market 63445
- Home prices YoY
- 4.9%
- Active inventory
- 9
- Price-to-rent
- 9.2×
Monthly cashflow live
- Estimated rent
- $1,133 medium interval (Pro) →
- Mortgage (P&I)
- −$656
- Tax from tax record
- −$76 /mo · $908/yr
- Insurance
- −$52
- HOA
- −$0
- Vacancy / Maint / Mgmt
- −$238
- Net cashflow
- $112
Break-even live
Sensitivity live
| Price | -10% $183 | -5% $147 | +0% $112 | +5% $77 | +10% $41 |
|---|---|---|---|---|---|
| Rent | -10% $22 | -5% $67 | +0% $112 | +5% $157 | +10% $202 |
| Rate | -1.0pp $175 | -0.5pp $144 | base $112 | +0.5pp $80 | +1.0pp $47 |
UW: 25.0% down · 7.5% · 30yr · 1.5% tax · 5.0% vac · 8.0% maint · 8.0% mgmt
Financing live
Cash to close
- Down payment
- $31,250
- Closing costs
- $3,750
- Reserves months
- —
- Total cash needed
- —
Loan-product check · same deal, 3 products live
Conventional
25% down · 7.5% · 30yr
- Down + closing
- —
- Monthly P&I
- —
- Monthly cashflow
- —
- DSCR
- —
- Eligible?
- —
Personal DTI + credit; lowest rate.
DSCR
20% down · 8.5% · 30yr
- Down + closing
- —
- Monthly P&I
- —
- Monthly cashflow
- —
- DSCR
- —
- Eligible?
- —
No personal income docs; deal must DSCR.
Hard money
10% down · 12.0% · 12mo
- Down + closing
- —
- Monthly P&I
- —
- Monthly cashflow
- —
- DSCR
- —
- Eligible?
- —
Short-term bridge; refi at stabilization.
Listing history 3 events
-
2026-05-22status Pending
-
2026-05-21$125,000 Active
-
2025-03-06soldstatus
ⓘ Source: listings_history table (triggers on properties + properties_extension) + one-shot
backfill from property_details.listing_events for pre-trigger history.
Tax reassessment forecast MO · Resets to sale price
- Current annual tax
- $908 · $76/mo
- Projected year-2 tax
- $1,212 · $101/mo
- Expected delta
- +$305/yr (+$25/mo · 33.6%)
ⓘ Screening estimate from a state-policy table — verify with the county assessor before closing.
Climate risk First Street
- Flood 1/10 Low FEMA zone X (unshaded) · 0% chance over 30 yrs
- Wildfire 2/10 Low
- Heat 3/10 Moderate 7 d/yr ≥106°F today · 16 d/yr by 30 yrs out
- Wind 2/10 Low 0% chance of damaging wind over 30 yrs
- Air quality 2/10 Low 2 unhealthy d/yr today · 2 by 30 yrs out
Nearby sold comps map
Loading sold comps map…
Walkable amenities ~0.75 mi
Loading nearby amenities…
Taxation est. · year 1
- Rental income
- $13,599
- − Mortgage interest
- −$7,002
- − Property taxes
- −$908
- − Insurance
- −$625
- − Repairs & maintenance
- −$1,088
- − Management
- −$1,088
- − Depreciation
- −$3,636
- Taxable loss
- −$748
- Est. tax savings @ 24.0%
- +$180
- After-tax cash flow
- $1,524/yr
For passive investors: Depreciation is non-cash, so a rental often shows a tax loss while cash-flowing — sheltering income. Rental losses are passive: they offset passive income freely, and up to $25,000/yr can offset ordinary (W-2) income if you actively participate and your MAGI is under $100k (phasing out to $0 by $150k); unused losses carry forward. On sale, claimed depreciation is recaptured at up to 25%, and gains may owe capital-gains tax (a 1031 exchange can defer both). Figures are a year-1 estimate at your 24.0% rate — not tax advice; consult a CPA.
Schools (NCES district)
- District
- Clark County R-I
- NCES district ID
- 2916380
- Math proficiency
- 29% ▼ -8.00%
- Reading proficiency
- 32% ▼ -11.00%
- Median HH income
- $41,836
- Composite
- 25.83/100
- National rank
- #7355
- State rank
- #268 of 324 in MO
Livability — Kahoka
- Score
- 66/100
- State rank
- #236
- US rank
- #11503
Category grades
Schools grade is shown separately in the Schools card above.
Census & demographics
- Census place
- Kahoka, MO
- Population (ZIP)
- 3,945
Population outlook (Clark County) Hauer SSP2
- Today (2025)
- 6,211 people
- By 2030
- 5,858 · -5.7%
- By 2040
- 5,211 · -16.1%
- By 2050
- 4,620 · -25.6%
- By 2075
- 3,595 · -42.1%
- By 2100
- 2,927 · -52.9%
Race, ethnicity, and origin ACS 2023
- Neighborhood character
- Predominantly White (97%)
- Race & ethnicity
- White 97% Two or more races 2%
- Common ancestry
- Iranian 3% Lithuanian 2% Portuguese 2%
- Foreign-born
- 0%
Political lean MEDSL · Clark
- 2024 margin
- Solid R (+61.5) · D 18.8% · R 80.4%
- 2008→2024 swing
- -55.5pp toward R · 2008: -6.1pp · 2024: -61.5pp
- All cycles
- 2024: R+61.5 2020: R+58.8 2016: R+52.3 2012: R+10.3 2008: R+6.1
Not yet ingested
- Civics
- —
Market trends
- HPI YoY
- ▲ 5.17%
- Current HPI
- 111.3571
- Rent YoY
- —
- Metro
- —
- State GDP YoY
- ▲ 1.84%
- F500 in state
- 20
Industry mix (Fortune 500 HQ in MO)
| Industry | F500 HQs | Revenue |
|---|---|---|
| Healthcare | 1 | $163B |
|
||
| Insurance | 1 | $21B |
|
||
| Industrial Technology | 1 | $17B |
|
||
| Retail | 1 | $16B |
|
||
| Industrial Distribution | 1 | $10B |
|
||
| Utilities | 1 | $9B |
|
||
Price history
3 events — show timeline
- 2026-05-22 Pending — MARIS as Distributed by MLS Grid
- 2026-05-21 Listed $125,000 MARIS as Distributed by MLS Grid
- 2025-03-06 Sold (Public Records) — Public Records
Property tax history
+1.8%/yrLatest (2025): $908 · +15.2% YoY. Source: county tax records.
Cash-flow waterfall
monthlySold comps — $/sqft
last 12 mo · ≤1 miLoading sold comps…