1909 Ala Wai Blvd #1206 · Urban Honolulu, HI
Flood risk 8/10 · Major
- FEMA flood zone
- AO
- Chance of flooding over 30 yrs
- 0.99%
- Est. flood insurance / yr
- $848 – $2,087
Fire risk No data
- Est. fire insurance / yr
- —
Heat risk No data
- Hot days now (above threshold)
- —
- Hot days in 30 yrs
- —
Wind risk No data
- Chance of severe wind over 30 yrs
- —
Air-quality risk 1/10 · Minimal
- Unhealthy air days now
- —
- Unhealthy air days in 30 yrs
- —
Risk factors via First Street. Map © Google.
Why this score? — see what drove the D+ grade
The composite is a weighted blend of 9 inputs, each scored 0–100. Each bar is that input's sub-score; the figure is the points it added to the 100-point composite (weight × sub-score).
- Cash flow +10.5/30.0
- ARV discount +7.5/15.0
- Appreciation +6.4/10.0
- 1% rule +5.0/10.0
- Rent growth +4.0/5.0
- Schools +3.7/10.0
- DSCR +3.0/10.0
- Livability +2.5/5.0
- Condition / age +2.5/5.0
$315,000
🖨 Deal sheet (PDF) 📄 Offer letter ✓ Due diligence
Listing remarks
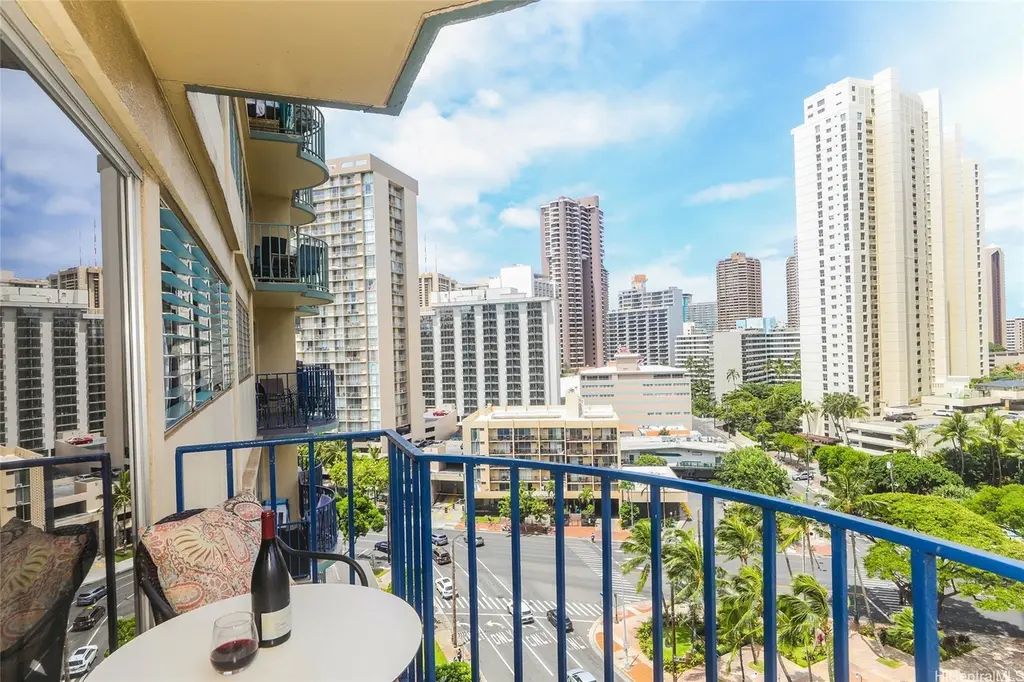
Imagine starting your mornings with a warm breeze and a cup of coffee on your private lanai, overlooking the sparkling Ala Wai Canal, the city skyline, and the lush green backdrop of the Koolau Mountains. Nestled in the heart of Waikiki, this beautifully updated 2-bedroom, 1-bath unit at the Royal Aloha offers more than just a home—it’s a lifestyle. Whether you're an investor looking for short-term rental potential, a frequent traveler craving a tropical retreat, or someone who dreams of the convenience and energy of Waikiki living, this property checks every box. Step inside to find granite kitchen countertops, sleek tile and laminate flooring, and an upgraded bathroom that add
Key facts
- Ala wai golf course
- Ala wai canal
- Waikiki beach
Tags
Property features AI
Finance
- Other: Lot area: 30,928
- Financial info: Leasehold land tenure (lease expires 2041-12-31); Monthly lease amount: $449; Annual taxes reported
- HOA & community: Association covers common areas, internet, sewer and water; Monthly maintenance expense: $777; Community amenities include deck/porch, patio, pool and laundry facilities
Exterior
- Utilities: Water and sewer included in association; Internet included; Has cooling (central air)
- Home design: Located on entry level 12; Good condition; Condo in Royal Aloha; Resort mixed-use zoning
- Construction: Concrete construction
- Exterior features: Deck/porch; Patio; Community pool; Has a view
Interior
- Flooring: Ceramic tile; Laminate
- Bathrooms: 1 full bathroom
- Heating & cooling: Central air conditioning
- Interior features: Furnished; Ceramic tile and laminate flooring
- Laundry & utility: On-site laundry facilities (community)
Neighborhood map
What this means for you Summary
Snapshot
- This is a 2-bed/1.0-bath condo listed at $315k.
Deal economics
- At list price, monthly cash flow is $-283 ($-3k/yr) — negative.
- To cash-flow at today's rent, offer at most $265k (15.9% below list).
- To meet the 1% rule (rent ≥ 1% of price), the offer needs to be $314k (0.3% below list).
- Recommended offer: $265k (15.9% below list) — sets the bar for cash-flow.
- Cap rate 5.7% vs local median 1.5% in Urban Honolulu — top-decile yield for the area; either an underpriced asset or a hidden risk that comps aren't pricing in. Stress-test before assuming the spread holds.
Location & tenants
- Location reads: area grade D — affects rentability + tenant quality, not the cash-flow math above.
- Hawaii Department Of Education (suburban): math 32% / reading 50% proficiency, ranked #1 of 1 in HI (top 100%) — families likely to look elsewhere, expect single-tenant / working-renter base with shorter leases.
- Zoned schools: Ala Wai Elementary School (math 22% / reading 37%, grade F, #122 of 183 statewide, top 71%, 356 students, 59% FRL); President George Washington Middle School (math 30% / reading 46%, grade F, #17 of 42 statewide, top 39%, 569 students, 61% FRL); Kaimuki High School (math 12% / reading 47%, grade F, #35 of 43 statewide, top 86%, 620 students, 60% FRL) — zoned schools average 60% FRL vs 39% district-wide (21 pts higher); higher-poverty schools than district average — tighter screening recommended.
- Market conditions: Rents rising fast (+6.0%/yr); 813 active listings in the ZIP; 40 comparable units currently listed for rent nearby; rentals at typical pace (median 23d on market — plan ~3-4 weeks tenant-placement turnaround); solid renter incomes; 1,638 units permitted in Honolulu County in 2024 (793 in 5+ unit buildings).
Forward outlook
- In year one you build about $11k of equity ($2k loan paydown + $9k appreciation (2.7% local appreciation)).
- Honolulu County population projected at +17% by 2050 — long-run rental-demand tailwind backs the buy-and-hold thesis.
- By year 4, paydown + projected appreciation supports a ~$37k cash-out refi (75% LTV) — recoverable capital for the next deal without selling this one.
Negotiation context
- It's been on market 26 days — a 2% lower offer ($310k) is reasonable based on typical stale-listing flexibility.
- 3 sale attempts since 19y ago with the ask held roughly flat each time — persistent listings suggest the price (not the market) is what's stuck; bring a comps-based counter.
- Current owner paid $154k; list at $315k implies a 104% gain — meaningful room to come down on a strong offer.
Risks & watch-outs
- Watch-outs: flood insurance adds $122/mo; HOA is 25% of rent.
- Climate carrying-cost: in FEMA flood zone AO (mandatory federal flood insurance) — expect insurance premiums to compound above CPI over the hold.
Questions for the listing agent
- What do current leases actually rent for vs. the listed asking? Can we see a recent rent roll and the last 12 months of T-12 income?
- Built in 1971 — when were the roof, HVAC, electrical panel, plumbing, and water heater last replaced?
- What's the actual annual flood-insurance premium (NFIP or private), and is the property in a SFHA with mandatory coverage?
- What does the HOA fee cover, when was the last increase, and are there any pending special assessments or reserve-fund shortfalls?
- Any open or pending special assessments — roof, HVAC, plumbing, elevator, façade? What's the per-unit balance and payoff schedule, and is the seller paying it off at close or rolling it to the buyer?
- Is there a deadline driving the sale (1031 exchange, divorce, estate, relocation)? That informs how much negotiation room exists.
- The area grade is low — what's the realistic commute time and amenity access for the typical tenant pool here? Any planned neighborhood developments (good or bad) we should know about?
- What's the average days-on-market for RENTAL listings here right now (not sales)? A rising rental-DOM trend means longer vacancies and softer asking-rent achievability than the comps imply.
- What's the recent tenant-quality profile in this submarket — average credit score on applications, eviction rate, late-payment / NSF rate, and stable-employment percentage? A property-management company in the area should have these aggregated.
- How much new apartment / multifamily construction is in the pipeline within 1–3 miles? Heavy new supply (>2% of stock underway) typically softens rents 12–24 months out; light construction supports rent growth.
Investment metrics
- 1% rule
- 1.00% ✗
- Cap rate
- 5.68%
- Cash-on-cash
- -2.19%
- DSCR
- 0.90
- GRM
- 8.4
CMA / ARV
No comps found within radius.
Projected returns pro-forma
2.74% appreciation · 6.0% rent growth · sell at horizon
- IRR
- 5.1%
- Equity multiple
- 1.29×
- Total profit
- $25,808
- Equity at exit
- $137,099
- IRR
- 10.1%
- Equity multiple
- 2.58×
- Total profit
- $139,495
- Equity at exit
- $207,823
Cash invested: $88,200 (down + closing). Projections, not guarantees.
Landlord ↔ Tenant lean methodology
- Overall (STATE)
- 37 Tenant-Leaning
- State Hawaii
- 37 Tenant-Leaning · D+13
- County
- — inherits STATE
- City
- — inherits STATE
ZIP-level market 96815
- Home prices YoY
- 0.9%
- Rents YoY
- 6.0%
- Active inventory
- 813
- Price-to-rent
- 8.4×
Monthly cashflow live
- Estimated rent
- $3,141 high interval (Pro) →
- Mortgage (P&I)
- −$1,652
- Tax from tax record
- −$82 /mo · $989/yr
- Insurance
- −$131
- Flood insurance flood zone
- −$122 /mo · $1,468/yr
- HOA
- −$777
- Vacancy / Maint / Mgmt
- −$660
- Net cashflow
- $-283
Break-even live
Sensitivity live
| Price | -10% $-105 | -5% $-194 | +0% $-283 | +5% $-373 | +10% $-462 |
|---|---|---|---|---|---|
| Rent | -10% $-532 | -5% $-407 | +0% $-283 | +5% $-159 | +10% $-35 |
| Rate | -1.0pp $-125 | -0.5pp $-203 | base $-283 | +0.5pp $-365 | +1.0pp $-448 |
UW: 25.0% down · 7.5% · 30yr · 1.5% tax · 5.0% vac · 8.0% maint · 8.0% mgmt
Financing live
Cash to close
- Down payment
- $78,750
- Closing costs
- $9,450
- Reserves months
- —
- Total cash needed
- —
Loan-product check · same deal, 3 products live
Conventional
25% down · 7.5% · 30yr
- Down + closing
- —
- Monthly P&I
- —
- Monthly cashflow
- —
- DSCR
- —
- Eligible?
- —
Personal DTI + credit; lowest rate.
DSCR
20% down · 8.5% · 30yr
- Down + closing
- —
- Monthly P&I
- —
- Monthly cashflow
- —
- DSCR
- —
- Eligible?
- —
No personal income docs; deal must DSCR.
Hard money
10% down · 12.0% · 12mo
- Down + closing
- —
- Monthly P&I
- —
- Monthly cashflow
- —
- DSCR
- —
- Eligible?
- —
Short-term bridge; refi at stabilization.
Rent comps 40 comps
| Address | Beds | Baths | Sqft | Rent | $/sqft | DOM | Units | Dist |
|---|---|---|---|---|---|---|---|---|
| 1861 Kapiolani Blvd Unit C Honolulu, HI | 1.0 | 1.0 | 525 | $2,700 | $5.14 | 23d | 1 | 0.15mi |
| 425 Ena Rd Unit 204C Honolulu, HI | 1.0 | 1.0 | 600 | $2,700 | $4.50 | 25d | 1 | 0.20mi |
| 400 Hobron Ln #2712 Honolulu, HI | 1.0 | 1.0 | 582 | $2,700 | $4.64 | 13d | 1 | 0.20mi |
| 411 Hobron Ln Unit 1327718P Honolulu, HI | 1.0 | 1.0 | 538 | $3,558 | $6.61 | 13d | 1 | 0.24mi |
| 411 Hobron Ln Honolulu, HI | 1.0 | 1.0 | 566 | $3,575 | $6.31 | 45d | 2 | 0.25mi |
| 411 Hobron Ln Honolulu, HI | 1.0 | 1.0 | 575 | $3,475 | $6.04 | 46d | 3 | 0.25mi |
| 411 Hobron Ln Honolulu, HI | 1.0 | 1.0 | 575 | $3,322 | $5.78 | 5d | 4 | 0.25mi |
| 2333 Kapiolani Blvd Unit 1008B Honolulu, HI | 2.0 | 1.0 | 600 | $2,700 | $4.50 | 25d | 1 | 0.29mi |
| 440 Olohana St Unit 1327703P Honolulu, HI | 1.0 | 1.0 | 355 | $4,055 | $11.42 | 13d | 1 | 0.30mi |
| 440 Olohana St Unit 1327711P Honolulu, HI | 1.0 | 1.0 | 355 | $3,741 | $10.54 | 3d | 1 | 0.30mi |
| 2045 Kalakaua Ave Honolulu, HI | 1.0 | 1.0 | 657 | $4,200 | $6.39 | 45d | 1 | 0.30mi |
| 475 Atkinson Dr Honolulu, HI | 1.0–2.0 | 1.0 | 855 | $3,000 | $3.51 | 25d | 2 | 0.35mi |
| 475 Atkinson Dr Honolulu, HI | 1.0–2.0 | 1.0 | 798 | $3,000 | $3.76 | 23d | 3 | 0.35mi |
| 1778 Ala Moana Blvd #3318 Honolulu, HI | 1.0 | 1.0 | 683 | $3,400 | $4.98 | 5d | 1 | 0.38mi |
| 1778 Ala Moana Blvd #1219 Honolulu, HI | 1.0 | 1.0 | 724 | $4,600 | $6.35 | 25d | 1 | 0.38mi |
| 1778 Ala Moana Blvd #801 Honolulu, HI | 1.0 | 1.0 | 724 | $3,400 | $4.70 | 25d | 1 | 0.38mi |
| 1778 Ala Moana Blvd #1307 Honolulu, HI | 1.0 | 1.0 | 683 | $2,900 | $4.25 | 25d | 1 | 0.38mi |
| 1778 Ala Moana Blvd #2606 Honolulu, HI | 1.0 | 1.0 | 724 | $2,895 | $4.00 | 5d | 1 | 0.38mi |
| 1778 Ala Moana Blvd #1317 Honolulu, HI | 1.0 | 1.0 | 683 | $2,775 | $4.06 | 23d | 1 | 0.38mi |
| 1778 Ala Moana Blvd Unit 1541754P Honolulu, HI | 1.0 | 1.0 | 721 | $4,387 | $6.08 | 16d | 1 | 0.39mi |
| 500 University Ave Honolulu, HI | 1.0–2.0 | 1.0–2.5 | 826 | $3,200 | $3.87 | 13d | 3 | 0.39mi |
| 419A Atkinson Dr Honolulu, HI | 2.0 | 1.0 | 664 | $2,698 | $4.06 | 19d | 2 | 0.39mi |
| 419A Atkinson Dr #1103 Honolulu, HI | 2.0 | 1.0 | 664 | $2,700 | $4.07 | 18d | 1 | 0.39mi |
| 1655 Makaloa St #1510 Honolulu, HI | 1.0 | 1.0 | 500 | $2,600 | $5.20 | 23d | 1 | 0.43mi |
| 2121 Ala Wai Blvd Honolulu, HI | 2.0 | 1.0–3.0 | 1006 | $4,400 | $4.37 | 12d | 1 | 0.43mi |
| 2121 Ala Wai Blvd Honolulu, HI | 2.0 | 1.0–3.0 | 1006 | $4,200 | $4.17 | 23d | 2 | 0.43mi |
| 2121 Ala Wai Blvd Honolulu, HI | 2.0 | 1.0–3.0 | 1006 | $4,150 | $4.12 | 5d | 2 | 0.43mi |
| 1777 Ala Moana Blvd Unit 1327715P Honolulu, HI | 1.0 | 1.0 | 495 | $5,590 | $11.29 | 45d | 1 | 0.44mi |
| 555 University Ave Honolulu, HI | 1.0 | 1.0 | 684 | $2,850 | $4.17 | 5d | 2 | 0.44mi |
| 2140 Khi AVE Unit 2006 Honolulu, HI | 1.0 | 1.0 | 553 | $3,400 | $6.15 | 4d | 1 | 0.45mi |
| 2140 Khi AVE Unit 2306 Honolulu, HI | 1.0 | 1.0 | 553 | $2,700 | $4.88 | 19d | 1 | 0.45mi |
| 2140 Khi Ave Honolulu, HI | 1.0 | 1.0 | 577 | $4,500 | $7.80 | 25d | 1 | 0.45mi |
| 2140 Khi Ave. unit Ph 2506 Honolulu, HI | 1.0 | 1.0 | 678 | $3,200 | $4.72 | 16d | 1 | 0.45mi |
| 1765 Ala Moana Blvd #1183 Honolulu, HI | 1.0 | 1.0 | 440 | $3,100 | $7.05 | 5d | 1 | 0.45mi |
| 445 Kaiolu St Honolulu, HI | 1.0 | 1.0 | 490 | $3,400 | $6.94 | 19d | 1 | 0.48mi |
| 430 Lewers St Unit 25E Honolulu, HI | 1.0 | 1.0 | 673 | $2,700 | $4.01 | 25d | 1 | 0.50mi |
| 430 Lewers St Unit 14D Honolulu, HI | 1.0 | 1.0 | 732 | $2,900 | $3.96 | 25d | 1 | 0.50mi |
| 2211 Ala Wai Blvd Honolulu, HI | 1.0 | 1.0 | 437 | $3,100 | $7.09 | 25d | 1 | 0.55mi |
| 2211 Ala Wai Blvd #1108 Honolulu, HI | 1.0 | 1.0 | 413 | $2,600 | $6.30 | 25d | 1 | 0.55mi |
| 909 Coolidge St #301 Honolulu, HI | 1.0 | 1.0 | 576 | $3,950 | $6.86 | 5d | 1 | 0.58mi |
HOA detail condo
- Monthly dues
- $777 · $9,324/yr
- Assessments
- None detected in remarks — confirm with the listing agent.
Listing history 26 events
-
2026-06-21days on market $315,000 Active 26 DOM
-
2026-06-18days on market $315,000 Active 23 DOM
-
2026-06-17days on market $315,000 Active 22 DOM
-
2026-06-16days on market $315,000 Active 21 DOM
-
2026-06-15days on market $315,000 Active 20 DOM
-
2026-06-13days on market $315,000 Active 18 DOM
-
2026-06-13days on market $315,000 Active 17 DOM
-
2026-06-10days on market $315,000 Active 15 DOM
-
2026-06-09days on market $315,000 Active 14 DOM
-
2026-06-08days on market $315,000 Active 13 DOM
-
2026-06-07days on market $315,000 Active 12 DOM
-
2026-06-05days on market $315,000 Active 9 DOM
-
2026-06-03days on market $315,000 Active 8 DOM
-
2026-06-02days on market $315,000 Active 7 DOM
-
2026-06-01days on market $315,000 Active 6 DOM
-
2026-05-31days on market $315,000 Active 5 DOM
-
2026-05-26$315,000 Active
-
2025-08-03$299,000 Active
-
2018-08-13price $170,000
-
2007-06-06historical
-
2007-05-30$325,000
-
2004-03-22soldstatus $154,500
-
1990-04-20soldstatus $170,000
-
1988-08-29soldstatus $125,000
-
1986-01-01soldstatus $69,500
-
1979-10-01soldstatus $89,500
ⓘ Source: listings_history table (triggers on properties + properties_extension) + one-shot
backfill from property_details.listing_events for pre-trigger history.
Tax reassessment forecast HI · Partial reset (capped growth)
- Current annual tax
- $989 · $82/mo
- Projected year-2 tax
- $989 · $82/mo
- Expected delta
- $0/yr ($0/mo · 0.0%)
ⓘ Screening estimate from a state-policy table — verify with the county assessor before closing.
Climate risk First Street
- Flood 8/10 Severe FEMA zone AO · 99% chance over 30 yrs
- Air quality 1/10 Low
Nearby sold comps map
Loading sold comps map…
Walkable amenities ~0.75 mi
Loading nearby amenities…
Taxation est. · year 1
- Rental income
- $37,694
- − Mortgage interest
- −$17,645
- − Property taxes
- −$989
- − Insurance
- −$3,042
- − Repairs & maintenance
- −$3,016
- − Management
- −$3,016
- − HOA
- −$9,324
- − Depreciation
- −$9,164
- Taxable loss
- −$8,501
- Est. tax savings @ 24.0%
- +$2,040
- After-tax cash flow
- $-1,360/yr
For passive investors: Depreciation is non-cash, so a rental often shows a tax loss while cash-flowing — sheltering income. Rental losses are passive: they offset passive income freely, and up to $25,000/yr can offset ordinary (W-2) income if you actively participate and your MAGI is under $100k (phasing out to $0 by $150k); unused losses carry forward. On sale, claimed depreciation is recaptured at up to 25%, and gains may owe capital-gains tax (a 1031 exchange can defer both). Figures are a year-1 estimate at your 24.0% rate — not tax advice; consult a CPA.
Schools (NCES district)
- District
- Hawaii Department Of Education
- NCES district ID
- 1500030
- Math proficiency
- 32% ▼ -10.00%
- Reading proficiency
- 50% ▼ -3.00%
- Median HH income
- $69,005
- Composite
- 37.07/100
- National rank
- #4504
- State rank
- #1 of 1 in HI
Livability — Urban Honolulu
No livability data for this city. (Only ~50 U.S. cities are tracked.)
Census & demographics
- Census place
- Urban Honolulu, HI
- County
- Honolulu County · 963,448 people
- City population
- 309,956
- Metro
- Urban Honolulu, HI
- Population (ZIP)
- 27,530
- Household income
- $77,096
- Rent vs Own
- Severe rent burden
- 2422.0
Population outlook (Honolulu County) Hauer SSP2
- Today (2025)
- 1,072,641 people
- By 2030
- 1,110,460 · +3.5%
- By 2040
- 1,181,593 · +10.2%
- By 2050
- 1,257,584 · +17.2%
- By 2075
- 1,501,120 · +39.9%
- By 2100
- 1,764,430 · +64.5%
Race, ethnicity, and origin ACS 2023
- Neighborhood character
- Highly diverse neighborhood (Simpson 0.71)
- Race & ethnicity
- Asian 41% White 35% Two or more races 16% Hispanic / Latino 6% Pacific Islander 4% Black 2%
- Hispanic origin (detail)
- Mexican 3% Puerto Rican 1%
- Common ancestry
- Romanian 2% Lithuanian 2% Slovak 2%
- Foreign-born
- 30% · China, South Korea, Canada
- Languages at home
- 66% English-only · Other Asian/Pacific 15% Chinese 5% Korean 3%
Political lean MEDSL · Honolulu
- 2024 margin
- Strong D (+21.6) · D 59.9% · R 38.3% · Other 1.8%
- 2008→2024 swing
- -19.4pp toward R · 2008: 41.1pp · 2024: 21.6pp
- All cycles
- 2024: D+21.6 2020: D+26.9 2016: D+29.9 2012: D+39.1 2008: D+41.1
Not yet ingested
- Civics
- —
Market trends
- HPI YoY
- ▲ 2.74%
- Current HPI
- 291.9404
- Rent YoY
- ▲ 6.00%
- Metro
- Urban Honolulu, HI
- State GDP YoY
- —
- F500 in state
- 0
Price history
+252.0% since first listed10 events — show timeline
- 2026-05-26 Listed $315,000 HiCentral MLS
- 2025-08-03 Listed $299,000 HiCentral MLS
- 2018-08-13 Price Changed $170,000 HiCentral MLS
- 2007-06-06 Listing Removed — HiCentral MLS
- 2007-05-30 Listed $325,000 HiCentral MLS
- 2004-03-22 Sold (Public Records) $154,500 Public Records
- 1990-04-20 Sold (Public Records) $170,000 Public Records
- 1988-08-29 Sold (Public Records) $125,000 Public Records
- 1986-01-01 Sold (Public Records) $69,500 Public Records
- 1979-10-01 Sold (Public Records) $89,500 Public Records
Property tax history
+5.5%/yrLatest (2022): $989 · +9.6% YoY. Source: county tax records.
Cash-flow waterfall
monthlySold comps — $/sqft
last 12 mo · ≤1 miLoading sold comps…