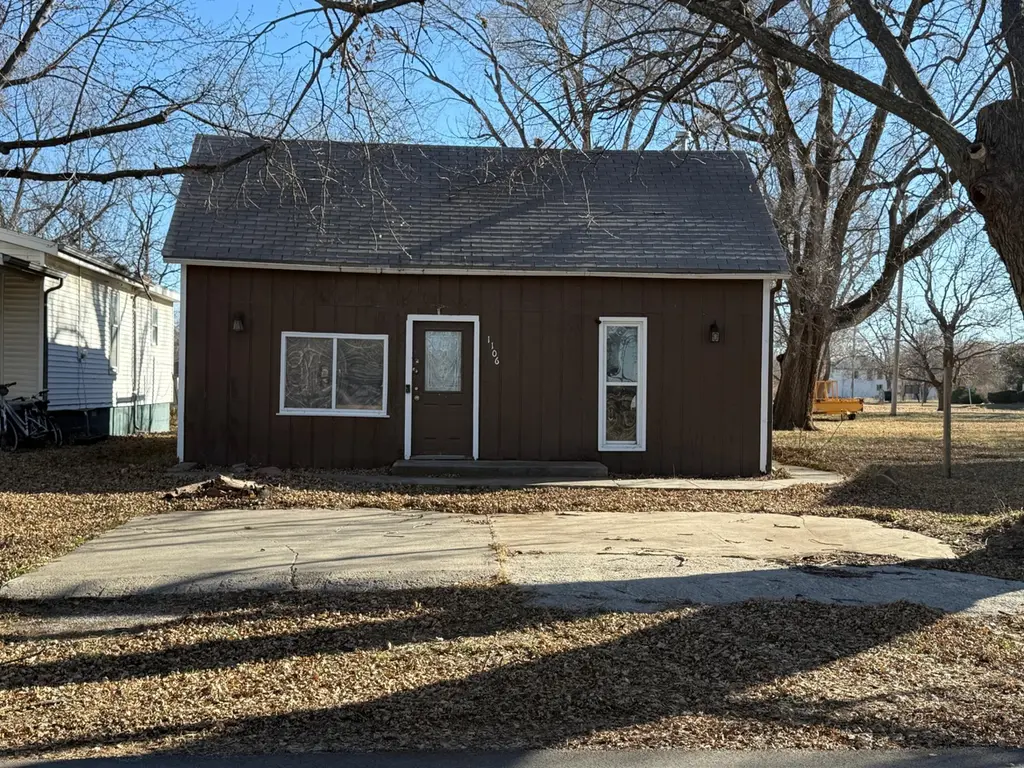
1106 Adams St · Hamburg, IA
Flood risk 6/10 · Moderate
- FEMA flood zone
- AE
- Chance of flooding over 30 yrs
- 0.73%
- Est. flood insurance / yr
- $1,737 – $8,500
Fire risk 4/10 · Minor
- Est. fire insurance / yr
- $902 – $1,676
Heat risk 3/10 · Minor
- Hot days now (above 107°F)
- 7 days/yr
- Hot days in 30 yrs
- 15 days/yr
Wind risk 2/10 · Minimal
- Chance of severe wind over 30 yrs
- —
Air-quality risk 1/10 · Minimal
- Unhealthy air days now
- 0 days/yr
- Unhealthy air days in 30 yrs
- 0 days/yr
Risk factors via First Street. Map © Google.
Why this score? — see what drove the C grade
The composite is a weighted blend of 9 inputs, each scored 0–100. Each bar is that input's sub-score; the figure is the points it added to the 100-point composite (weight × sub-score).
- Cash flow +15.0/30.0
- Appreciation +10.0/10.0
- ARV discount +7.5/15.0
- Schools +6.0/10.0
- 1% rule +5.0/10.0
- DSCR +5.0/10.0
- Livability +3.7/5.0
- Rent growth +2.5/5.0
- Condition / age +2.5/5.0
$19,000
🖨 Deal sheet (PDF) 📄 Offer letter ✓ Due diligence
Listing remarks MLS
This is a FIX-R-UPPER. Exterior of the house has been painted. Seller installed new kitchen cabinets. Seller bought a used hot water heater and furnace but neither has been installed. Seller bought vinal flooring for main floor, which is stored in the shed. This Property IS SOLD AS IS WHERE IS. AMA.
Key facts
- New kitchen cabinets
- Vinal flooring
- 6,160 sq ft lot
Tags
Neighborhood map
What this means for you Summary
Snapshot
- This is a 1-bed/1.0-bath single-family listed at $19k.
Deal economics
- At list price, monthly cash flow is $185 ($2k/yr) — positive.
- The deal already cash-flows at list — no discount required.
- Meets the 1% rule at list price ($922 rent vs $19k).
- Recommended offer: $17k (12.0% below list) — sets the bar for market timing.
Location & tenants
- Location reads 73/100 on livability (#288 in IA) — a middle-class / working-renter tenant base. Strengths: crime A+, cost of living A+, housing A+; Watch: amenities F, commute F, employment F.
- Hamburg Community School District (rural): math 70% / reading 70% proficiency, ranked #187 of 330 in IA (top 57%) — strong family-tenant draw, lease renewals of 3-5y typical.
- Zoned schools: Marnie Simons Elementary School (math 64% / reading 54%, grade B-, #390 of 616 statewide, top 69%, 99 students, 68% FRL); Hamburg Middle School (math 54% / reading 64%, grade B, #185 of 246 statewide, top 78%, 40 students, 70% FRL); Hamburg Charter High Schools (35 students, 66% FRL, charter) — zoned schools average 68% FRL vs 47% district-wide (21 pts higher); higher-poverty schools than district average — tighter screening recommended.
- Market conditions: 12 active listings in the ZIP; 7 units permitted in Fremont County in 2024 (0 in 5+ unit buildings).
Forward outlook
- In year one you build about $2k of equity ($131 loan paydown + $2k appreciation (10.0% local appreciation)).
- Fremont County population projected at -33% by 2050 — secular population decline; favor cash flow + early exit over multi-decade hold.
- At projected returns (10.0% appreciation + 3.0% rent growth), your $5k cash investment doubles in ~2 years — after that, you're playing with house money.
Negotiation context
- It's been on market 184 days — a 12% lower offer ($17k) is reasonable based on typical stale-listing flexibility.
- 2 sale attempts since 4y ago; this cycle's ask has dropped $6k (24%) from the opening price — seller is motivated, your offer sets the floor, not the list.
- Current owner paid $4k; list at $19k implies a 375% gain — meaningful room to come down on a strong offer.
Risks & watch-outs
- Watch-outs: flood insurance adds $427/mo; built in 1920 — expect roof / HVAC / electrical / plumbing capex.
- Climate carrying-cost: in FEMA flood zone AE (mandatory federal flood insurance) — expect insurance premiums to compound above CPI over the hold.
Questions for the listing agent
- It's been on market 184 days. Have you received any prior offers? Is the seller open to a 12% concession, seller financing, or rate buy-down credit?
- Built in 1920 — when were the roof, HVAC, electrical panel, plumbing, and water heater last replaced?
- What's the actual annual flood-insurance premium (NFIP or private), and is the property in a SFHA with mandatory coverage?
- Why hasn't it sold? Are there any deal-killer items the seller is aware of (foundation, flood, title, zoning, code violations)?
- Is there a deadline driving the sale (1031 exchange, divorce, estate, relocation)? That informs how much negotiation room exists.
- Schools are B-rated — typically a magnet for longer-tenancy family renters. What's the average tenant stay here, and is there a school-zone premium baked into asking?
- What's the average days-on-market for RENTAL listings here right now (not sales)? A rising rental-DOM trend means longer vacancies and softer asking-rent achievability than the comps imply.
- What's the recent tenant-quality profile in this submarket — average credit score on applications, eviction rate, late-payment / NSF rate, and stable-employment percentage? A property-management company in the area should have these aggregated.
- How much new for-sale + rental construction is in the pipeline within 1–3 miles? Heavy new supply typically softens prices + rents 12–24 months out; constrained supply supports both.
Investment metrics
- 1% rule
- 4.85% ✓
- Cap rate
- 44.92%
- Cash-on-cash
- 137.94%
- DSCR
- 7.14
- GRM
- 1.7
CMA / ARV
- ARV (median comp)
- $40,965
- List price
- $19,000
- Delta
- -53.62%
- Verdict
- UNDERPRICED
- Comps
- 6 within 1.0 mi
Show comp detail 3 sales within ~0.75 mi
| Address | Dist | Beds/Ba | Sqft | Sold | Price | $/sf | Match |
|---|---|---|---|---|---|---|---|
| 1001 Park St | 0.33mi | 2/1.0 (+1) | 1,092 (+8%) | 1mo | $75,000 | $69 | 66 |
| 101 D St | 0.51mi | 2/1.0 (+1) | 1,004 (-1%) | 13mo | $5,000 | $5 | 59 |
| 507 O St | 0.59mi | 2/1.0 (+1) | 988 (-3%) | 12mo | $95,000 | $96 | 53 |
Match score weights: distance 35% · size 25% · config 20% · recency 20%. Top-matched comps best support the ARV.
Projected returns pro-forma
10.0% appreciation · 3.0% rent growth · sell at horizon
- IRR
- 57.1%
- Equity multiple
- 5.21×
- Total profit
- $22,397
- Equity at exit
- $17,117
- IRR
- 50.9%
- Equity multiple
- 11.76×
- Total profit
- $57,221
- Equity at exit
- $36,913
Cash invested: $5,320 (down + closing). Projections, not guarantees.
Landlord ↔ Tenant lean methodology
- Overall (STATE)
- 83 Strongly Landlord-Friendly
- State Iowa
- 83 Strongly Landlord-Friendly · R+6
- County
- — inherits STATE
- City
- — inherits STATE
ZIP-level market 51640
- Home prices YoY
- 14.1%
- Active inventory
- 12
- Price-to-rent
- 1.7×
Monthly cashflow live
- Estimated rent
- $922 medium interval (Pro) →
- Mortgage (P&I)
- −$100
- Tax from tax record
- −$9 /mo · $108/yr
- Insurance
- −$8
- Flood insurance flood zone
- −$427 /mo · $5,118/yr
- HOA
- −$0
- Vacancy / Maint / Mgmt
- −$194
- Net cashflow
- $185
Break-even live
Sensitivity live
| Price | -10% $196 | -5% $190 | +0% $185 | +5% $180 | +10% $174 |
|---|---|---|---|---|---|
| Rent | -10% $112 | -5% $149 | +0% $185 | +5% $221 | +10% $258 |
| Rate | -1.0pp $195 | -0.5pp $190 | base $185 | +0.5pp $180 | +1.0pp $175 |
UW: 25.0% down · 7.5% · 30yr · 1.5% tax · 5.0% vac · 8.0% maint · 8.0% mgmt
Financing live
Cash to close
- Down payment
- $4,750
- Closing costs
- $570
- Reserves months
- —
- Total cash needed
- —
Loan-product check · same deal, 3 products live
Conventional
25% down · 7.5% · 30yr
- Down + closing
- —
- Monthly P&I
- —
- Monthly cashflow
- —
- DSCR
- —
- Eligible?
- —
Personal DTI + credit; lowest rate.
DSCR
20% down · 8.5% · 30yr
- Down + closing
- —
- Monthly P&I
- —
- Monthly cashflow
- —
- DSCR
- —
- Eligible?
- —
No personal income docs; deal must DSCR.
Hard money
10% down · 12.0% · 12mo
- Down + closing
- —
- Monthly P&I
- —
- Monthly cashflow
- —
- DSCR
- —
- Eligible?
- —
Short-term bridge; refi at stabilization.
Listing history 21 events
-
2026-06-21days on market $19,000 Active 184 DOM
-
2026-06-21days on market $19,000 Active 183 DOM
-
2026-06-18days on market $19,000 Active 181 DOM
-
2026-06-17days on market $19,000 Active 180 DOM
-
2026-06-16days on market $19,000 Active 179 DOM
-
2026-06-15days on market $19,000 Active 178 DOM
-
2026-06-13days on market $19,000 Active 176 DOM
-
2026-06-12days on market $19,000 Active 175 DOM
-
2026-06-09days on market $19,000 Active 172 DOM
-
2026-06-08days on market $19,000 Active 171 DOM
-
2026-06-07days on market $19,000 Active 170 DOM
-
2026-06-07days on market $19,000 Active 169 DOM
-
2026-06-04days on market $19,000 Active 166 DOM
-
2026-06-02days on market $19,000 Active 165 DOM
-
2026-06-01days on market $19,000 Active 164 DOM
-
2026-05-31days on market $19,000 Active 163 DOM
-
2026-05-31days on market $19,000 Active 162 DOM
-
2025-12-19$25,000 Active 300-char remark
Show marketing remark (300 chars)
This is a FIX-R-UPPER. Exterior of the house has been painted. Seller installed new kitchen cabinets. Seller bought a used hot water heater and furnace but neither has been installed. Seller bought vinal flooring for main floor, which is stored in the shed. This Property IS SOLD AS IS WHERE IS. AMA.
-
2023-02-01soldstatus $4,000 Closed 83-char remark
Show marketing remark (83 chars)
Property being sold "AS IS" All information obtained from public records.
-
2023-01-18status Pending 83-char remark
Show marketing remark (83 chars)
Property being sold "AS IS" All information obtained from public records.
-
2022-10-31$5,000 Active 83-char remark
Show marketing remark (83 chars)
Property being sold "AS IS" All information obtained from public records.
ⓘ Source: listings_history table (triggers on properties + properties_extension) + one-shot
backfill from property_details.listing_events for pre-trigger history.
Tax reassessment forecast IA · Partial reset (capped growth)
- Current annual tax
- $108 · $9/mo
- Projected year-2 tax
- $203 · $17/mo
- Expected delta
- +$95/yr (+$8/mo · 88.1%)
ⓘ Screening estimate from a state-policy table — verify with the county assessor before closing.
Climate risk First Street
- Flood 6/10 Major FEMA zone AE · 73% chance over 30 yrs
- Wildfire 4/10 Moderate
- Heat 3/10 Moderate 7 d/yr ≥107°F today · 15 d/yr by 30 yrs out
- Wind 2/10 Low
- Air quality 1/10 Low 0 unhealthy d/yr today · 0 by 30 yrs out
Nearby sold comps map
Loading sold comps map…
Walkable amenities ~0.75 mi
Loading nearby amenities…
Taxation est. · year 1
- Rental income
- $11,060
- − Mortgage interest
- −$1,064
- − Property taxes
- −$108
- − Insurance
- −$5,214
- − Repairs & maintenance
- −$885
- − Management
- −$885
- − Depreciation
- −$553
- Taxable income
- $2,352
- Est. tax owed @ 24.0%
- −$564
- After-tax cash flow
- $1,656/yr
For passive investors: Depreciation is non-cash, so a rental often shows a tax loss while cash-flowing — sheltering income. Rental losses are passive: they offset passive income freely, and up to $25,000/yr can offset ordinary (W-2) income if you actively participate and your MAGI is under $100k (phasing out to $0 by $150k); unused losses carry forward. On sale, claimed depreciation is recaptured at up to 25%, and gains may owe capital-gains tax (a 1031 exchange can defer both). Figures are a year-1 estimate at your 24.0% rate — not tax advice; consult a CPA.
Schools (NCES district)
- District
- Hamburg Community School District
- NCES district ID
- 1913440
- Math proficiency
- 70% ▼ -5.00%
- Reading proficiency
- 70% ▬ 0.00%
- Median HH income
- $42,678
- Composite
- 59.87/100
- National rank
- #1818
- State rank
- #187 of 330 in IA
Livability — Hamburg
- Score
- 73/100
- State rank
- #288
- US rank
- #5552
Category grades
Schools grade is shown separately in the Schools card above.
Census & demographics
- Census place
- Hamburg, IA
- Population (ZIP)
- 1,445
Population outlook (Fremont County) Hauer SSP2
- Today (2025)
- 6,095 people
- By 2030
- 5,632 · -7.6%
- By 2040
- 4,806 · -21.1%
- By 2050
- 4,106 · -32.6%
- By 2075
- 2,947 · -51.6%
- By 2100
- 2,205 · -63.8%
Race, ethnicity, and origin ACS 2023
- Neighborhood character
- Predominantly White (93%)
- Race & ethnicity
- White 93% Two or more races 5% Hispanic / Latino 2%
- Common ancestry
- Slovak 2% Italian 2% Lithuanian 1%
- Foreign-born
- 0%
- Languages at home
- 99% English-only · Other Asian/Pacific 1%
Political lean MEDSL · Fremont
- 2024 margin
- Solid R (+44.6) · D 27.0% · R 71.6% · Other 1.4%
- 2008→2024 swing
- -41.0pp toward R · 2008: -3.6pp · 2024: -44.6pp
- All cycles
- 2024: R+44.6 2020: R+42.3 2016: R+40.6 2012: R+9.2 2008: R+3.6
Not yet ingested
- Civics
- —
Market trends
- HPI YoY
- ▲ 28.63%
- Current HPI
- 231.4701
- Rent YoY
- —
- Metro
- —
- State GDP YoY
- ▲ 2.48%
- F500 in state
- 4
Industry mix (Fortune 500 HQ in IA)
| Industry | F500 HQs | Revenue |
|---|---|---|
| Financial Services | 1 | $16B |
|
||
| Retail / Convenience | 1 | $15B |
|
||
Price history
+400.0% since first listed4 events — show timeline
- 2025-12-19 Listed $25,000 SWIAR
- 2023-02-01 Sold (MLS) $4,000 IAR
- 2023-01-18 Pending — IAR
- 2022-10-31 Listed $5,000 IAR
Property tax history
-8.6%/yrLatest (2025): $108 · -4.4% YoY. Source: county tax records.
Cash-flow waterfall
monthlySold comps — $/sqft
last 12 mo · ≤1 miLoading sold comps…