9865 Ahart Rd · Honcut, CA
Flood risk 1/10 · Minimal
- FEMA flood zone
- X (unshaded)
- Chance of flooding over 30 yrs
- 0.0%
- Est. flood insurance / yr
- $507 – $1,088
Fire risk 10/10 · Severe
- Est. fire insurance / yr
- $659 – $1,223
Heat risk 8/10 · Major
- Hot days now (above 104°F)
- 7 days/yr
- Hot days in 30 yrs
- 16 days/yr
Wind risk 1/10 · Minimal
- Chance of severe wind over 30 yrs
- —
Air-quality risk 10/10 · Severe
- Unhealthy air days now
- 29 days/yr
- Unhealthy air days in 30 yrs
- 31 days/yr
Risk factors via First Street. Map © Google.
Why this score? — see what drove the B- grade
The composite is a weighted blend of 9 inputs, each scored 0–100. Each bar is that input's sub-score; the figure is the points it added to the 100-point composite (weight × sub-score).
- Cash flow +30.0/30.0
- DSCR +10.0/10.0
- 1% rule +8.4/10.0
- ARV discount +7.5/15.0
- Rent growth +2.5/5.0
- Schools +2.5/10.0
- Condition / age +2.5/5.0
- Livability +1.8/5.0
- Appreciation +0.0/10.0
$111,500
🖨 Deal sheet 📄 Offer letter ✓ Due diligence
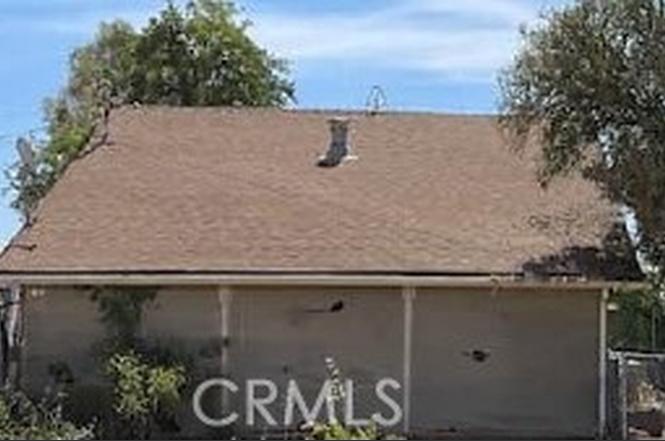
Listing remarks
At just $111,500 this affordable investment opportunity in Oroville, CA is available to you! This home sits on a good-sized lot of approx. 40,075 sq. ft. Home appears to have approx. 858 sq. ft. At this price if you blink, it will be SOLD. Buyers check City, County, Zoning, Tax, and other records to their satisfaction. AS-IS SALE property.
Key facts
- 0.92 acre lot
- Garage
- Built 1940
Property features AI
Finance
- Other: Single-family unit; Zoning: U
- HOA & community: Suburban community
Exterior
- Parking: Attached garage (1 car)
- Utilities: Septic (type unknown); No water source listed
- Home design: Single-story house; No common walls
- Construction: Wood frame construction; Shingle/composition roof; Built year source: Assessor
- Exterior features: Lot is level/flat; No pool
Interior
- Bedrooms: 2 bedrooms on the main level
- Bathrooms: 1 full bathroom
- Interior features: One-level layout; Living room
- Laundry & utility: Laundry available (see remarks)
Neighborhood map
What this means for you Summary
Snapshot
- This is a 2-bed/1.0-bath single-family listed at $112k.
Deal economics
- At list price, monthly cash flow is $439 ($5k/yr) — positive.
- The deal already cash-flows at list — no discount required.
- Meets the 1% rule at list price ($1k rent vs $112k).
- Recommended offer: $98k (12.0% below list) — sets the bar for market timing.
Location & tenants
- Location reads 35/100 on livability (#1,440 in CA) — a limited-amenity area; tenant pool skews transient or value-seeking. Strengths: crime A; Watch: schools D+, amenities F, commute F.
- Palermo Union Elementary (town): math 20% / reading 33% proficiency, ranked #1,149 of 1,400 in CA (top 82%) — low school quality limits family demand, transient renter base, plan for 1-2y turnover; 72% free/reduced lunch — lower-income household profile, screen leases tightly.
- Market conditions: 372 active listings in the ZIP; 946 units permitted in Butte County in 2024 (254 in 5+ unit buildings).
Forward outlook
- Local home prices are declining (-3.0%/yr); year-one equity from $771 of loan paydown is wiped out by about $3k of value loss. Plan a longer hold.
- Butte County population projected at +10% by 2050 — modest demand growth; plan on rents tracking national, not racing it.
- At projected returns (-3.0% appreciation + 3.0% rent growth), your $31k cash investment doubles in ~8 years — after that, you're playing with house money.
Negotiation context
- It's been on market 343 days — a 12% lower offer ($98k) is reasonable based on typical stale-listing flexibility.
Risks & watch-outs
- Watch-outs: built in 1940 — expect roof / HVAC / electrical / plumbing capex.
- Climate carrying-cost: severe wildfire risk; extreme-heat days projected 7→16/yr by 2055 (HVAC capex compounding) — expect insurance premiums to compound above CPI over the hold.
Questions for the listing agent
- It's been on market 343 days. Have you received any prior offers? Is the seller open to a 12% concession, seller financing, or rate buy-down credit?
- Built in 1940 — when were the roof, HVAC, electrical panel, plumbing, and water heater last replaced?
- Why hasn't it sold? Are there any deal-killer items the seller is aware of (foundation, flood, title, zoning, code violations)?
- Is there a deadline driving the sale (1031 exchange, divorce, estate, relocation)? That informs how much negotiation room exists.
- Schools are D-rated, which usually means shorter tenancies and higher turnover. Who's the typical renter profile here, and what's been the actual vacancy rate?
- What's the average days-on-market for RENTAL listings here right now (not sales)? A rising rental-DOM trend means longer vacancies and softer asking-rent achievability than the comps imply.
- What's the recent tenant-quality profile in this submarket — average credit score on applications, eviction rate, late-payment / NSF rate, and stable-employment percentage? A property-management company in the area should have these aggregated.
- How much new for-sale + rental construction is in the pipeline within 1–3 miles? Heavy new supply typically softens prices + rents 12–24 months out; constrained supply supports both.
Investment metrics
- 1% rule
- 1.34% ✓
- Cap rate
- 11.02%
- Cash-on-cash
- 16.88%
- DSCR
- 1.75
- GRM
- 6.2
CMA / ARV
No comps found within radius.
Projected returns pro-forma
-3.0% appreciation · 3.0% rent growth · sell at horizon
- IRR
- 8.1%
- Equity multiple
- 1.32×
- Total profit
- $9,904
- Equity at exit
- $16,625
- IRR
- 17.3%
- Equity multiple
- 2.43×
- Total profit
- $44,650
- Equity at exit
- $9,640
Cash invested: $31,220 (down + closing). Projections, not guarantees.
Landlord ↔ Tenant lean methodology
- Overall (STATE)
- 18 Strongly Tenant-Friendly
- State California
- 18 Strongly Tenant-Friendly · D+13
- County
- — inherits STATE
- City
- — inherits STATE
ZIP-level market 95966
- Active inventory
- 372
- Price-to-rent
- 6.2×
Monthly cashflow live
- Estimated rent
- $1,490 medium interval (Pro) →
- Mortgage (P&I)
- −$585
- Tax from tax record
- −$106 /mo · $1,278/yr
- Insurance
- −$46
- HOA
- −$0
- Vacancy / Maint / Mgmt
- −$313
- Net cashflow
- $439
Break-even live
UW: 25.0% down · 7.5% · 30yr · 1.5% tax · 5.0% vac · 8.0% maint · 8.0% mgmt
Financing live
Cash to close
- Down payment
- $27,875
- Closing costs
- $3,345
- Reserves months
- —
- Total cash needed
- —
Loan-product check · same deal, 3 products live
Conventional
25% down · 7.5% · 30yr
- Down + closing
- —
- Monthly P&I
- —
- Monthly cashflow
- —
- DSCR
- —
- Eligible?
- —
Personal DTI + credit; lowest rate.
DSCR
20% down · 8.5% · 30yr
- Down + closing
- —
- Monthly P&I
- —
- Monthly cashflow
- —
- DSCR
- —
- Eligible?
- —
No personal income docs; deal must DSCR.
Hard money
10% down · 12.0% · 12mo
- Down + closing
- —
- Monthly P&I
- —
- Monthly cashflow
- —
- DSCR
- —
- Eligible?
- —
Short-term bridge; refi at stabilization.
Listing history 35 events
-
2026-06-19days on market $111,500 Active 343 DOM
-
2026-06-18days on market $111,500 Active 342 DOM
-
2026-06-17days on market $111,500 Active 341 DOM
-
2026-06-16days on market $111,500 Active 340 DOM
-
2026-06-15days on market $111,500 Active 339 DOM
-
2026-06-14days on market $111,500 Active 337 DOM
-
2026-06-13days on market $111,500 Active 336 DOM
-
2026-06-10days on market $111,500 Active 334 DOM
-
2026-06-09days on market $111,500 Active 333 DOM
-
2026-06-08days on market $111,500 Active 332 DOM
-
2026-06-07pricedays on market $111,500 Active 331 DOM
-
2026-06-05days on market $112,100 Active 328 DOM
-
2026-06-02days on market $112,100 Active 326 DOM
-
2026-06-01days on market $112,100 Active 325 DOM
-
2026-05-31days on market $112,100 Active 324 DOM
-
2026-05-30days on market $112,100 Active 323 DOM
-
2026-05-07price $112,100
-
2026-04-17price $112,700
-
2026-03-11price $113,600
-
2026-02-17price $114,600
-
2026-01-29price $116,600
-
2025-12-29price $119,500
-
2025-12-11price $121,200
-
2025-11-25price $123,200
-
2025-11-07price $126,500
-
2025-10-23price $131,900
-
2025-10-06price $143,500
-
2025-09-17price $155,000
-
2025-09-02price $168,200
-
2025-08-18price $188,900
-
2025-07-29price $224,300
-
2025-07-11$249,100 Active
-
2005-08-12soldstatus $135,000
-
2005-08-12soldstatus $195,000
-
1985-08-12soldstatus $47,000
ⓘ Source: listings_history table (triggers on properties + properties_extension) + one-shot
backfill from property_details.listing_events for pre-trigger history.
Tax reassessment forecast CA · Resets to sale price
- Current annual tax
- $1,278 · $106/mo
- Projected year-2 tax
- $1,278 · $106/mo
- Expected delta
- $0/yr ($0/mo · 0.0%)
ⓘ Screening estimate from a state-policy table — verify with the county assessor before closing.
Climate risk First Street
- Flood 1/10 Low FEMA zone X (unshaded) · 0% chance over 30 yrs
- Wildfire 10/10 Extreme
- Heat 8/10 Severe 7 d/yr ≥104°F today · 16 d/yr by 30 yrs out
- Wind 1/10 Low
- Air quality 10/10 Extreme 29 unhealthy d/yr today · 31 by 30 yrs out
Nearby sold comps map
Loading sold comps map…
Walkable amenities ~0.75 mi
Loading nearby amenities…
Taxation est. · year 1
- Rental income
- $17,876
- − Mortgage interest
- −$6,246
- − Property taxes
- −$1,278
- − Insurance
- −$558
- − Repairs & maintenance
- −$1,430
- − Management
- −$1,430
- − Depreciation
- −$3,244
- Taxable income
- $3,691
- Est. tax owed @ 24.0%
- −$886
- After-tax cash flow
- $4,384/yr
For passive investors: Depreciation is non-cash, so a rental often shows a tax loss while cash-flowing — sheltering income. Rental losses are passive: they offset passive income freely, and up to $25,000/yr can offset ordinary (W-2) income if you actively participate and your MAGI is under $100k (phasing out to $0 by $150k); unused losses carry forward. On sale, claimed depreciation is recaptured at up to 25%, and gains may owe capital-gains tax (a 1031 exchange can defer both). Figures are a year-1 estimate at your 24.0% rate — not tax advice; consult a CPA.
Schools (NCES district)
- District
- Palermo Union Elementary
- NCES district ID
- 0629540
- Math proficiency
- 20% ▲ 1.00%
- Reading proficiency
- 33% ▬ 0.00%
- Median HH income
- $39,628
- Composite
- 25.26/100
- National rank
- #12903
- State rank
- #1149 of 1400 in CA
Livability — Honcut
- Score
- 35/100
- State rank
- #1440
- US rank
- #27741
Category grades
Schools grade is shown separately in the Schools card above.
Census & demographics
- Census place
- Honcut, CA
- County
- Butte County · 175,030 people
- Metro
- Chico, CA
- Population (ZIP)
- 28,503
- Household income
- $65,586
- Rent vs Own
- Severe rent burden
- 807.0
Population outlook (Butte County) Hauer SSP2
- Today (2025)
- 237,527 people
- By 2030
- 243,804 · +2.6%
- By 2040
- 253,899 · +6.9%
- By 2050
- 262,561 · +10.5%
- By 2075
- 283,709 · +19.4%
- By 2100
- 282,689 · +19.0%
Race, ethnicity, and origin ACS 2023
- Neighborhood character
- Predominantly White (67%)
- Race & ethnicity
- White 67% Hispanic / Latino 18% Two or more races 14% Asian 6% Native American 2% Black 2%
- Hispanic origin (detail)
- Mexican 16%
- Common ancestry
- Lithuanian 3% Slovak 3% Portuguese 2%
- Foreign-born
- 6% · Canada
- Languages at home
- 88% English-only · Spanish 7% Other Asian/Pacific 3% Russian/Polish/Slavic 1%
Political lean MEDSL · Butte
- 2024 margin
- Toss-up / Even · D 46.8% · R 49.9% · Other 3.3%
- 2008→2024 swing
- -5.5pp toward R · 2008: 2.4pp · 2024: -3.1pp
- All cycles
- 2024: R+3.1 2020: D+1.7 2016: R+4.0 2012: R+3.9 2008: D+2.4
Not yet ingested
- Civics
- —
Market trends
- HPI YoY
- ▼ -284.58%
- Current HPI
- 267.1415
- Rent YoY
- —
- Metro
- Chico, CA
- State GDP YoY
- ▲ 3.21%
- F500 in state
- 116
Industry mix (Fortune 500 HQ in CA)
| Industry | F500 HQs | Revenue |
|---|---|---|
| Technology | 27 | $1,492B |
|
||
| Financial Services | 3 | $174B |
|
||
| Retail | 3 | $44B |
|
||
| Insurance | 3 | $26B |
|
||
| Media / Entertainment | 2 | $115B |
|
||
| Pharmaceuticals / Biotech | 2 | $62B |
|
||
Price history
+138.5% since first listed19 events — show timeline
- 2026-05-07 Price Changed $112,100 CRMLS
- 2026-04-17 Price Changed $112,700 CRMLS
- 2026-03-11 Price Changed $113,600 CRMLS
- 2026-02-17 Price Changed $114,600 CRMLS
- 2026-01-29 Price Changed $116,600 CRMLS
- 2025-12-29 Price Changed $119,500 CRMLS
- 2025-12-11 Price Changed $121,200 CRMLS
- 2025-11-25 Price Changed $123,200 CRMLS
- 2025-11-07 Price Changed $126,500 CRMLS
- 2025-10-23 Price Changed $131,900 CRMLS
- 2025-10-06 Price Changed $143,500 CRMLS
- 2025-09-17 Price Changed $155,000 CRMLS
- 2025-09-02 Price Changed $168,200 CRMLS
- 2025-08-18 Price Changed $188,900 CRMLS
- 2025-07-29 Price Changed $224,300 CRMLS
- 2025-07-11 Listed $249,100 CRMLS
- 2005-08-12 Sold (Public Records) $195,000 Public Records
- 2005-08-12 Sold (Public Records) $135,000 Public Records
- 1985-08-12 Sold (Public Records) $47,000 Public Records
Property tax history
+2.2%/yrLatest (2025): $1,278 · +1.5% YoY. Source: county tax records.
Cash-flow waterfall
monthlySold comps — $/sqft
last 12 mo · ≤1 miLoading sold comps…