 🏗️ New Construction
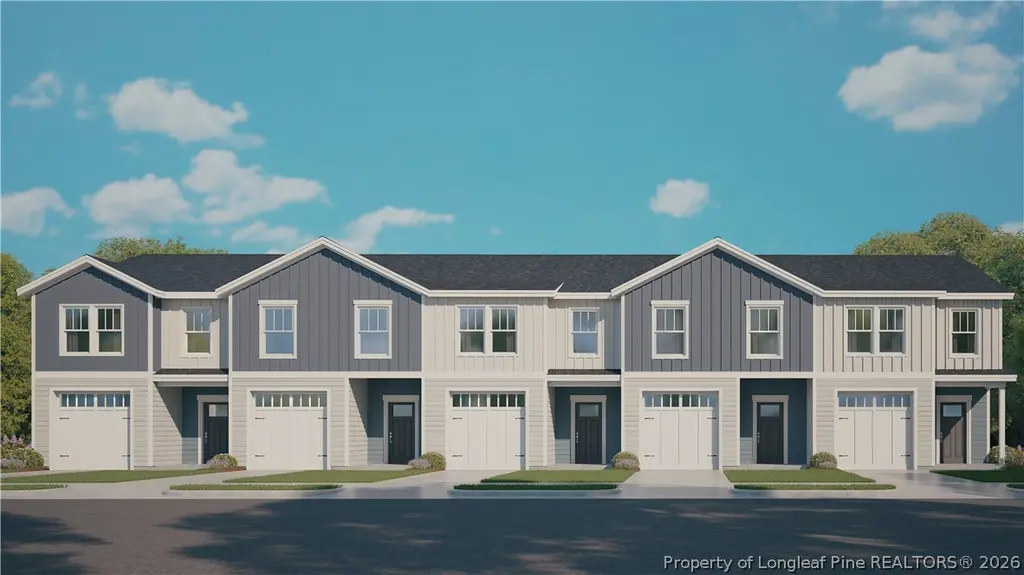
1708 Florshine Way #8 · Fayetteville, NC
Flood risk No data
- FEMA flood zone
- —
- Chance of flooding over 30 yrs
- —
- Est. flood insurance / yr
- —
Fire risk No data
- Est. fire insurance / yr
- —
Heat risk No data
- Hot days now (above threshold)
- —
- Hot days in 30 yrs
- —
Wind risk No data
- Chance of severe wind over 30 yrs
- —
Air-quality risk No data
- Unhealthy air days now
- —
- Unhealthy air days in 30 yrs
- —
Risk factors via First Street. Map © Google.
Why this score? — see what drove the C- grade
The composite is a weighted blend of 9 inputs, each scored 0–100. Each bar is that input's sub-score; the figure is the points it added to the 100-point composite (weight × sub-score).
- Cash flow +13.7/30.0
- Appreciation +10.0/10.0
- ARV discount +7.5/15.0
- 1% rule +4.6/10.0
- DSCR +4.1/10.0
- Livability +3.8/5.0
- Schools +3.1/10.0
- Rent growth +2.5/5.0
- Condition / age +2.5/5.0
$259,950
🖨 Deal sheet (PDF) 📄 Offer letter ✓ Due diligence
Listing remarks
Ben Stout Construction proudly presents the Towns at Riverbluff, conveniently located within 5 minute drive to downtown Fayetteville and just 20 minutes to Fort Bragg. Featuring beautifully designed new construction townhomes with low-maintenance living. Offering approximately 1,515 sq ft, each home includes a 1-car garage and an open-concept layout with 9’ ceilings and durable LVP flooring throughout the main living areas. The kitchen features granite countertops, shaker-style cabinets, tile backsplash, and stainless steel GE appliances. Spacious bedrooms include a primary suite with quartz countertops, a framed shower, and modern finishes throughout. Enjoy energy-efficient features
Key facts
- $117 HOA
- Garage
- Built 2026
Neighborhood map
What this means for you Summary
Snapshot
- This is a 3-bed/2.5-bath townhouse listed at $260k.
Deal economics
- At list price, monthly cash flow is $15 ($182/yr) — positive.
- To cash-flow at today's rent, offer at most $202k (22.4% below list).
- To meet the 1% rule (rent ≥ 1% of price), the offer needs to be $191k (26.4% below list).
- Recommended offer: $191k (26.4% below list) — sets the bar for 1% rule.
- Cap rate 6.4% vs local median 4.8% in Fayetteville — top-decile yield for the area; either an underpriced asset or a hidden risk that comps aren't pricing in. Stress-test before assuming the spread holds.
Location & tenants
- Location reads 75/100 on livability (#45 in NC, #4,031 nationally) — a middle-class / working-renter tenant base. Strengths: commute A+, cost of living A+, housing A+; Watch: crime F, employment D-.
- Cumberland County Schools (urban): math 32% / reading 41% proficiency, ranked #126 of 178 in NC (top 71%) — families likely to look elsewhere, expect single-tenant / working-renter base with shorter leases.
- Zoned schools: Armstrong Elementary (math 43% / reading 40%, grade F, #673 of 1,410 statewide, top 48%, 478 students, 99% FRL); Mac Williams Middle (math 40% / reading 50%, grade D, #160 of 475 statewide, top 35%, 1,151 students, 58% FRL); Cape Fear High (math 75% / reading 47%, grade C+, #202 of 535 statewide, top 39%, 1,529 students, 50% FRL).
- Zoned-school proficiency averages 49% at this address vs 36% district-wide (+13 pts) — the actual schools serving this property are materially stronger than the Cumberland County Schools average implies; a family-tenant draw the district grade alone would hide.
- Market conditions: 223 active listings in the ZIP; 3 comparable units currently listed for rent nearby; rentals at typical pace (median 26d on market — plan ~3-4 weeks tenant-placement turnaround); 1,125 units permitted in Cumberland County in 2024 (104 in 5+ unit buildings).
Forward outlook
- In year one you build about $21k of equity ($1k loan paydown + $20k appreciation (10.0% local appreciation)).
- At projected returns (10.0% appreciation + 3.0% rent growth), your $56k cash investment doubles in ~3 years — after that, you're playing with house money.
- By year 2, paydown + projected appreciation supports a ~$34k cash-out refi (75% LTV) — recoverable capital for the next deal without selling this one.
Negotiation context
- Only 0 days on market — expect competitive offers; lowballing is unlikely to land.
Questions for the listing agent
- What does the HOA fee cover, when was the last increase, and are there any pending special assessments or reserve-fund shortfalls?
- Is there a deadline driving the sale (1031 exchange, divorce, estate, relocation)? That informs how much negotiation room exists.
- Crime grade is F in this area — have there been break-ins, vandalism, or insurance claims at this property in the last 3 years? What carrier currently insures it and at what premium?
- What's the average days-on-market for RENTAL listings here right now (not sales)? A rising rental-DOM trend means longer vacancies and softer asking-rent achievability than the comps imply.
- What's the recent tenant-quality profile in this submarket — average credit score on applications, eviction rate, late-payment / NSF rate, and stable-employment percentage? A property-management company in the area should have these aggregated.
- How much new for-sale + rental construction is in the pipeline within 1–3 miles? Heavy new supply typically softens prices + rents 12–24 months out; constrained supply supports both.
Investment metrics
- 1% rule
- 0.96% ✗
- Cap rate
- 6.38%
- Cash-on-cash
- 0.32%
- DSCR
- 1.01
- GRM
- 8.7
CMA / ARV
- ARV (on-the-fly)
- $199,500
- Comps found
- 2
Show comp detail 2 sales within ~0.75 mi
| Address | Dist | Beds/Ba | Sqft | Sold | Price | $/sf | Match |
|---|---|---|---|---|---|---|---|
| 1611 Bluffside Dr #205 | 0.29mi | 3/2.0 | 1,571 (+5%) | 7mo | $209,000 | $133 | 71 |
| 1611 Bluffside #105 Dr | 0.29mi | 3/2.0 | 1,650 (+10%) | 7mo | $180,000 | $109 | 62 |
Match score weights: distance 35% · size 25% · config 20% · recency 20%. Top-matched comps best support the ARV.
Projected returns pro-forma
10.0% appreciation · 3.0% rent growth · sell at horizon
- IRR
- 24.5%
- Equity multiple
- 2.96×
- Total profit
- $109,717
- Equity at exit
- $179,725
- IRR
- 21.7%
- Equity multiple
- 6.77×
- Total profit
- $322,542
- Equity at exit
- $387,585
Cash invested: $55,860 (down + closing). Projections, not guarantees.
Landlord ↔ Tenant lean methodology
- Overall (STATE)
- 85 Strongly Landlord-Friendly
- State North Carolina
- 85 Strongly Landlord-Friendly · R+3
- County
- — inherits STATE
- City
- — inherits STATE
ZIP-level market 28312
- Home prices YoY
- 6.9%
- Active inventory
- 223
- Price-to-rent
- 11.3×
Monthly cashflow live
- Estimated rent
- $1,912 medium interval (Pro) →
- Mortgage (P&I)
- −$1,046
- Tax est. 1.5%
- −$249 /mo · $2,992/yr
- Insurance
- −$83
- HOA
- −$117
- Vacancy / Maint / Mgmt
- −$402
- Net cashflow
- $15
Break-even live
Sensitivity live
| Price | -10% $153 | -5% $84 | +0% $15 | +5% $-54 | +10% $-123 |
|---|---|---|---|---|---|
| Rent | -10% $-136 | -5% $-60 | +0% $15 | +5% $91 | +10% $166 |
| Rate | -1.0pp $116 | -0.5pp $66 | base $15 | +0.5pp $-37 | +1.0pp $-89 |
UW: 25.0% down · 7.5% · 30yr · 1.5% tax · 5.0% vac · 8.0% maint · 8.0% mgmt
Financing live
Cash to close
- Down payment
- $49,875
- Closing costs
- $5,985
- Reserves months
- —
- Total cash needed
- —
Loan-product check · same deal, 3 products live
Conventional
25% down · 7.5% · 30yr
- Down + closing
- —
- Monthly P&I
- —
- Monthly cashflow
- —
- DSCR
- —
- Eligible?
- —
Personal DTI + credit; lowest rate.
DSCR
20% down · 8.5% · 30yr
- Down + closing
- —
- Monthly P&I
- —
- Monthly cashflow
- —
- DSCR
- —
- Eligible?
- —
No personal income docs; deal must DSCR.
Hard money
10% down · 12.0% · 12mo
- Down + closing
- —
- Monthly P&I
- —
- Monthly cashflow
- —
- DSCR
- —
- Eligible?
- —
Short-term bridge; refi at stabilization.
Rent comps 3 comps
| Address | Beds | Baths | Sqft | Rent | $/sqft | DOM | Units | Dist |
|---|---|---|---|---|---|---|---|---|
| 1611 Bluffside Dr Fayetteville, NC | 3.0 | 2.5–3.5 | 2112 | $1,800 | $0.85 | 25d | 3 | 0.28mi |
| 130 Openview Dr Fayetteville, NC | 4.0 | 2.0 | 1550 | $1,995 | $1.29 | 25d | 1 | 0.48mi |
| 340 Adam St Fayetteville, NC | 3.0 | 2.0 | 1742 | $2,100 | $1.21 | 25d | 1 | 1.38mi |
HOA detail
- Monthly dues
- $117 · $1,404/yr
Listing history 2 events
-
2026-06-08remarks 693-char remark
-
2026-06-08$259,950 Pending
ⓘ Source: listings_history table (triggers on properties + properties_extension) + one-shot
backfill from property_details.listing_events for pre-trigger history.
Nearby sold comps map
Loading sold comps map…
Walkable amenities ~0.75 mi
Loading nearby amenities…
Taxation est. · year 1
- Rental income
- $22,949
- − Mortgage interest
- −$11,175
- − Property taxes
- −$2,992
- − Insurance
- −$998
- − Repairs & maintenance
- −$1,836
- − Management
- −$1,836
- − HOA
- −$1,404
- − Depreciation
- −$5,804
- Taxable loss
- −$3,095
- Est. tax savings @ 24.0%
- +$743
- After-tax cash flow
- $924/yr
For passive investors: Depreciation is non-cash, so a rental often shows a tax loss while cash-flowing — sheltering income. Rental losses are passive: they offset passive income freely, and up to $25,000/yr can offset ordinary (W-2) income if you actively participate and your MAGI is under $100k (phasing out to $0 by $150k); unused losses carry forward. On sale, claimed depreciation is recaptured at up to 25%, and gains may owe capital-gains tax (a 1031 exchange can defer both). Figures are a year-1 estimate at your 24.0% rate — not tax advice; consult a CPA.
Schools (NCES district)
- District
- Cumberland County Schools
- NCES district ID
- 3700011
- Math proficiency
- 32% ▼ -2.00%
- Reading proficiency
- 41% ▼ -1.00%
- Median HH income
- $44,168
- Composite
- 31.0/100
- National rank
- #6096
- State rank
- #126 of 178 in NC
Livability — Fayetteville
- Score
- 75/100
- State rank
- #45
- US rank
- #4031
Category grades
Schools grade is shown separately in the Schools card above.
Census & demographics
- Census place
- Fayetteville, NC
- City population
- 226,118
- Population (ZIP)
- 19,889
Population outlook (Cumberland County) Hauer SSP2
- Today (2025)
- 330,855 people
- By 2030
- 333,523 · +0.8%
- By 2040
- 335,583 · +1.4%
- By 2050
- 335,325 · +1.4%
- By 2075
- 342,853 · +3.6%
- By 2100
- 340,698 · +3.0%
Race, ethnicity, and origin ACS 2023
- Neighborhood character
- Diverse neighborhood (Simpson 0.61)
- Race & ethnicity
- White 55% Black 29% Two or more races 8% Hispanic / Latino 8% Native American 2%
- Hispanic origin (detail)
- Mexican 4% Puerto Rican 2%
- Common ancestry
- Slovak 3% Serbian 2% Italian 2%
- Foreign-born
- 4% · Canada
- Languages at home
- 93% English-only · Spanish 5% French/Haitian/Cajun 1%
Political lean MEDSL · Cumberland
- 2024 margin
- D (+13.4) · D 56.1% · R 42.7% · Other 1.2%
- 2008→2024 swing
- -4.3pp toward R · 2008: 17.7pp · 2024: 13.4pp
- All cycles
- 2024: D+13.4 2020: D+16.6 2016: D+16.0 2012: D+19.7 2008: D+17.7
Not yet ingested
- Civics
- —
Market trends
- HPI YoY
- ▲ 19.75%
- Current HPI
- 306.7749
- Rent YoY
- —
- Metro
- —
- State GDP YoY
- ▲ 3.28%
- F500 in state
- 26
Industry mix (Fortune 500 HQ in NC)
| Industry | F500 HQs | Revenue |
|---|---|---|
| Financial Services | 2 | $213B |
|
||
| Retail | 2 | $95B |
|
||
| Industrial Conglomerate | 1 | $38B |
|
||
| Metals / Steel | 1 | $35B |
|
||
| Utilities | 1 | $30B |
|
||
| Industrial Machinery | 1 | $19B |
|
||
Price history
2 events — show timeline
- 2026-06-05 Delisted — LPRMLS
- 2026-06-04 Listed $259,950 LPRMLS
Cash-flow waterfall
monthlySold comps — $/sqft
last 12 mo · ≤1 miLoading sold comps…