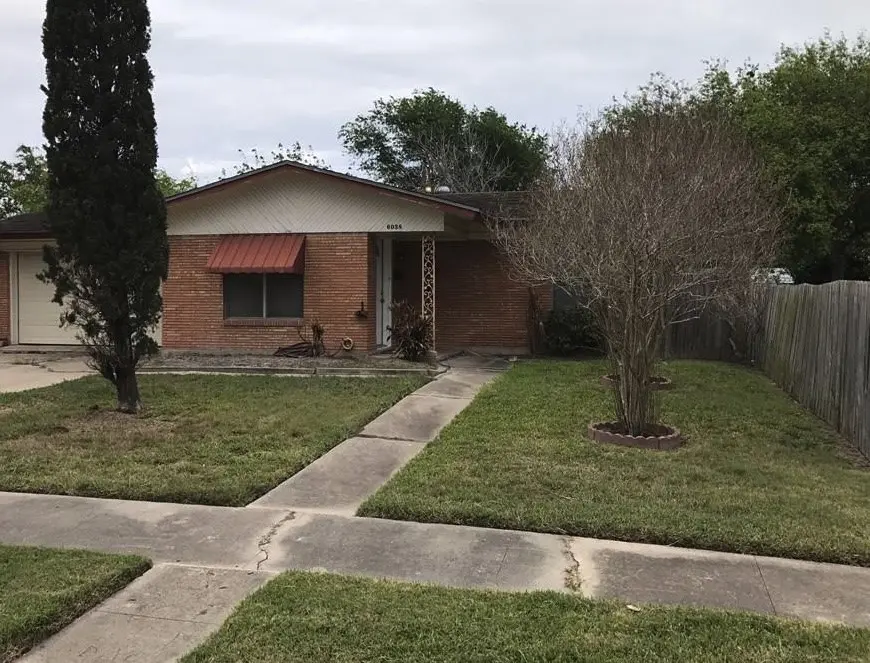
6038 Lucille Dr · Corpus Christi, TX
Flood risk 7/10 · Major
- FEMA flood zone
- X (unshaded)
- Chance of flooding over 30 yrs
- 0.99%
- Est. flood insurance / yr
- $507 – $1,088
Fire risk 1/10 · Minimal
- Est. fire insurance / yr
- $1,222 – $2,270
Heat risk 10/10 · Severe
- Hot days now (above 107°F)
- 7 days/yr
- Hot days in 30 yrs
- 27 days/yr
Wind risk 9/10 · Severe
- Chance of severe wind over 30 yrs
- 99.0%
Air-quality risk 1/10 · Minimal
- Unhealthy air days now
- 0 days/yr
- Unhealthy air days in 30 yrs
- 0 days/yr
Risk factors via First Street. Map © Google.
Why this score? — see what drove the D+ grade
The composite is a weighted blend of 9 inputs, each scored 0–100. Each bar is that input's sub-score; the figure is the points it added to the 100-point composite (weight × sub-score).
- Cash flow +14.7/30.0
- ARV discount +10.7/15.0
- 1% rule +4.6/10.0
- DSCR +4.5/10.0
- Livability +3.9/5.0
- Schools +2.8/10.0
- Condition / age +2.5/5.0
- Rent growth +2.1/5.0
- Appreciation +0.0/10.0
$150,000
🖨 Deal sheet (PDF) 📄 Offer letter ✓ Due diligence
Listing remarks MLS
Turnkey Rental Investment – Stable Cash Flow & Strong Upside in Corpus Christi! This well-maintained 3bd 1ba is a true investor’s gem in the desirable Bay Area neighborhood. The property has been occupied by the same reliable long-term tenant since 2019 — delivering consistent, worry-free income with virtually zero vacancy or turnover issues for over six years. Currently, the rent is below current market rents for 3-bedroom properties. That creates excellent upside potential for increased cash flow upon lease renewal while benefiting from an established, stable tenant. Priced for strong value and built-in equity, it’s ideal for savvy investors looking to add to their portfolio or launch their rental business with a proven performer. The home is well-maintained and turnkey — fully ready for seamless ownership transfer. Located in the convenient Bay Area neighborhood, residents enjoy easy access to Corpus Christi Bay, parks, bayside recreation, fishing, boating, shopping, and dining. This is a true turnkey investment. Perfect for experienced investors seeking stable, low-maintenance additions to their holdings or first-time landlords wanting a hassle-free entry into the Coastal Bend rental market. Secure steady income from day one. Don’t miss this opportunity — call your favorite agent today and add this Bay Area rental to your portfolio!
Key facts
- Boating
- Bayside recreation
- Shopping
Tags
Neighborhood map
What this means for you Summary
Snapshot
- This is a 3-bed/1.0-bath single-family listed at $150k.
Deal economics
- At list price, monthly cash flow is $-27 ($-328/yr) — negative.
- To cash-flow at today's rent, offer at most $145k (3.2% below list).
- To meet the 1% rule (rent ≥ 1% of price), the offer needs to be $144k (3.9% below list).
- Recommended offer: $141k (6.0% below list) — sets the bar for market timing.
- Cap rate 6.6% vs local median 3.6% in Corpus Christi — top-decile yield for the area; either an underpriced asset or a hidden risk that comps aren't pricing in. Stress-test before assuming the spread holds.
Location & tenants
- Location reads 78/100 on livability (#66 in TX, #2,404 nationally) — a middle-class / working-renter tenant base. Strengths: commute A+, cost of living A+, housing A+; Watch: crime F.
- Corpus Christi ISD (urban): math 31% / reading 35% proficiency, ranked #562 of 826 in TX (top 68%) — families likely to look elsewhere, expect single-tenant / working-renter base with shorter leases; 63% free/reduced lunch — lower-income household profile, screen leases tightly.
- Zoned schools: Windsor Park G/T (math 85% / reading 90%, grade A+, #6 of 4,322 statewide, top 0%, 609 students, 29% FRL); Adkins Middle (math 40% / reading 39%, grade F, #660 of 1,662 statewide, top 41%, 956 students, 48% FRL); King H S (math 35% / reading 36%, grade F, #941 of 1,632 statewide, top 58%, 1,400 students, 63% FRL) — zoned schools average 47% FRL vs 63% district-wide (16 pts lower); this property's tenant base skews higher-income than the district average.
- Zoned-school proficiency averages 54% at this address vs 33% district-wide (+21 pts) — the actual schools serving this property are materially stronger than the Corpus Christi ISD average implies; a family-tenant draw the district grade alone would hide.
- Market conditions: Rents soft (-1.5%/yr); 212 active listings in the ZIP; 18 comparable units currently listed for rent nearby; rentals at typical pace (median 24d on market — plan ~3-4 weeks tenant-placement turnaround); 1,397 units permitted in Nueces County in 2024 (47 in 5+ unit buildings).
Forward outlook
- Local home prices are declining (-3.0%/yr); year-one equity from $1k of loan paydown is wiped out by about $4k of value loss. Plan a longer hold.
- Nueces County population projected at +36% by 2050 — long-run rental-demand tailwind backs the buy-and-hold thesis.
Negotiation context
- It's been on market 79 days — a 6% lower offer ($141k) is reasonable based on typical stale-listing flexibility.
- 2 sale attempts since 10y ago; this cycle's ask has dropped $10k (6%) from the opening price — seller is motivated, your offer sets the floor, not the list.
- Current owner paid $23k; list at $150k implies a 552% gain — meaningful room to come down on a strong offer.
Risks & watch-outs
- Watch-outs: flood insurance adds $66/mo; built in 1958 — expect roof / HVAC / electrical / plumbing capex.
- Climate carrying-cost: major flood risk; severe wind risk, 99% chance of damaging wind over 30y; extreme-heat days projected 7→27/yr by 2055 (HVAC capex compounding) — expect insurance premiums to compound above CPI over the hold.
Questions for the listing agent
- What do current leases actually rent for vs. the listed asking? Can we see a recent rent roll and the last 12 months of T-12 income?
- It's been on market 79 days. Have you received any prior offers? Is the seller open to a 6% concession, seller financing, or rate buy-down credit?
- Built in 1958 — when were the roof, HVAC, electrical panel, plumbing, and water heater last replaced?
- What's the actual annual flood-insurance premium (NFIP or private), and is the property in a SFHA with mandatory coverage?
- Why hasn't it sold? Are there any deal-killer items the seller is aware of (foundation, flood, title, zoning, code violations)?
- Is there a deadline driving the sale (1031 exchange, divorce, estate, relocation)? That informs how much negotiation room exists.
- Crime grade is F in this area — have there been break-ins, vandalism, or insurance claims at this property in the last 3 years? What carrier currently insures it and at what premium?
- The area grade is low — what's the realistic commute time and amenity access for the typical tenant pool here? Any planned neighborhood developments (good or bad) we should know about?
- What's the average days-on-market for RENTAL listings here right now (not sales)? A rising rental-DOM trend means longer vacancies and softer asking-rent achievability than the comps imply.
- What's the recent tenant-quality profile in this submarket — average credit score on applications, eviction rate, late-payment / NSF rate, and stable-employment percentage? A property-management company in the area should have these aggregated.
- How much new for-sale + rental construction is in the pipeline within 1–3 miles? Heavy new supply typically softens prices + rents 12–24 months out; constrained supply supports both.
Investment metrics
- 1% rule
- 0.96% ✗
- Cap rate
- 6.61%
- Cash-on-cash
- 1.12%
- DSCR
- 1.05
- GRM
- 8.7
CMA / ARV
- ARV (median comp)
- $161,362
- List price
- $150,000
- Delta
- -7.04%
- Verdict
- FAIR
- Comps
- 20 within 1.0 mi
Show comp detail 12 sales within ~0.75 mi
| Address | Dist | Beds/Ba | Sqft | Sold | Price | $/sf | Match |
|---|---|---|---|---|---|---|---|
| 1002 Shephard Dr | 0.05mi | 3/1.0 | 965 (+4%) | 8mo | $89,900 | $93 | 85 |
| 1021 Burr Dr | 0.10mi | 3/1.0 | 913 (-2%) | 10mo | $179,900 | $197 | 84 |
| 5922 Lucille Dr | 0.18mi | 3/1.0 | 955 (+2%) | 8mo | $192,000 | $201 | 81 |
| 5913 Lucille Dr | 0.21mi | 3/1.0 | 963 (+3%) | 8mo | $164,900 | $171 | 78 |
| 934 Rickey Dr | 0.42mi | 3/1.0 | 966 (+4%) | 2mo | $130,000 | $135 | 73 |
| 1005 Ronald Dr | 0.19mi | 2/1.0 (-1) | 860 (-8%) | 9mo | $129,500 | $151 | 66 |
| 1206 Arnold Dr | 0.62mi | 2/1.0 (-1) | 933 (+0%) | 1mo | $132,000 | $141 | 66 |
| 5901 Norvel Dr | 0.26mi | 3/1.5 | 1,041 (+12%) | 3mo | $99,900 | $96 | 64 |
| 1214 Stratton Dr | 0.32mi | 3/2.0 | 1,007 (+8%) | 4mo | $198,000 | $197 | 64 |
| 1222 Nancy St | 0.50mi | 3/1.0 | 879 (-6%) | 7mo | $135,000 | $154 | 61 |
| 1118 Vance Dr | 0.30mi | 3/1.5 | 1,048 (+12%) | 7mo | $179,000 | $171 | 57 |
| 953 Lum Ave | 0.55mi | 2/1.0 (-1) | 888 (-5%) | 6mo | $149,900 | $169 | 56 |
Match score weights: distance 35% · size 25% · config 20% · recency 20%. Top-matched comps best support the ARV.
Projected returns pro-forma
-3.0% appreciation · 0.0% rent growth · sell at horizon
- IRR
- -21.4%
- Equity multiple
- 0.28×
- Total profit
- $-30,170
- Equity at exit
- $22,365
- IRR
- -25.9%
- Equity multiple
- -0.06×
- Total profit
- $-44,425
- Equity at exit
- $12,969
Cash invested: $42,000 (down + closing). Projections, not guarantees.
Landlord ↔ Tenant lean methodology
- Overall (STATE)
- 87 Strongly Landlord-Friendly
- State Texas
- 87 Strongly Landlord-Friendly · R+5
- County
- — inherits STATE
- City
- — inherits STATE
ZIP-level market 78412
- Rents YoY
- -1.5%
- Active inventory
- 212
- Price-to-rent
- 8.7×
Monthly cashflow live
- Estimated rent
- $1,441 high interval (Pro) →
- Mortgage (P&I)
- −$787
- Tax from tax record
- −$250 /mo · $3,003/yr
- Insurance
- −$62
- Flood insurance flood zone
- −$66 /mo · $798/yr
- HOA
- −$0
- Lot rent
- −$0
- Vacancy / Maint / Mgmt
- −$303
- Net cashflow
- $-27
Break-even live
Sensitivity live
| Price | -10% $58 | -5% $15 | +0% $-27 | +5% $-70 | +10% $-112 |
|---|---|---|---|---|---|
| Rent | -10% $-141 | -5% $-84 | +0% $-27 | +5% $30 | +10% $86 |
| Rate | -1.0pp $48 | -0.5pp $11 | base $-27 | +0.5pp $-66 | +1.0pp $-106 |
UW: 25.0% down · 7.5% · 30yr · 1.5% tax · 5.0% vac · 8.0% maint · 8.0% mgmt
Financing live
Cash to close
- Down payment
- $37,500
- Closing costs
- $4,500
- Reserves months
- —
- Total cash needed
- —
Loan-product check · same deal, 3 products live
Conventional
25% down · 7.5% · 30yr
- Down + closing
- —
- Monthly P&I
- —
- Monthly cashflow
- —
- DSCR
- —
- Eligible?
- —
Personal DTI + credit; lowest rate.
DSCR
20% down · 8.5% · 30yr
- Down + closing
- —
- Monthly P&I
- —
- Monthly cashflow
- —
- DSCR
- —
- Eligible?
- —
No personal income docs; deal must DSCR.
Hard money
10% down · 12.0% · 12mo
- Down + closing
- —
- Monthly P&I
- —
- Monthly cashflow
- —
- DSCR
- —
- Eligible?
- —
Short-term bridge; refi at stabilization.
Rent comps 18 comps
| Address | Beds | Baths | Sqft | Rent | $/sqft | DOM | Units | Dist |
|---|---|---|---|---|---|---|---|---|
| 5825 Hugo Dr Corpus Christi, TX | 3.0 | 1.0 | 970 | $1,550 | $1.60 | 16d | 1 | 0.33mi |
| 946 Lum Ave Corpus Christi, TX | 3.0 | 1.0 | 1045 | $1,300 | $1.24 | 46d | 1 | 0.51mi |
| 4848 S Alameda St Corpus Christi, TX | 2.0 | 1.0 | 1085 | $975 | $0.90 | 46d | 1 | 0.91mi |
| 5808 S Alameda St Unit 5822A Corpus Christi, TX | 2.0 | 1.0 | 931 | $1,199 | $1.29 | 23d | 1 | 0.92mi |
| 5808 S Alameda St Corpus Christi, TX | 1.0–2.0 | 1.0 | 803 | $1,199 | $1.49 | 16d | 2 | 0.92mi |
| 417 Whitehall Dr Corpus Christi, TX | 3.0 | 1.0 | 969 | $1,395 | $1.44 | 46d | 1 | 1.01mi |
| 5750 Curtis Clark Dr Corpus Christi, TX | 2.0 | 1.0–2.0 | 756 | $1,560 | $2.06 | 16d | 20 | 1.05mi |
| 2002 Airline Rd Corpus Christi, TX | 1.0–3.0 | 1.0–2.0 | 794 | $1,440 | $1.81 | 16d | 19 | 1.23mi |
| 6136 Hidden Cv Corpus Christi, TX | 2.0 | 1.5 | 1047 | $1,450 | $1.38 | 46d | 1 | 1.26mi |
| 6118 Hidden Cv Corpus Christi, TX | 2.0 | 1.0 | 991 | $1,050 | $1.06 | 46d | 1 | 1.27mi |
| 5002 Bevly Dr Unit B Corpus Christi, TX | 2.0 | 1.0 | 550 | $699 | $1.27 | 23d | 1 | 1.27mi |
| 1641 Nile Dr Corpus Christi, TX | 1.0–2.0 | 1.0–2.0 | 965 | $1,255 | $1.30 | 16d | 31 | 1.29mi |
| 2058 Hidden Lk Corpus Christi, TX | 2.0 | 1.0 | 991 | $1,200 | $1.21 | 23d | 1 | 1.30mi |
| 6620 Hardwick Dr Corpus Christi, TX | 2.0 | 1.0 | 1000 | $1,250 | $1.25 | 46d | 1 | 1.36mi |
| 2001 Woodbend Dr Corpus Christi, TX | 2.0–3.0 | 2.0 | 1267 | $2,204 | $1.74 | 16d | 17 | 1.37mi |
| 4422 S Alameda St Corpus Christi, TX | 1.0–3.0 | 1.0–2.0 | 820 | $1,000 | $1.22 | 16d | 1 | 1.37mi |
| 4657 Ocean Dr Corpus Christi, TX | 1.0–2.0 | 1.0–2.0 | 931 | $1,890 | $2.03 | 16d | 7 | 1.43mi |
| 4645 Ocean Dr Corpus Christi, TX | 2.0 | 1.0–2.0 | 760 | $1,320 | $1.74 | 16d | 1 | 1.46mi |
Listing history 25 events
-
2026-06-21days on market $150,000 Active 79 DOM
-
2026-06-18days on market $150,000 Active 76 DOM
-
2026-06-17days on market $150,000 Active 75 DOM
-
2026-06-16days on market $150,000 Active 74 DOM
-
2026-06-15days on market $150,000 Active 73 DOM
-
2026-06-14days on market $150,000 Active 71 DOM
-
2026-06-10days on market $150,000 Active 68 DOM
-
2026-06-09days on market $150,000 Active 67 DOM
-
2026-06-08days on market $150,000 Active 66 DOM
-
2026-06-07days on market $150,000 Active 65 DOM
-
2026-06-05days on market $150,000 Active 62 DOM
-
2026-06-03days on market $150,000 Active 61 DOM
-
2026-06-02days on market $150,000 Active 60 DOM
-
2026-06-01days on market $150,000 Active 59 DOM
-
2026-05-31days on market $150,000 Active 58 DOM
-
2026-05-30days on market $150,000 Active 57 DOM
-
2026-05-15price $150,000 1406-char remark
Show marketing remark (1406 chars)
Turnkey Rental Investment – Stable Cash Flow & Strong Upside in Corpus Christi! This well-maintained 3bd 1ba is a true investor’s gem in the desirable Bay Area neighborhood. The property has been occupied by the same reliable long-term tenant since 2019 — delivering consistent, worry-free income with virtually zero vacancy or turnover issues for over six years. Currently, the rent is below current market rents for 3-bedroom properties. That creates excellent upside potential for increased cash flow upon lease renewal while benefiting from an established, stable tenant. Priced for strong value and built-in equity, it’s ideal for savvy investors looking to add to their portfolio or launch their rental business with a proven performer. The home is well-maintained and turnkey — fully ready for seamless ownership transfer. Located in the convenient Bay Area neighborhood, residents enjoy easy access to Corpus Christi Bay, parks, bayside recreation, fishing, boating, shopping, and dining. This is a true turnkey investment. Perfect for experienced investors seeking stable, low-maintenance additions to their holdings or first-time landlords wanting a hassle-free entry into the Coastal Bend rental market. Secure steady income from day one. Don’t miss this opportunity — call your favorite agent today and add this Bay Area rental to your portfolio!
-
2026-04-03$160,000 Active 1406-char remark
Show marketing remark (1406 chars)
Turnkey Rental Investment – Stable Cash Flow & Strong Upside in Corpus Christi! This well-maintained 3bd 1ba is a true investor’s gem in the desirable Bay Area neighborhood. The property has been occupied by the same reliable long-term tenant since 2019 — delivering consistent, worry-free income with virtually zero vacancy or turnover issues for over six years. Currently, the rent is below current market rents for 3-bedroom properties. That creates excellent upside potential for increased cash flow upon lease renewal while benefiting from an established, stable tenant. Priced for strong value and built-in equity, it’s ideal for savvy investors looking to add to their portfolio or launch their rental business with a proven performer. The home is well-maintained and turnkey — fully ready for seamless ownership transfer. Located in the convenient Bay Area neighborhood, residents enjoy easy access to Corpus Christi Bay, parks, bayside recreation, fishing, boating, shopping, and dining. This is a true turnkey investment. Perfect for experienced investors seeking stable, low-maintenance additions to their holdings or first-time landlords wanting a hassle-free entry into the Coastal Bend rental market. Secure steady income from day one. Don’t miss this opportunity — call your favorite agent today and add this Bay Area rental to your portfolio!
-
2016-08-16historical 282-char remark
Show marketing remark (282 chars)
This is the place you've been looking for! Well maintained home in Cullen district. Laminate flooring through out the living area and bedrooms. Seller has pre-inspected home for you. This house is a notch above the rest for any investor. Home is priced to sell, a definite must see.
-
2016-08-11soldstatus Closed 282-char remark
Show marketing remark (282 chars)
This is the place you've been looking for! Well maintained home in Cullen district. Laminate flooring through out the living area and bedrooms. Seller has pre-inspected home for you. This house is a notch above the rest for any investor. Home is priced to sell, a definite must see.
-
2016-08-11soldstatus
Show marketing remark (282 chars)
This is the place you've been looking for! Well maintained home in Cullen district. Laminate flooring through out the living area and bedrooms. Seller has pre-inspected home for you. This house is a notch above the rest for any investor. Home is priced to sell, a definite must see.
-
2016-08-05status Pending 282-char remark
Show marketing remark (282 chars)
This is the place you've been looking for! Well maintained home in Cullen district. Laminate flooring through out the living area and bedrooms. Seller has pre-inspected home for you. This house is a notch above the rest for any investor. Home is priced to sell, a definite must see.
-
2016-08-01historical Option Period 282-char remark
Show marketing remark (282 chars)
This is the place you've been looking for! Well maintained home in Cullen district. Laminate flooring through out the living area and bedrooms. Seller has pre-inspected home for you. This house is a notch above the rest for any investor. Home is priced to sell, a definite must see.
-
2016-07-27$85,000 Active 282-char remark
Show marketing remark (282 chars)
This is the place you've been looking for! Well maintained home in Cullen district. Laminate flooring through out the living area and bedrooms. Seller has pre-inspected home for you. This house is a notch above the rest for any investor. Home is priced to sell, a definite must see.
-
1992-08-26soldstatus $23,000
ⓘ Source: listings_history table (triggers on properties + properties_extension) + one-shot
backfill from property_details.listing_events for pre-trigger history.
Tax reassessment forecast TX · Resets to sale price
- Current annual tax
- $3,003 · $250/mo
- Projected year-2 tax
- $3,003 · $250/mo
- Expected delta
- $0/yr ($0/mo · 0.0%)
ⓘ Screening estimate from a state-policy table — verify with the county assessor before closing.
Climate risk First Street
- Flood 7/10 Severe FEMA zone X (unshaded) · 99% chance over 30 yrs
- Wildfire 1/10 Low
- Heat 10/10 Extreme 7 d/yr ≥107°F today · 27 d/yr by 30 yrs out
- Wind 9/10 Extreme 99% chance of damaging wind over 30 yrs
- Air quality 1/10 Low 0 unhealthy d/yr today · 0 by 30 yrs out
Nearby sold comps map
Loading sold comps map…
Walkable amenities ~0.75 mi
Loading nearby amenities…
Taxation est. · year 1
- Rental income
- $17,293
- − Mortgage interest
- −$8,402
- − Property taxes
- −$3,003
- − Insurance
- −$1,547
- − Repairs & maintenance
- −$1,383
- − Management
- −$1,383
- − Depreciation
- −$4,364
- Taxable loss
- −$2,790
- Est. tax savings @ 24.0%
- +$670
- After-tax cash flow
- $341/yr
For passive investors: Depreciation is non-cash, so a rental often shows a tax loss while cash-flowing — sheltering income. Rental losses are passive: they offset passive income freely, and up to $25,000/yr can offset ordinary (W-2) income if you actively participate and your MAGI is under $100k (phasing out to $0 by $150k); unused losses carry forward. On sale, claimed depreciation is recaptured at up to 25%, and gains may owe capital-gains tax (a 1031 exchange can defer both). Figures are a year-1 estimate at your 24.0% rate — not tax advice; consult a CPA.
Schools (NCES district)
- District
- Corpus Christi ISD
- NCES district ID
- 4815270
- Math proficiency
- 31% ▼ -18.00%
- Reading proficiency
- 35% ▼ -7.00%
- Median HH income
- $45,672
- Composite
- 28.27/100
- National rank
- #6793
- State rank
- #562 of 826 in TX
Livability — Corpus Christi
- Score
- 78/100
- State rank
- #66
- US rank
- #2404
Category grades
Schools grade is shown separately in the Schools card above.
Census & demographics
- Census place
- Corpus Christi, TX
- County
- Nueces County · 296,836 people
- City population
- 296,836
- Metro
- Corpus Christi, TX
- Population (ZIP)
- 38,631
- Household income
- $61,215
- Rent vs Own
- Severe rent burden
- 1932.0
Population outlook (Nueces County) Hauer SSP2
- Today (2025)
- 418,037 people
- By 2030
- 447,123 · +7.0%
- By 2040
- 505,911 · +21.0%
- By 2050
- 567,522 · +35.8%
- By 2075
- 729,686 · +74.6%
- By 2100
- 847,087 · +102.6%
Race, ethnicity, and origin ACS 2023
- Neighborhood character
- Diverse neighborhood (Simpson 0.56)
- Race & ethnicity
- Hispanic / Latino 57% White 34% Two or more races 29% Asian 4% Black 3%
- Hispanic origin (detail)
- Mexican 52%
- Common ancestry
- Slovak 2% Romanian 1% Lithuanian 1%
- Foreign-born
- 8% · Canada, China, Vietnam
- Languages at home
- 74% English-only · Spanish 22% Other Indo-European 1% Vietnamese 1%
Political lean MEDSL · Nueces
- 2024 margin
- R (+11.5) · D 43.8% · R 55.3%
- 2008→2024 swing
- -7.1pp toward R · 2008: -4.4pp · 2024: -11.5pp
- All cycles
- 2024: R+11.5 2020: R+2.9 2016: R+1.5 2012: R+3.2 2008: R+4.4
Not yet ingested
- Civics
- —
Market trends
- HPI YoY
- ▼ -255.29%
- Current HPI
- 177.36
- Rent YoY
- ▼ -1.53%
- Metro
- Corpus Christi, TX
- State GDP YoY
- ▲ 3.95%
- F500 in state
- 110
Industry mix (Fortune 500 HQ in TX)
| Industry | F500 HQs | Revenue |
|---|---|---|
| Energy | 16 | $1,198B |
|
||
| Technology | 5 | $198B |
|
||
| Engineering / Construction | 4 | $72B |
|
||
| Energy Services | 3 | $60B |
|
||
| Utilities | 3 | $41B |
|
||
| Healthcare | 2 | $330B |
|
||
Price history
+552.2% since first listed9 events — show timeline
- 2026-05-15 Price Changed $150,000 CBMLS
- 2026-04-03 Listed $160,000 CBMLS
- 2016-08-16 Delisted — CBMLS
- 2016-08-11 Sold (Public Records) — Public Records
- 2016-08-11 Sold (MLS) — CBMLS
- 2016-08-05 Pending — CBMLS
- 2016-08-01 Contingent — CBMLS
- 2016-07-27 Listed $85,000 CBMLS
- 1992-08-26 Sold (Public Records) $23,000 Public Records
Property tax history
+4.7%/yrLatest (2025): $3,003 · +1.3% YoY. Source: county tax records.
Cash-flow waterfall
monthlySold comps — $/sqft
last 12 mo · ≤1 miLoading sold comps…