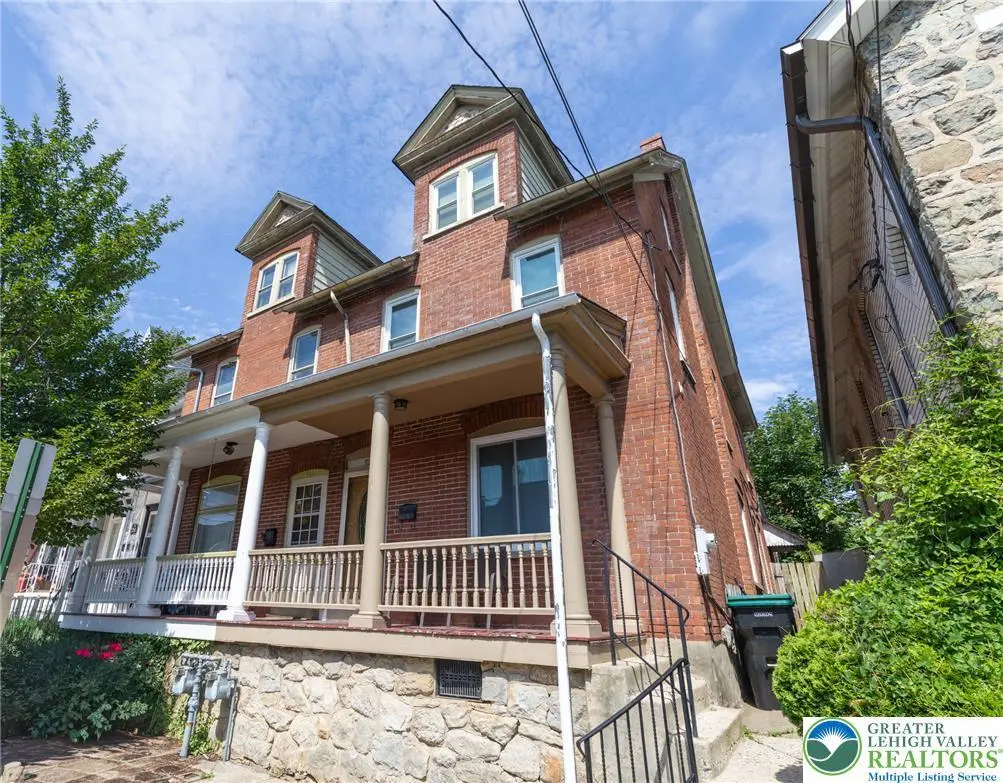
722 Pawnee St · Bethlehem, PA
Flood risk 1/10 · Minimal
- FEMA flood zone
- X (unshaded)
- Chance of flooding over 30 yrs
- 0.0%
- Est. flood insurance / yr
- $473 – $860
Fire risk 5/10 · Moderate
- Est. fire insurance / yr
- $511 – $949
Heat risk 5/10 · Moderate
- Hot days now (above 100°F)
- 7 days/yr
- Hot days in 30 yrs
- 16 days/yr
Wind risk 4/10 · Minor
- Chance of severe wind over 30 yrs
- 19.0%
Air-quality risk 4/10 · Minor
- Unhealthy air days now
- 3 days/yr
- Unhealthy air days in 30 yrs
- 6 days/yr
Risk factors via First Street. Map © Google.
Why this score? — see what drove the D+ grade
The composite is a weighted blend of 9 inputs, each scored 0–100. Each bar is that input's sub-score; the figure is the points it added to the 100-point composite (weight × sub-score).
- Cash flow +13.4/30.0
- ARV discount +12.3/15.0
- Rent growth +4.3/5.0
- Livability +4.1/5.0
- DSCR +4.0/10.0
- 1% rule +3.5/10.0
- Schools +3.5/10.0
- Condition / age +2.5/5.0
- Appreciation +0.0/10.0
$250,000
🖨 Deal sheet 📄 Offer letter ✓ Due diligence
Listing remarks
Highest and best by Sunday 6/14 at 9pm. Welcome to this charming and move-in-ready 3-bedroom, 2-bathroom home located in the heart of South Bethlehem! From the moment you step inside, you'll appreciate the clean, well-maintained interior and the beautiful vinyl flooring that flows throughout the main level, offering both style and durability. The functional layout provides comfortable living spaces perfect for everyday life, entertaining guests, or simply relaxing at home. Whether you're a first-time homebuyer, or searching for an investment opportunity, this property offers endless potential. Conveniently situated just minutes from South Bethlehem's popular restaurants, shops, parks, and e
Key facts
- Vinyl flooring
- Functional layout
- Convenient location
Tags
Property features AI
Exterior
- Parking: Off-street parking; On-street parking
- Utilities: Public water; Public sewer; Gas water heater
- Home design: 3 stories; Brick construction; Asphalt/fiberglass roof; Basement foundation; Zoned 04RM
- Construction: Built with brick; Asphalt and fiberglass roofing; Basement foundation
- Exterior features: Public water; Public sewer; Lot approximately 0.046 acres
Interior
- Kitchen: Refrigerator
- Bedrooms: 6 total rooms (includes bedrooms and living spaces)
- Flooring: Vinyl
- Bathrooms: 2 full bathrooms
- Heating & cooling: Gas heating
- Interior features: Dining area; Separate/formal dining room; Concrete basement
- Laundry & utility: Washer; Dryer; Gas water heater
Neighborhood map
What this means for you Summary
Snapshot
- This is a 3-bed/1.0-bath townhouse listed at $250k.
Deal economics
- At list price, monthly cash flow is $5 ($58/yr) — positive.
- The deal already cash-flows at list — no discount required.
- To meet the 1% rule (rent ≥ 1% of price), the offer needs to be $212k (15.3% below list).
- Recommended offer: $212k (15.3% below list) — sets the bar for 1% rule.
- Cap rate 6.3% vs local median 4.3% in Bethlehem — top-decile yield for the area; either an underpriced asset or a hidden risk that comps aren't pricing in. Stress-test before assuming the spread holds.
Location & tenants
- Location reads 82/100 on livability (#138 in PA, #1,122 nationally) — a professional / high-income tenant draw. Strengths: amenities A+, cost of living A+, housing A+; Watch: commute F.
- Bethlehem Area SD (urban): math 31% / reading 49% proficiency, ranked #342 of 539 in PA (top 64%) — families likely to look elsewhere, expect single-tenant / working-renter base with shorter leases.
- Market conditions: Rents rising fast (+7.2%/yr); 156 active listings in the ZIP; 28 comparable units currently listed for rent nearby; rentals at typical pace (median 21d on market — plan ~3-4 weeks tenant-placement turnaround); 567 units permitted in Northampton County in 2024 (151 in 5+ unit buildings).
- This rent runs 42% of the median local income ($61k/yr) — at the standard rent-burdened threshold; future hikes will face affordability resistance.
Forward outlook
- Local home prices are declining (-3.0%/yr); year-one equity from $2k of loan paydown is wiped out by about $8k of value loss. Plan a longer hold.
Negotiation context
- Only 3 days on market — expect competitive offers; lowballing is unlikely to land.
- Current owner paid $62k; list at $250k implies a 302% gain — meaningful room to come down on a strong offer.
Risks & watch-outs
- Watch-outs: built in 1900 — expect roof / HVAC / electrical / plumbing capex.
- Climate carrying-cost: moderate wildfire risk; extreme-heat days projected 7→16/yr by 2055 (HVAC capex compounding) — expect insurance premiums to compound above CPI over the hold.
Questions for the listing agent
- Built in 1900 — when were the roof, HVAC, electrical panel, plumbing, and water heater last replaced?
- Is there a deadline driving the sale (1031 exchange, divorce, estate, relocation)? That informs how much negotiation room exists.
- Schools are B-rated — typically a magnet for longer-tenancy family renters. What's the average tenant stay here, and is there a school-zone premium baked into asking?
- The area grade is low — what's the realistic commute time and amenity access for the typical tenant pool here? Any planned neighborhood developments (good or bad) we should know about?
- What's the average days-on-market for RENTAL listings here right now (not sales)? A rising rental-DOM trend means longer vacancies and softer asking-rent achievability than the comps imply.
- What's the recent tenant-quality profile in this submarket — average credit score on applications, eviction rate, late-payment / NSF rate, and stable-employment percentage? A property-management company in the area should have these aggregated.
- How much new for-sale + rental construction is in the pipeline within 1–3 miles? Heavy new supply typically softens prices + rents 12–24 months out; constrained supply supports both.
Investment metrics
- 1% rule
- 0.85% ✗
- Cap rate
- 6.32%
- Cash-on-cash
- 0.08%
- DSCR
- 1.00
- GRM
- 9.8
CMA / ARV
- ARV (on-the-fly)
- $279,888
- Comps found
- 12
Show comp detail 12 sales within ~0.75 mi
| Address | Dist | Beds/Ba | Sqft | Sold | Price | $/sf | Match |
|---|---|---|---|---|---|---|---|
| 716 Itaska St | 0.14mi | 4/1.0 (+1) | 1,639 (-2%) | 0mo | $285,000 | $174 | 85 |
| 436 Pawnee St | 0.20mi | 3/2.0 | 1,744 (+5%) | 2mo | $191,000 | $110 | 77 |
| 616 Christian St | 0.27mi | 4/1.5 (+1) | 1,668 (+0%) | 5mo | $255,000 | $153 | 76 |
| 445 Montclair Ave | 0.32mi | 4/1.0 (+1) | 1,692 (+2%) | 4mo | $311,000 | $184 | 75 |
| 707 Fiot Ave | 0.26mi | 3/2.0 | 1,556 (-7%) | 2mo | $285,000 | $183 | 71 |
| 1050 Delaware Ave | 0.43mi | 3/1.0 | 1,575 (-6%) | 2mo | $265,000 | $168 | 69 |
| 1012 Seneca St | 0.34mi | 3/1.0 | 1,512 (-9%) | 0mo | $255,000 | $169 | 68 |
| 1054 Jeter Ave | 0.51mi | 4/1.5 (+1) | 1,680 (+1%) | 4mo | $260,000 | $155 | 64 |
| 1114 Russell Ave | 0.54mi | 4/1.0 (+1) | 1,600 (-4%) | 1mo | $255,000 | $159 | 62 |
| 1212 Graham St | 0.67mi | 3/1.5 | 1,616 (-3%) | 4mo | $290,000 | $179 | 58 |
| 1019 Delaware Ave | 0.39mi | 4/2.5 (+1) | 1,760 (+6%) | 4mo | $265,000 | $151 | 58 |
| 1014 Jeter Ave | 0.45mi | 4/1.0 (+1) | 1,500 (-10%) | 2mo | $250,000 | $167 | 56 |
Match score weights: distance 35% · size 25% · config 20% · recency 20%. Top-matched comps best support the ARV.
Projected returns pro-forma
-3.0% appreciation · 7.18% rent growth · sell at horizon
- IRR
- -11.7%
- Equity multiple
- 0.56×
- Total profit
- $-30,928
- Equity at exit
- $37,276
- IRR
- 2.5%
- Equity multiple
- 1.21×
- Total profit
- $14,957
- Equity at exit
- $21,615
Cash invested: $70,000 (down + closing). Projections, not guarantees.
Landlord ↔ Tenant lean methodology
- Overall (STATE)
- 62 Landlord-Friendly
- State Pennsylvania
- 62 Landlord-Friendly · EVEN
- County
- — inherits STATE
- City
- — inherits STATE
ZIP-level market 18015
- Home prices YoY
- -30.7%
- Rents YoY
- 7.2%
- Active inventory
- 156
- Price-to-rent
- 9.8×
Monthly cashflow live
- Estimated rent
- $2,117 high interval (Pro) →
- Mortgage (P&I)
- −$1,311
- Tax from tax record
- −$253 /mo · $3,033/yr
- Insurance
- −$104
- HOA
- −$0
- Vacancy / Maint / Mgmt
- −$445
- Net cashflow
- $5
Break-even live
UW: 25.0% down · 7.5% · 30yr · 1.5% tax · 5.0% vac · 8.0% maint · 8.0% mgmt
Financing live
Cash to close
- Down payment
- $62,500
- Closing costs
- $7,500
- Reserves months
- —
- Total cash needed
- —
Loan-product check · same deal, 3 products live
Conventional
25% down · 7.5% · 30yr
- Down + closing
- —
- Monthly P&I
- —
- Monthly cashflow
- —
- DSCR
- —
- Eligible?
- —
Personal DTI + credit; lowest rate.
DSCR
20% down · 8.5% · 30yr
- Down + closing
- —
- Monthly P&I
- —
- Monthly cashflow
- —
- DSCR
- —
- Eligible?
- —
No personal income docs; deal must DSCR.
Hard money
10% down · 12.0% · 12mo
- Down + closing
- —
- Monthly P&I
- —
- Monthly cashflow
- —
- DSCR
- —
- Eligible?
- —
Short-term bridge; refi at stabilization.
Rent comps 28 comps
| Address | Beds | Baths | Sqft | Rent | $/sqft | DOM | Units | Dist |
|---|---|---|---|---|---|---|---|---|
| 541 Jischke St Bethlehem, PA | 3.0 | 1.0 | 1090 | $1,800 | $1.65 | 23d | 1 | 0.07mi |
| 708 Cherokee St Bethlehem, PA | 3.0 | 1.5 | 1200 | $2,500 | $2.08 | 43d | 1 | 0.09mi |
| 521 Hess St Bethlehem, PA | 3.0 | 1.0 | 1120 | $1,500 | $1.34 | 21d | 1 | 0.18mi |
| 517 Seneca St Unit 1 Bethlehem, PA | 2.0 | 1.5 | 1500 | $2,200 | $1.47 | 43d | 1 | 0.18mi |
| 406 W 9th St Bethlehem, PA | 3.0 | 1.0 | 1152 | $2,100 | $1.82 | 21d | 1 | 0.32mi |
| 14 Finady Ave Bethlehem, PA | 3.0 | 1.5 | 1500 | $1,600 | $1.07 | 21d | 1 | 0.35mi |
| 1129 Russell Ave Fountain Hill, PA | 3.0 | 1.0 | 1376 | $1,900 | $1.38 | 43d | 1 | 0.60mi |
| 1129 Russell Ave Fountain Hill, PA | 3.0 | 1.0 | 1376 | $1,750 | $1.27 | 23d | 1 | 0.60mi |
| 1217 Broadway Unit 2 Fountain Hill, PA | 2.0 | 1.0 | 1340 | $1,550 | $1.16 | 23d | 1 | 0.60mi |
| 11 W 2nd St Bethlehem, PA | 2.0 | 2.0 | 1620 | $2,550 | $1.57 | 23d | 4 | 0.64mi |
| 311 E 3rd St Bethlehem, PA | 2.0 | 2.0 | 1189 | $2,330 | $1.96 | 2d | 3 | 0.80mi |
| 436 Pierce St Bethlehem, PA | 4.0 | 2.0 | 1452 | $2,250 | $1.55 | 2d | 1 | 0.93mi |
| 612 E 5th St Bethlehem, PA | 4.0 | 2.0 | 1814 | $2,500 | $1.38 | 43d | 1 | 0.96mi |
| 610 E 3rd St Bethlehem, PA | 1.0–2.0 | 1.0–2.0 | 974 | $3,008 | $3.09 | 2d | 8 | 1.01mi |
| 517 Schaffer St Bethlehem, PA | 2.0 | 1.0 | 1200 | $1,900 | $1.58 | 2d | 1 | 1.03mi |
| 42 E Wall St Bethlehem, PA | 4.0 | 1.0 | 1474 | $2,550 | $1.73 | 23d | 1 | 1.04mi |
| 30 E Market St Apt 1 Bethlehem, PA | 2.0 | 1.0 | 1200 | $1,950 | $1.62 | 43d | 1 | 1.09mi |
| 239 E Church St Bethlehem, PA | 3.0 | 2.5 | 1724 | $2,950 | $1.71 | 23d | 1 | 1.18mi |
| 56 W North St Bethlehem, PA | 2.0 | 2.0 | 1486 | $2,400 | $1.62 | 14d | 1 | 1.22mi |
| 417 Linden St Bethlehem, PA | 3.0 | 1.5 | 1699 | $2,450 | $1.44 | 2d | 1 | 1.23mi |
| 314 State St Bethlehem, PA | 4.0 | 2.0 | 1654 | $2,650 | $1.60 | 14d | 1 | 1.28mi |
| 520 W Union Blvd Unit 2 Bethlehem, PA | 3.0 | 1.0 | 2225 | $2,150 | $0.97 | 23d | 1 | 1.28mi |
| 1718 Calypso Ave Bethlehem, PA | 4.0 | 1.5 | 1912 | $2,700 | $1.41 | 43d | 1 | 1.29mi |
| 68 W Union Blvd Bethlehem, PA | 4.0 | 1.5 | 1804 | $2,295 | $1.27 | 14d | 1 | 1.32mi |
| 47 W Goepp St Bethlehem, PA | 3.0 | 1.5 | 1184 | $1,995 | $1.68 | 2d | 1 | 1.38mi |
| 1122 E 4th St Bethlehem, PA | 4.0 | 1.0 | 1706 | $1,800 | $1.06 | 14d | 1 | 1.39mi |
| 69 E Goepp St Bethlehem, PA | 3.0 | 1.0 | 1100 | $2,150 | $1.95 | 2d | 1 | 1.48mi |
| 122 E Goepp St Unit 1 Bethlehem, PA | 3.0 | 1.0 | 1137 | $1,895 | $1.67 | 2d | 1 | 1.49mi |
Listing history 4 events
-
2026-06-15status $250,000 Pending 3 DOM
-
2026-06-15days on market $250,000 Active 3 DOM
-
2026-06-14remarks 699-char remark
-
2026-06-14$250,000 Active 1 DOM
ⓘ Source: listings_history table (triggers on properties + properties_extension) + one-shot
backfill from property_details.listing_events for pre-trigger history.
Tax reassessment forecast PA · Partial reset (capped growth)
- Current annual tax
- $3,033 · $253/mo
- Projected year-2 tax
- $3,491 · $291/mo
- Expected delta
- +$459/yr (+$38/mo · 15.1%)
ⓘ Screening estimate from a state-policy table — verify with the county assessor before closing.
Climate risk First Street
- Flood 1/10 Low FEMA zone X (unshaded) · 0% chance over 30 yrs
- Wildfire 5/10 Major
- Heat 5/10 Major 7 d/yr ≥100°F today · 16 d/yr by 30 yrs out
- Wind 4/10 Moderate 19% chance of damaging wind over 30 yrs
- Air quality 4/10 Moderate 3 unhealthy d/yr today · 6 by 30 yrs out
Nearby sold comps map
Loading sold comps map…
Walkable amenities ~0.75 mi
Loading nearby amenities…
Taxation est. · year 1
- Rental income
- $25,409
- − Mortgage interest
- −$14,004
- − Property taxes
- −$3,033
- − Insurance
- −$1,250
- − Repairs & maintenance
- −$2,033
- − Management
- −$2,033
- − Depreciation
- −$7,273
- Taxable loss
- −$4,216
- Est. tax savings @ 24.0%
- +$1,012
- After-tax cash flow
- $1,070/yr
For passive investors: Depreciation is non-cash, so a rental often shows a tax loss while cash-flowing — sheltering income. Rental losses are passive: they offset passive income freely, and up to $25,000/yr can offset ordinary (W-2) income if you actively participate and your MAGI is under $100k (phasing out to $0 by $150k); unused losses carry forward. On sale, claimed depreciation is recaptured at up to 25%, and gains may owe capital-gains tax (a 1031 exchange can defer both). Figures are a year-1 estimate at your 24.0% rate — not tax advice; consult a CPA.
Schools (NCES district)
- District
- Bethlehem Area SD
- NCES district ID
- 4203570
- Math proficiency
- 31% ▼ -2.00%
- Reading proficiency
- 49% ▼ -6.00%
- Median HH income
- $55,124
- Composite
- 34.92/100
- National rank
- #5068
- State rank
- #342 of 539 in PA
Livability — Bethlehem
- Score
- 82/100
- State rank
- #138
- US rank
- #1122
Category grades
Schools grade is shown separately in the Schools card above.
Census & demographics
- Census place
- Bethlehem, PA
- County
- Northampton County · 236,814 people
- City population
- 129,661
- Metro
- Allentown-Bethlehem-Easton, PA-NJ
- Population (ZIP)
- 34,852
- Household income
- $60,800
- Rent vs Own
- Severe rent burden
- 1525.0
Population outlook (Northampton County) Hauer SSP2
- Today (2025)
- 312,227 people
- By 2030
- 314,769 · +0.8%
- By 2040
- 316,914 · +1.5%
- By 2050
- 318,037 · +1.9%
- By 2075
- 334,003 · +7.0%
- By 2100
- 344,696 · +10.4%
Race, ethnicity, and origin ACS 2023
- Neighborhood character
- Diverse neighborhood (Simpson 0.62)
- Race & ethnicity
- White 53% Hispanic / Latino 29% Two or more races 14% Black 10% Asian 5%
- Hispanic origin (detail)
- Mexican 2% Puerto Rican 19% Dominican 3%
- Common ancestry
- Romanian 4% Danish 1% Iranian 1%
- Foreign-born
- 12% · Canada, China, Jamaica
- Languages at home
- 73% English-only · Spanish 21% Chinese 2% Other Indo-European 2%
Political lean MEDSL · Northampton
- 2024 margin
- Toss-up / Even · D 48.6% · R 50.4%
- 2008→2024 swing
- -14.1pp toward R · 2008: 12.3pp · 2024: -1.8pp
- All cycles
- 2024: R+1.8 2020: D+0.7 2016: R+3.8 2012: D+4.6 2008: D+12.3
Not yet ingested
- Civics
- —
Market trends
- HPI YoY
- ▼ -122.95%
- Current HPI
- 277.4721
- Rent YoY
- ▲ 7.18%
- Metro
- Allentown-Bethlehem-Easton, PA-NJ
- State GDP YoY
- ▲ 1.68%
- F500 in state
- 34
Industry mix (Fortune 500 HQ in PA)
| Industry | F500 HQs | Revenue |
|---|---|---|
| Healthcare | 2 | $309B |
|
||
| Insurance | 2 | $27B |
|
||
| Telecommunications / Media | 1 | $124B |
|
||
| Industrial Distribution | 1 | $22B |
|
||
| Financial Services | 1 | $20B |
|
||
| Chemicals / Materials | 1 | $18B |
|
||
Price history
+681.2% since first listed3 events — show timeline
- 2026-06-12 Listed $250,000 GLVRMLS
- 2003-08-06 Sold (Public Records) $62,250 Public Records
- 1986-06-01 Sold (Public Records) $32,000 Public Records
Property tax history
+1.5%/yrLatest (2026): $3,033 · +3.5% YoY. Source: county tax records.
Cash-flow waterfall
monthlySold comps — $/sqft
last 12 mo · ≤1 miLoading sold comps…