13201 Court Ridge Rd · Brandermill, VA
Flood risk 1/10 · Minimal
- FEMA flood zone
- X (unshaded)
- Chance of flooding over 30 yrs
- 0.0%
- Est. flood insurance / yr
- $507 – $1,088
Fire risk 1/10 · Minimal
- Est. fire insurance / yr
- $666 – $1,236
Heat risk 6/10 · Moderate
- Hot days now (above 105°F)
- 7 days/yr
- Hot days in 30 yrs
- 15 days/yr
Wind risk 5/10 · Moderate
- Chance of severe wind over 30 yrs
- 25.0%
Air-quality risk 2/10 · Minimal
- Unhealthy air days now
- 0 days/yr
- Unhealthy air days in 30 yrs
- 1 days/yr
Risk factors via First Street. Map © Google.
Why this score? — see what drove the B- grade
The composite is a weighted blend of 9 inputs, each scored 0–100. Each bar is that input's sub-score; the figure is the points it added to the 100-point composite (weight × sub-score).
- Cash flow +23.2/30.0
- ARV discount +15.0/15.0
- 1% rule +7.6/10.0
- DSCR +7.5/10.0
- Schools +5.2/10.0
- Livability +3.9/5.0
- Rent growth +3.1/5.0
- Condition / age +2.5/5.0
- Appreciation +0.0/10.0
$185,000
🖨 Deal sheet (PDF) 📄 Offer letter ✓ Due diligence
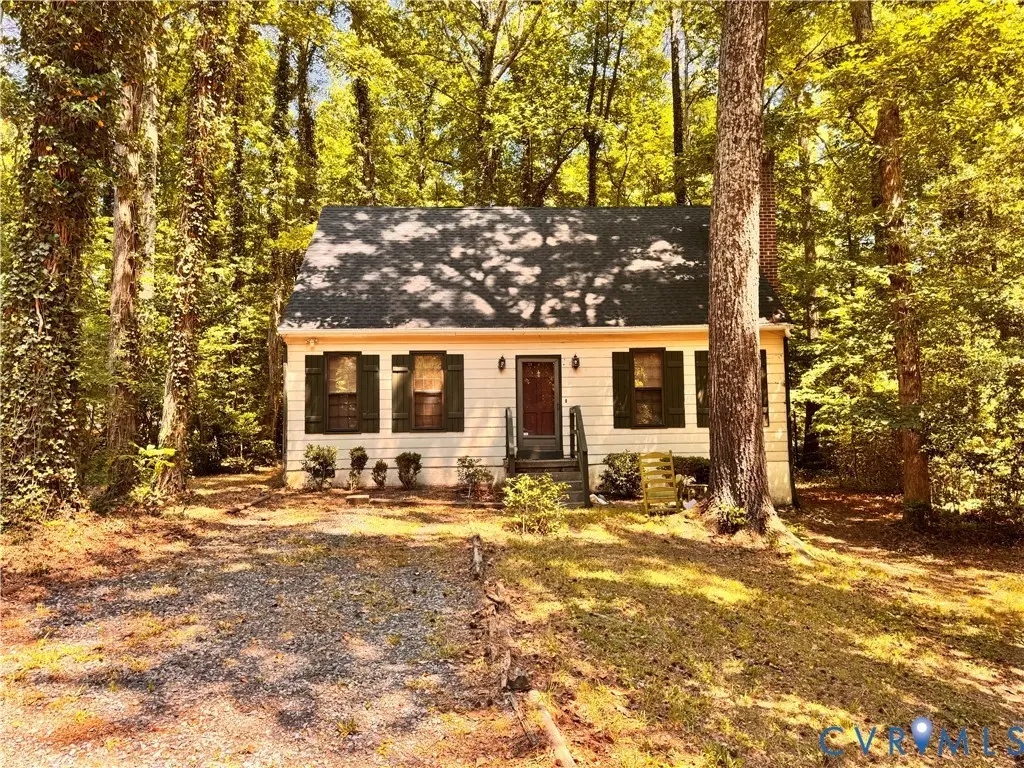
Listing remarks
This 1.5 story home offers approximately 1.508 square feet of living space with hardwood flooring, heat pump heating/cooling, wood siding exterior, composition shingle roof, and spacious wood deck for entertaining. Situated on approximately 0.22 acres in Midlothian with convenient access to shopping, dining, schools and commuter routes. Excellent investment opportunity in Chesterfield County! Property is currently owner occupied. Drive-by-showings only at this time. No interior access or showings permitted. Listing agent has not been inside the property
Key facts
- Hardwood flooring
- Wood siding exterior
- Spacious wood deck
Tags
Property features AI
Finance
- HOA & community: Homeowners association with monthly fee; HOA fee covers common areas, pool(s), and water access
Exterior
- Utilities: Public water; Public sewer
- Home design: 2-story home; Entry level is main level; Resale property
- Construction: Frame construction with wood siding; Composition roof
- Exterior features: Community pool access
Interior
- Bedrooms: Bedrooms located on first and second levels
- Bathrooms: 2 full bathrooms; Full bathrooms with tub and shower
- Heating & cooling: Heat pump heating; Electric heating; Heat pump cooling
- Interior features: Wood-burning fireplace
Neighborhood map
What this means for you Summary
Snapshot
- This is a 3-bed/2.0-bath single-family listed at $185k.
Deal economics
- At list price, monthly cash flow is $337 ($4k/yr) — positive.
- The deal already cash-flows at list — no discount required.
- Meets the 1% rule at list price ($2k rent vs $185k).
- Cap rate 8.5% vs local median 3.7% in Brandermill — top-decile yield for the area; either an underpriced asset or a hidden risk that comps aren't pricing in. Stress-test before assuming the spread holds.
Location & tenants
- Location reads 77/100 on livability (#94 in VA, #3,055 nationally) — a middle-class / working-renter tenant base. Strengths: employment A+, housing A+, crime A-; Watch: amenities F, commute F.
- Chesterfield County Public School District (suburban): math 52% / reading 64% proficiency, ranked #57 of 131 in VA (top 44%) — acceptable for families but not a draw, mixed tenant base, ~2y average lease.
- Zoned schools: Clover Hill Elementary (math 57% / reading 69%, grade B, #470 of 1,108 statewide, top 43%, 842 students, 33% FRL); Swift Creek Middle (math 63% / reading 63%, grade B+, #134 of 342 statewide, top 40%, 1,115 students, 28% FRL); Clover Hill High (math 60% / reading 89%, grade B+, #107 of 319 statewide, top 37%, 1,775 students, 31% FRL) — zoned schools at 31% FRL track the district average.
- Market conditions: Rents rising (+2.3%/yr); 495 active listings in the ZIP; 15 comparable units currently listed for rent nearby; rentals leasing fast (median 6d on market — plan ~1-2 weeks tenant-placement turnaround); high-income renter base; 2,307 units permitted in Chesterfield County in 2024 (462 in 5+ unit buildings).
Forward outlook
- Local home prices are declining (-3.0%/yr); year-one equity from $1k of loan paydown is wiped out by about $6k of value loss. Plan a longer hold.
- Chesterfield County population projected at +20% by 2050 — long-run rental-demand tailwind backs the buy-and-hold thesis.
Negotiation context
- Only 11 days on market — expect competitive offers; lowballing is unlikely to land.
- Current owner paid $88k; list at $185k implies a 110% gain — meaningful room to come down on a strong offer.
Risks & watch-outs
- Climate carrying-cost: moderate wind risk, 25% chance of damaging wind over 30y; extreme-heat days projected 7→15/yr by 2055 (HVAC capex compounding) — expect insurance premiums to compound above CPI over the hold.
Questions for the listing agent
- Built in 1977 — when were the roof, HVAC, electrical panel, plumbing, and water heater last replaced?
- What does the HOA fee cover, when was the last increase, and are there any pending special assessments or reserve-fund shortfalls?
- Is there a deadline driving the sale (1031 exchange, divorce, estate, relocation)? That informs how much negotiation room exists.
- Schools are A-rated — typically a magnet for longer-tenancy family renters. What's the average tenant stay here, and is there a school-zone premium baked into asking?
- What's the average days-on-market for RENTAL listings here right now (not sales)? A rising rental-DOM trend means longer vacancies and softer asking-rent achievability than the comps imply.
- What's the recent tenant-quality profile in this submarket — average credit score on applications, eviction rate, late-payment / NSF rate, and stable-employment percentage? A property-management company in the area should have these aggregated.
- How much new for-sale + rental construction is in the pipeline within 1–3 miles? Heavy new supply typically softens prices + rents 12–24 months out; constrained supply supports both.
Investment metrics
- 1% rule
- 1.26% ✓
- Cap rate
- 8.48%
- Cash-on-cash
- 7.80%
- DSCR
- 1.35
- GRM
- 6.6
CMA / ARV
- ARV (on-the-fly)
- $333,268
- Comps found
- 12
Show comp detail 12 sales within ~0.75 mi
| Address | Dist | Beds/Ba | Sqft | Sold | Price | $/sf | Match |
|---|---|---|---|---|---|---|---|
| 13207 Court Ridge Rd | 0.03mi | 4/2.0 (+1) | 1,508 (0%) | 2mo | $365,000 | $242 | 92 |
| 13300 Court Ridge Rd | 0.12mi | 3/1.5 | 1,546 (+2%) | 5mo | $339,950 | $220 | 84 |
| 13313 Farm Crest Ct | 0.19mi | 3/2.0 | 1,568 (+4%) | 1mo | $271,000 | $173 | 84 |
| 13217 Court Ridge Rd | 0.11mi | 3/2.5 | 1,586 (+5%) | 4mo | $359,000 | $226 | 81 |
| 13207 Gate Post Ct | 0.10mi | 3/2.5 | 1,568 (+4%) | 7mo | $250,000 | $159 | 81 |
| 4902 Court Ridge Ter | 0.16mi | 3/2.5 | 1,586 (+5%) | 3mo | $360,000 | $227 | 79 |
| 4602 Painted Post Ln | 0.28mi | 3/1.5 | 1,520 (+1%) | 7mo | $322,500 | $212 | 78 |
| 4500 Old Well Ter | 0.35mi | 3/2.5 | 1,538 (+2%) | 2mo | $369,900 | $241 | 77 |
| 13201 Thornridge Ln | 0.07mi | 3/3.0 | 1,600 (+6%) | 18mo | $347,000 | $217 | 67 |
| 4609 Peppercorn Pl | 0.21mi | 3/2.5 | 1,568 (+4%) | 19mo | $344,000 | $219 | 66 |
| 13006 Tall Hickory Ct | 0.50mi | 3/2.0 | 1,584 (+5%) | 8mo | $349,950 | $221 | 61 |
| 13604 Northwich Ter | 0.69mi | 2/2.0 (-1) | 1,402 (-7%) | 1mo | $430,000 | $307 | 50 |
Match score weights: distance 35% · size 25% · config 20% · recency 20%. Top-matched comps best support the ARV.
Projected returns pro-forma
-3.0% appreciation · 2.29% rent growth · sell at horizon
- IRR
- -5.2%
- Equity multiple
- 0.81×
- Total profit
- $-10,021
- Equity at exit
- $27,584
- IRR
- 3.6%
- Equity multiple
- 1.25×
- Total profit
- $12,893
- Equity at exit
- $15,995
Cash invested: $51,800 (down + closing). Projections, not guarantees.
Landlord ↔ Tenant lean methodology
- Overall (STATE)
- 55 Moderately Landlord-Leaning
- State Virginia
- 55 Moderately Landlord-Leaning · D+2
- County
- — inherits STATE
- City
- — inherits STATE
ZIP-level market 23112
- Rents YoY
- 2.3%
- Active inventory
- 495
- Price-to-rent
- 6.6×
Monthly cashflow live
- Estimated rent
- $2,335 high interval (Pro) →
- Mortgage (P&I)
- −$970
- Tax from tax record
- −$223 /mo · $2,671/yr
- Insurance
- −$77
- HOA
- −$238
- Vacancy / Maint / Mgmt
- −$490
- Net cashflow
- $337
Break-even live
Sensitivity live
| Price | -10% $441 | -5% $389 | +0% $337 | +5% $284 | +10% $232 |
|---|---|---|---|---|---|
| Rent | -10% $152 | -5% $244 | +0% $337 | +5% $429 | +10% $521 |
| Rate | -1.0pp $430 | -0.5pp $384 | base $337 | +0.5pp $289 | +1.0pp $240 |
UW: 25.0% down · 7.5% · 30yr · 1.5% tax · 5.0% vac · 8.0% maint · 8.0% mgmt
Financing live
Cash to close
- Down payment
- $46,250
- Closing costs
- $5,550
- Reserves months
- —
- Total cash needed
- —
Loan-product check · same deal, 3 products live
Conventional
25% down · 7.5% · 30yr
- Down + closing
- —
- Monthly P&I
- —
- Monthly cashflow
- —
- DSCR
- —
- Eligible?
- —
Personal DTI + credit; lowest rate.
DSCR
20% down · 8.5% · 30yr
- Down + closing
- —
- Monthly P&I
- —
- Monthly cashflow
- —
- DSCR
- —
- Eligible?
- —
No personal income docs; deal must DSCR.
Hard money
10% down · 12.0% · 12mo
- Down + closing
- —
- Monthly P&I
- —
- Monthly cashflow
- —
- DSCR
- —
- Eligible?
- —
Short-term bridge; refi at stabilization.
Rent comps 15 comps
| Address | Beds | Baths | Sqft | Rent | $/sqft | DOM | Units | Dist |
|---|---|---|---|---|---|---|---|---|
| 4905 Long Shadow Dr Midlothian, VA | 2.0 | 2.5 | 1346 | $2,095 | $1.56 | 22d | 1 | 0.23mi |
| 5200 Hunt Master Dr Midlothian, VA | 1.0–3.0 | 1.0–2.0 | 875 | $2,199 | $2.51 | 0d | 26 | 0.27mi |
| 4821 Cloverleigh Dr Midlothian, VA | 3.0 | 2.5 | 1599 | $2,600 | $1.63 | 5d | 1 | 0.48mi |
| 13364 Diamond Ridge Dr Midlothian, VA | 3.0 | 2.5 | 2012 | $2,500 | $1.24 | 5d | 1 | 0.57mi |
| 6050 Harbour Green Dr Midlothian, VA | 1.0–2.0 | 1.0–2.0 | 950 | $3,218 | $3.39 | 4d | 36 | 0.67mi |
| 5401 Commonwealth Centre Pkwy Midlothian, VA | 1.0–2.0 | 1.0–2.0 | 1008 | $2,207 | $2.19 | 0d | 12 | 0.90mi |
| 12737 Deep Well Rd Midlothian, VA | 3.0 | 2.5 | 1835 | $2,600 | $1.42 | 25d | 1 | 0.98mi |
| 4000 Maze Runner Dr Midlothian, VA | 2.0 | 2.0 | 1302 | $2,200 | $1.69 | 22d | 1 | 1.03mi |
| 3900 Maze Runner Dr #201 Midlothian, VA | 2.0 | 2.0 | 1156 | $1,895 | $1.64 | 0d | 1 | 1.07mi |
| 3900 Maze Runner Dr Midlothian, VA | 2.0 | 2.0 | 1229 | $1,825 | $1.48 | 12d | 2 | 1.08mi |
| 4100 Lonas Pkwy Midlothian, VA | 1.0–3.0 | 1.0–2.0 | 969 | $2,329 | $2.40 | 0d | 17 | 1.09mi |
| 12201 Dutch Elm Cir Midlothian, VA | 4.0 | 3.5 | 1848 | $2,500 | $1.35 | 25d | 1 | 1.27mi |
| 3712 Mill Meadow Dr Midlothian, VA | 3.0 | 2.5 | 1870 | $2,495 | $1.33 | 45d | 1 | 1.30mi |
| 13803 Deer Run Cir Unit Na Midlothian, VA | 4.0 | 2.5 | 1732 | $2,650 | $1.53 | 0d | 1 | 1.35mi |
| 4613 Bridgewood Rd Midlothian, VA | 3.0 | 1.0 | 1056 | $1,995 | $1.89 | 4d | 1 | 1.47mi |
HOA detail
- Monthly dues
- $238 · $2,856/yr
Listing history 3 events
-
2026-05-16$185,000 Active
-
1999-11-03soldstatus $88,000
-
1996-06-17soldstatus $83,850
ⓘ Source: listings_history table (triggers on properties + properties_extension) + one-shot
backfill from property_details.listing_events for pre-trigger history.
Tax reassessment forecast VA · Resets to sale price
- Current annual tax
- $2,671 · $223/mo
- Projected year-2 tax
- $2,671 · $223/mo
- Expected delta
- $0/yr ($0/mo · 0.0%)
ⓘ Screening estimate from a state-policy table — verify with the county assessor before closing.
Climate risk First Street
- Flood 1/10 Low FEMA zone X (unshaded) · 0% chance over 30 yrs
- Wildfire 1/10 Low
- Heat 6/10 Major 7 d/yr ≥105°F today · 15 d/yr by 30 yrs out
- Wind 5/10 Major 25% chance of damaging wind over 30 yrs
- Air quality 2/10 Low 0 unhealthy d/yr today · 1 by 30 yrs out
Nearby sold comps map
Loading sold comps map…
Walkable amenities ~0.75 mi
Loading nearby amenities…
Taxation est. · year 1
- Rental income
- $28,016
- − Mortgage interest
- −$10,363
- − Property taxes
- −$2,671
- − Insurance
- −$925
- − Repairs & maintenance
- −$2,241
- − Management
- −$2,241
- − HOA
- −$2,856
- − Depreciation
- −$5,382
- Taxable income
- $1,337
- Est. tax owed @ 24.0%
- −$321
- After-tax cash flow
- $3,718/yr
For passive investors: Depreciation is non-cash, so a rental often shows a tax loss while cash-flowing — sheltering income. Rental losses are passive: they offset passive income freely, and up to $25,000/yr can offset ordinary (W-2) income if you actively participate and your MAGI is under $100k (phasing out to $0 by $150k); unused losses carry forward. On sale, claimed depreciation is recaptured at up to 25%, and gains may owe capital-gains tax (a 1031 exchange can defer both). Figures are a year-1 estimate at your 24.0% rate — not tax advice; consult a CPA.
Schools (NCES district)
- District
- Chesterfield County Public School District
- NCES district ID
- 5100840
- Math proficiency
- 52% ▼ -30.00%
- Reading proficiency
- 64% ▼ -15.00%
- Median HH income
- $72,821
- Composite
- 51.56/100
- National rank
- #1712
- State rank
- #57 of 131 in VA
Livability — Brandermill
- Score
- 77/100
- State rank
- #94
- US rank
- #3055
Category grades
Schools grade is shown separately in the Schools card above.
Census & demographics
- Census place
- Brandermill, VA
- County
- Chesterfield County · 406,988 people
- City population
- 56,364
- Metro
- Richmond, VA
- Population (ZIP)
- 57,016
- Household income
- $116,465
- Rent vs Own
- Severe rent burden
- 897.0
Population outlook (Chesterfield County) Hauer SSP2
- Today (2025)
- 377,190 people
- By 2030
- 395,710 · +4.9%
- By 2040
- 427,694 · +13.4%
- By 2050
- 452,706 · +20.0%
- By 2075
- 505,533 · +34.0%
- By 2100
- 521,282 · +38.2%
Race, ethnicity, and origin ACS 2023
- Neighborhood character
- Predominantly White (70%)
- Race & ethnicity
- White 70% Black 14% Two or more races 7% Hispanic / Latino 6% Asian 4%
- Hispanic origin (detail)
- Mexican 1% Puerto Rican 2%
- Common ancestry
- Lithuanian 4% Italian 4% Romanian 2%
- Foreign-born
- 7% · Canada, China, Jamaica
- Languages at home
- 91% English-only · Spanish 4% Other Indo-European 1% Arabic 1%
Political lean MEDSL · Chesterfield
- 2024 margin
- Lean D (+9.0) · D 53.8% · R 44.8% · Other 1.4%
- 2008→2024 swing
- +16.4pp toward D · 2008: -7.5pp · 2024: 9.0pp
- All cycles
- 2024: D+9.0 2020: D+6.7 2016: R+2.2 2012: R+7.1 2008: R+7.5
Not yet ingested
- Civics
- —
Market trends
- HPI YoY
- ▼ -224.87%
- Current HPI
- 277.4841
- Rent YoY
- ▲ 2.29%
- Metro
- Richmond, VA
- State GDP YoY
- ▲ 2.40%
- F500 in state
- 50
Industry mix (Fortune 500 HQ in VA)
| Industry | F500 HQs | Revenue |
|---|---|---|
| Aerospace / Defense | 4 | $236B |
|
||
| Technology / Defense | 3 | $32B |
|
||
| Financial Services | 2 | $176B |
|
||
| Utilities | 2 | $27B |
|
||
| Insurance | 2 | $25B |
|
||
| Technology | 2 | $15B |
|
||
Price history
+120.6% since first listed3 events — show timeline
- 2026-05-16 Listed $185,000 CVRMLS
- 1999-11-03 Sold (Public Records) $88,000 Public Records
- 1996-06-17 Sold (Public Records) $83,850 Public Records
Property tax history
+5.6%/yrLatest (2025): $2,671 · +5.5% YoY. Source: county tax records.
Cash-flow waterfall
monthlySold comps — $/sqft
last 12 mo · ≤1 miLoading sold comps…