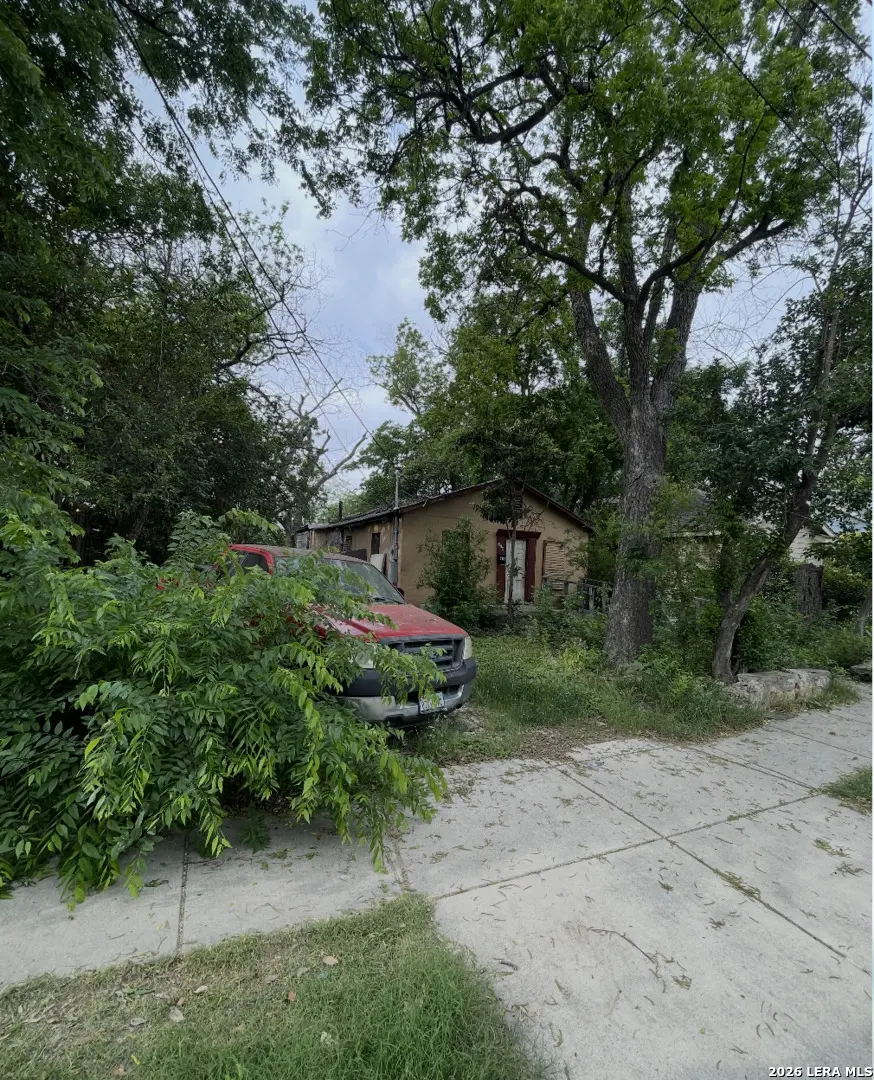
416 E Woodlawn Ave · San Antonio, TX
Flood risk 1/10 · Minimal
- FEMA flood zone
- X (unshaded)
- Chance of flooding over 30 yrs
- 0.0%
- Est. flood insurance / yr
- $507 – $1,088
Fire risk 1/10 · Minimal
- Est. fire insurance / yr
- $1,222 – $2,270
Heat risk 8/10 · Major
- Hot days now (above 108°F)
- 7 days/yr
- Hot days in 30 yrs
- 22 days/yr
Wind risk 6/10 · Moderate
- Chance of severe wind over 30 yrs
- 77.0%
Air-quality risk 2/10 · Minimal
- Unhealthy air days now
- 1 days/yr
- Unhealthy air days in 30 yrs
- 1 days/yr
Risk factors via First Street. Map © Google.
Why this score? — see what drove the C- grade
The composite is a weighted blend of 9 inputs, each scored 0–100. Each bar is that input's sub-score; the figure is the points it added to the 100-point composite (weight × sub-score).
- Cash flow +17.0/30.0
- ARV discount +15.0/15.0
- 1% rule +6.7/10.0
- DSCR +5.3/10.0
- Livability +4.0/5.0
- Rent growth +2.7/5.0
- Condition / age +2.5/5.0
- Schools +1.4/10.0
- Appreciation +0.0/10.0
$159,999
🖨 Deal sheet 📄 Offer letter ✓ Due diligence
Listing remarks MLS
Great investment opportunity located in one of San Antonio's most popular districts Tobin Hill! The home offers a prime location, being in close proximity to several notable San Antonio landmarks such as The Pearl, Pullman Market, St. Mary's Strip, the Alamo, the San Antonio Zoo, Trinity University, and the bustling downtown area.
Key facts
- 5,749 sq ft lot
- Built 1945
- Listed 62 days
Neighborhood map
What this means for you Summary
Snapshot
- This is a 3-bed/1.0-bath single-family listed at $160k.
Deal economics
- At list price, monthly cash flow is $110 ($1k/yr) — positive.
- The deal already cash-flows at list — no discount required.
- Meets the 1% rule at list price ($2k rent vs $160k).
- Recommended offer: $150k (6.0% below list) — sets the bar for market timing.
- Cap rate 7.1% vs local median 3.8% in San Antonio — top-decile yield for the area; either an underpriced asset or a hidden risk that comps aren't pricing in. Stress-test before assuming the spread holds.
Location & tenants
- Location reads 80/100 on livability (#31 in TX, #1,616 nationally) — a professional / high-income tenant draw. Strengths: amenities A+, commute A+, cost of living A+; Watch: schools C-, crime F.
- San Antonio ISD (urban): math 12% / reading 22% proficiency, ranked #805 of 826 in TX (top 98%) — low school quality limits family demand, transient renter base, plan for 1-2y turnover; 80% free/reduced lunch — lower-income household profile, screen leases tightly.
- Market conditions: Rents flat; 175 active listings in the ZIP; 28 comparable units currently listed for rent nearby; rentals leasing fast (median 4d on market — plan ~1-2 weeks tenant-placement turnaround); 8,308 units permitted in Bexar County in 2024 (2,506 in 5+ unit buildings).
- This rent runs 36% of the median local income ($63k/yr) — at the standard rent-burdened threshold; future hikes will face affordability resistance.
Forward outlook
- Local home prices are declining (-3.0%/yr); year-one equity from $1k of loan paydown is wiped out by about $5k of value loss. Plan a longer hold.
- Bexar County population projected at +50% by 2050 — long-run rental-demand tailwind backs the buy-and-hold thesis.
Negotiation context
- It's been on market 62 days — a 6% lower offer ($150k) is reasonable based on typical stale-listing flexibility.
Risks & watch-outs
- Watch-outs: property tax is 3.4% of price; built in 1945 — expect roof / HVAC / electrical / plumbing capex.
- Climate carrying-cost: major wind risk, 77% chance of damaging wind over 30y; extreme-heat days projected 7→22/yr by 2055 (HVAC capex compounding) — expect insurance premiums to compound above CPI over the hold.
Questions for the listing agent
- It's been on market 62 days. Have you received any prior offers? Is the seller open to a 6% concession, seller financing, or rate buy-down credit?
- Built in 1945 — when were the roof, HVAC, electrical panel, plumbing, and water heater last replaced?
- Property tax is high relative to price — has the assessment been appealed recently, and will the sale trigger a re-assessment?
- Why hasn't it sold? Are there any deal-killer items the seller is aware of (foundation, flood, title, zoning, code violations)?
- Is there a deadline driving the sale (1031 exchange, divorce, estate, relocation)? That informs how much negotiation room exists.
- Crime grade is F in this area — have there been break-ins, vandalism, or insurance claims at this property in the last 3 years? What carrier currently insures it and at what premium?
- What's the average days-on-market for RENTAL listings here right now (not sales)? A rising rental-DOM trend means longer vacancies and softer asking-rent achievability than the comps imply.
- What's the recent tenant-quality profile in this submarket — average credit score on applications, eviction rate, late-payment / NSF rate, and stable-employment percentage? A property-management company in the area should have these aggregated.
- How much new for-sale + rental construction is in the pipeline within 1–3 miles? Heavy new supply typically softens prices + rents 12–24 months out; constrained supply supports both.
Investment metrics
- 1% rule
- 1.17% ✓
- Cap rate
- 7.12%
- Cash-on-cash
- 2.94%
- DSCR
- 1.13
- GRM
- 7.1
CMA / ARV
- ARV (median comp)
- $311,977
- List price
- $159,999
- Delta
- -48.71%
- Verdict
- UNDERPRICED
- Comps
- 20 within 1.0 mi
Show comp detail 4 sales within ~0.75 mi
| Address | Dist | Beds/Ba | Sqft | Sold | Price | $/sf | Match |
|---|---|---|---|---|---|---|---|
| 103 Ewald St | 0.09mi | 3/1.0 | 850 (+15%) | 14mo | $289,000 | $340 | 60 |
| 270 E Russell Pl | 0.18mi | 2/1.0 (-1) | 784 (+6%) | 23mo | $199,995 | $255 | 58 |
| 106 Ewald St | 0.09mi | 2/1.0 (-1) | 646 (-13%) | 23mo | $284,800 | $441 | 51 |
| 1107 Euclid Ave | 0.64mi | 2/1.0 (-1) | 783 (+6%) | 10mo | $355,000 | $453 | 47 |
Match score weights: distance 35% · size 25% · config 20% · recency 20%. Top-matched comps best support the ARV.
Projected returns pro-forma
-3.0% appreciation · 0.89% rent growth · sell at horizon
- IRR
- -14.5%
- Equity multiple
- 0.49×
- Total profit
- $-22,630
- Equity at exit
- $23,856
- IRR
- -10.4%
- Equity multiple
- 0.44×
- Total profit
- $-25,209
- Equity at exit
- $13,834
Cash invested: $44,800 (down + closing). Projections, not guarantees.
Landlord ↔ Tenant lean methodology
- Overall (STATE)
- 87 Strongly Landlord-Friendly
- State Texas
- 87 Strongly Landlord-Friendly · R+5
- County
- — inherits STATE
- City
- — inherits STATE
ZIP-level market 78212
- Home prices YoY
- -25.2%
- Rents YoY
- 0.9%
- Active inventory
- 175
- Price-to-rent
- 7.1×
Monthly cashflow live
- Estimated rent
- $1,866 high interval (Pro) →
- Mortgage (P&I)
- −$839
- Tax from tax record
- −$459 /mo · $5,507/yr
- Insurance
- −$67
- HOA
- −$0
- Vacancy / Maint / Mgmt
- −$392
- Net cashflow
- $110
Break-even live
UW: 25.0% down · 7.5% · 30yr · 1.5% tax · 5.0% vac · 8.0% maint · 8.0% mgmt
Financing live
Cash to close
- Down payment
- $40,000
- Closing costs
- $4,800
- Reserves months
- —
- Total cash needed
- —
Loan-product check · same deal, 3 products live
Conventional
25% down · 7.5% · 30yr
- Down + closing
- —
- Monthly P&I
- —
- Monthly cashflow
- —
- DSCR
- —
- Eligible?
- —
Personal DTI + credit; lowest rate.
DSCR
20% down · 8.5% · 30yr
- Down + closing
- —
- Monthly P&I
- —
- Monthly cashflow
- —
- DSCR
- —
- Eligible?
- —
No personal income docs; deal must DSCR.
Hard money
10% down · 12.0% · 12mo
- Down + closing
- —
- Monthly P&I
- —
- Monthly cashflow
- —
- DSCR
- —
- Eligible?
- —
Short-term bridge; refi at stabilization.
Rent comps 28 comps
| Address | Beds | Baths | Sqft | Rent | $/sqft | DOM | Units | Dist |
|---|---|---|---|---|---|---|---|---|
| 226 E Huisache Ave Unit 101 San Antonio, TX | 2.0 | 1.0 | 675 | $1,300 | $1.93 | 43d | 1 | 0.33mi |
| 226 E Huisache Ave Unit 101 San Antonio, TX | 2.0 | 1.0 | 675 | $1,300 | $1.93 | 24d | 1 | 0.33mi |
| 230 E Mulberry Ave Unit 2 San Antonio, TX | 2.0 | 1.0 | 600 | $825 | $1.38 | 20d | 1 | 0.38mi |
| 847 E Ashby Pl San Antonio, TX | 1.0–2.0 | 1.0–2.0 | 922 | $3,292 | $3.57 | 2d | 43 | 0.46mi |
| 210 W Josephine St San Antonio, TX | 3.0 | 1.0–2.0 | 912 | $3,400 | $3.73 | 2d | 27 | 0.52mi |
| 102 E Josephine St San Antonio, TX | 2.0 | 1.0 | 697 | $1,000 | $1.43 | 43d | 1 | 0.61mi |
| 111 E Park Ave San Antonio, TX | 1.0–2.0 | 1.0 | 789 | $999 | $1.27 | 14d | 7 | 0.67mi |
| 1415 N Main Ave San Antonio, TX | 3.0 | 1.0–3.0 | 818 | $2,150 | $2.63 | 2d | 35 | 0.81mi |
| 1415 N Main Ave San Antonio, TX | 1.0–3.0 | 1.0–3.0 | 980 | $2,715 | $2.77 | 10d | 15 | 0.81mi |
| 1415 N Main Ave San Antonio, TX | 3.0 | 1.0–3.0 | 906 | $2,150 | $2.37 | 3d | 12 | 0.81mi |
| 503 Avenue A San Antonio, TX | 2.0 | 1.0–2.0 | 906 | $3,325 | $3.67 | 2d | 55 | 0.85mi |
| 1800 Broadway St San Antonio, TX | 2.0 | 1.0–2.5 | 1100 | $2,734 | $2.49 | 1d | 41 | 0.91mi |
| 123 Brackenridge Ave San Antonio, TX | 2.0 | 1.0–2.0 | 806 | $1,525 | $1.89 | 2d | 21 | 0.94mi |
| 122 Roy Smith St San Antonio, TX | 3.0 | 1.0–3.0 | 996 | $3,299 | $3.31 | 2d | 18 | 0.97mi |
| 1203 Austin St San Antonio, TX | 1.0–2.0 | 1.0–2.0 | 933 | $2,334 | $2.50 | 1d | 43 | 0.99mi |
| 1542 N Alamo St San Antonio, TX | 1.0–2.0 | 1.0–2.0 | 852 | $2,000 | $2.35 | 4d | 2 | 1.04mi |
| 717 E Grayson St Unit 11 San Antonio, TX | 2.0 | 1.0 | 550 | $775 | $1.41 | 4d | 1 | 1.04mi |
| 223 Brackenridge Ave San Antonio, TX | 1.0–3.0 | 1.0–2.0 | 996 | $2,501 | $2.51 | 1d | 25 | 1.05mi |
| 233 Howard St San Antonio, TX | 1.0–2.0 | 1.0 | 769 | $999 | $1.30 | 2d | 15 | 1.08mi |
| 819 E Grayson St San Antonio, TX | 1.0–2.0 | 1.0 | 825 | $999 | $1.21 | 24d | 4 | 1.13mi |
| 111 W Jones Ave San Antonio, TX | 2.0 | 1.0–2.0 | 773 | $2,689 | $3.48 | 1d | 17 | 1.13mi |
| 831 E Grayson St San Antonio, TX | 2.0 | 1.0 | 787 | $999 | $1.27 | 14d | 4 | 1.15mi |
| 1235 E Mulberry Ave San Antonio, TX | 2.0 | 1.0–2.0 | 914 | $3,365 | $3.68 | 1d | 30 | 1.17mi |
| 120 9th St San Antonio, TX | 1.0–2.0 | 1.0–2.0 | 923 | $1,757 | $1.90 | 1d | 20 | 1.19mi |
| 130 W Norwood Ct Unit 3 San Antonio, TX | 2.0 | 1.0 | 729 | $1,295 | $1.78 | 43d | 1 | 1.19mi |
| 130 Melrose Pl San Antonio, TX | 3.0 | 1.0–2.5 | 1230 | $1,865 | $1.52 | 3d | 22 | 1.21mi |
| 317 Lexington Ave San Antonio, TX | 2.0 | 1.0–2.0 | 972 | $1,900 | $1.95 | 43d | 1 | 1.29mi |
| 1417 E Olmos Dr San Antonio, TX | 2.0 | 1.0 | 640 | $1,075 | $1.68 | 4d | 1 | 1.47mi |
Listing history 15 events
-
2026-06-18days on market $159,999 Active 62 DOM
-
2026-06-17days on market $159,999 Active 61 DOM
-
2026-06-16days on market $159,999 Active 60 DOM
-
2026-06-15days on market $159,999 Active 59 DOM
-
2026-06-13days on market $159,999 Active 57 DOM
-
2026-06-09days on market $159,999 Active 53 DOM
-
2026-06-08days on market $159,999 Active 52 DOM
-
2026-06-07statusdays on market $159,999 Active 51 DOM
-
2026-06-04days on market $159,999 Back on Market 48 DOM
-
2026-06-03days on market $159,999 Back on Market 47 DOM
-
2026-06-02days on market $159,999 Back on Market 46 DOM
-
2026-06-01days on market $159,999 Back on Market 45 DOM
-
2026-05-31days on market $159,999 Back on Market 44 DOM
-
2026-04-17$174,999 New 332-char remark
Show marketing remark (332 chars)
Great investment opportunity located in one of San Antonio's most popular districts Tobin Hill! The home offers a prime location, being in close proximity to several notable San Antonio landmarks such as The Pearl, Pullman Market, St. Mary's Strip, the Alamo, the San Antonio Zoo, Trinity University, and the bustling downtown area.
-
2025-05-07soldstatus
ⓘ Source: listings_history table (triggers on properties + properties_extension) + one-shot
backfill from property_details.listing_events for pre-trigger history.
Tax reassessment forecast TX · Resets to sale price
- Current annual tax
- $5,507 · $459/mo
- Projected year-2 tax
- $5,507 · $459/mo
- Expected delta
- $0/yr ($0/mo · 0.0%)
ⓘ Screening estimate from a state-policy table — verify with the county assessor before closing.
Climate risk First Street
- Flood 1/10 Low FEMA zone X (unshaded) · 0% chance over 30 yrs
- Wildfire 1/10 Low
- Heat 8/10 Severe 7 d/yr ≥108°F today · 22 d/yr by 30 yrs out
- Wind 6/10 Major 77% chance of damaging wind over 30 yrs
- Air quality 2/10 Low 1 unhealthy d/yr today · 1 by 30 yrs out
Nearby sold comps map
Loading sold comps map…
Walkable amenities ~0.75 mi
Loading nearby amenities…
Taxation est. · year 1
- Rental income
- $22,396
- − Mortgage interest
- −$8,962
- − Property taxes
- −$5,507
- − Insurance
- −$800
- − Repairs & maintenance
- −$1,792
- − Management
- −$1,792
- − Depreciation
- −$4,655
- Taxable loss
- −$1,112
- Est. tax savings @ 24.0%
- +$267
- After-tax cash flow
- $1,584/yr
For passive investors: Depreciation is non-cash, so a rental often shows a tax loss while cash-flowing — sheltering income. Rental losses are passive: they offset passive income freely, and up to $25,000/yr can offset ordinary (W-2) income if you actively participate and your MAGI is under $100k (phasing out to $0 by $150k); unused losses carry forward. On sale, claimed depreciation is recaptured at up to 25%, and gains may owe capital-gains tax (a 1031 exchange can defer both). Figures are a year-1 estimate at your 24.0% rate — not tax advice; consult a CPA.
Schools (NCES district)
- District
- San Antonio ISD
- NCES district ID
- 4838730
- Math proficiency
- 12% ▼ -21.00%
- Reading proficiency
- 22% ▼ -7.00%
- Median HH income
- $30,952
- Composite
- 13.57/100
- National rank
- #9512
- State rank
- #805 of 826 in TX
Livability — San Antonio
- Score
- 80/100
- State rank
- #31
- US rank
- #1616
Category grades
Schools grade is shown separately in the Schools card above.
Census & demographics
- Census place
- San Antonio, TX
- County
- Bexar County · 1,990,555 people
- City population
- 1,806,925
- Metro
- San Antonio-New Braunfels, TX
- Population (ZIP)
- 27,437
- Household income
- $62,801
- Rent vs Own
- Severe rent burden
- 1505.0
Population outlook (Bexar County) Hauer SSP2
- Today (2025)
- 2,336,851 people
- By 2030
- 2,560,728 · +9.6%
- By 2040
- 3,020,569 · +29.3%
- By 2050
- 3,493,522 · +49.5%
- By 2075
- 4,668,459 · +99.8%
- By 2100
- 5,533,242 · +136.8%
Race, ethnicity, and origin ACS 2023
- Neighborhood character
- Diverse neighborhood (Simpson 0.55)
- Race & ethnicity
- Hispanic / Latino 58% White 34% Two or more races 34% Black 3% Asian 2%
- Hispanic origin (detail)
- Mexican 50%
- Common ancestry
- Slovak 2% Lithuanian 2% Romanian 1%
- Foreign-born
- 13% · Canada, China
- Languages at home
- 62% English-only · Spanish 36% Chinese 1%
Political lean MEDSL · Bexar
- 2024 margin
- Lean D (+9.8) · D 54.3% · R 44.6% · Other 1.1%
- 2008→2024 swing
- +4.2pp toward D · 2008: 5.6pp · 2024: 9.8pp
- All cycles
- 2024: D+9.8 2020: D+18.2 2016: D+13.5 2012: D+4.6 2008: D+5.6
Not yet ingested
- Civics
- —
Market trends
- HPI YoY
- ▼ -94.24%
- Current HPI
- 280.1006
- Rent YoY
- ▲ 0.89%
- Metro
- San Antonio-New Braunfels, TX
- State GDP YoY
- ▲ 3.95%
- F500 in state
- 110
Industry mix (Fortune 500 HQ in TX)
| Industry | F500 HQs | Revenue |
|---|---|---|
| Energy | 16 | $1,198B |
|
||
| Technology | 5 | $198B |
|
||
| Engineering / Construction | 4 | $72B |
|
||
| Energy Services | 3 | $60B |
|
||
| Utilities | 3 | $41B |
|
||
| Healthcare | 2 | $330B |
|
||
Price history
2 events — show timeline
- 2026-04-17 Listed $174,999 LERA
- 2025-05-07 Sold (Public Records) — Public Records
Property tax history
+10.1%/yrLatest (2025): $5,507 · +1.0% YoY. Source: county tax records.
Cash-flow waterfall
monthlySold comps — $/sqft
last 12 mo · ≤1 miLoading sold comps…