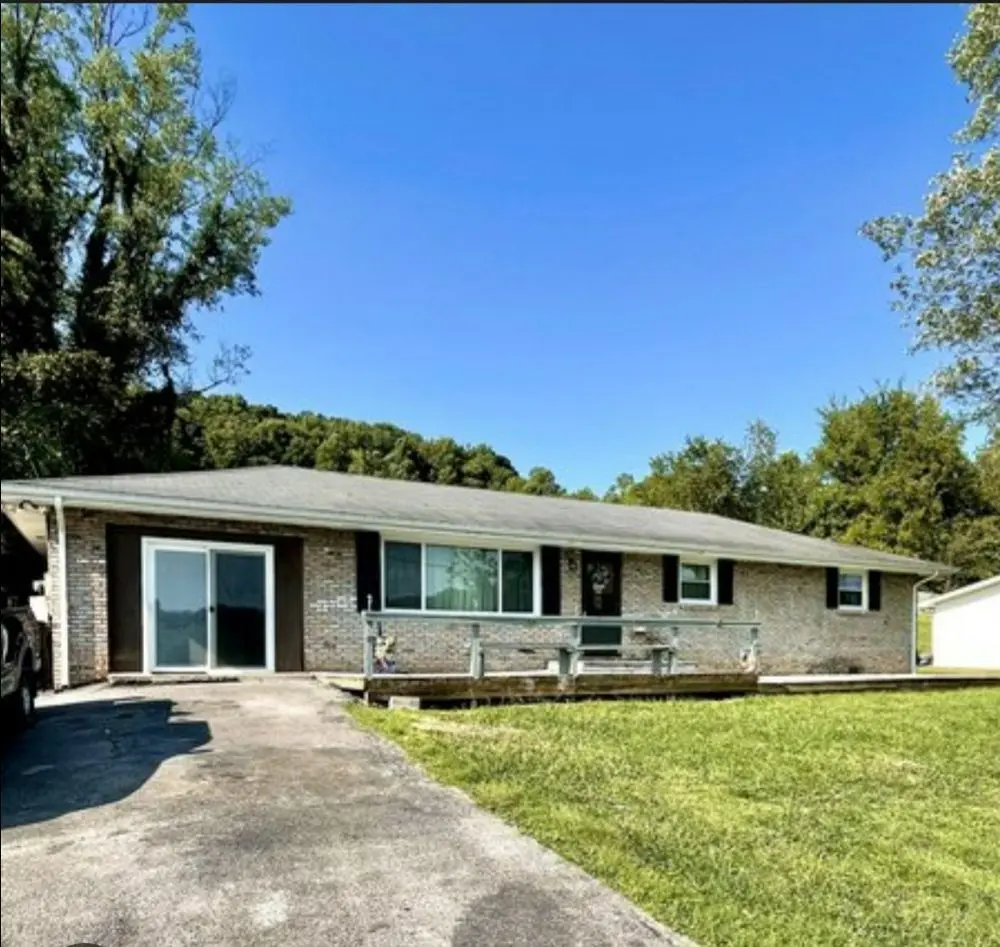
300 Ellis Rd · Blountville, TN
Flood risk 1/10 · Minimal
- FEMA flood zone
- X (unshaded)
- Chance of flooding over 30 yrs
- 0.0%
- Est. flood insurance / yr
- $507 – $1,088
Fire risk 4/10 · Minor
- Est. fire insurance / yr
- $949 – $1,763
Heat risk 4/10 · Minor
- Hot days now (above 98°F)
- 7 days/yr
- Hot days in 30 yrs
- 20 days/yr
Wind risk 2/10 · Minimal
- Chance of severe wind over 30 yrs
- —
Air-quality risk 2/10 · Minimal
- Unhealthy air days now
- 2 days/yr
- Unhealthy air days in 30 yrs
- 2 days/yr
Risk factors via First Street. Map © Google.
Why this score? — see what drove the D+ grade
The composite is a weighted blend of 9 inputs, each scored 0–100. Each bar is that input's sub-score; the figure is the points it added to the 100-point composite (weight × sub-score).
- Cash flow +16.4/30.0
- ARV discount +15.0/15.0
- DSCR +5.1/10.0
- 1% rule +3.4/10.0
- Livability +3.4/5.0
- Rent growth +2.5/5.0
- Condition / age +2.5/5.0
- Schools +1.8/10.0
- Appreciation +0.0/10.0
$199,000
🖨 Deal sheet 📄 Offer letter ✓ Due diligence
Listing remarks MLS
FSBO. This home has amazing single level living with 3 bedrooms and 1 1/2 bath. It has a spacious living room, kitchen with new stainless steal touchless faucet and has connecting add-on Den for an extra bedroom or home office with new hardwood waterproof flooring. Stepping out onto the big front deck gives beautiful views of the country setting but still close to what you need. Perfect for those nice Spring and Summer evenings. The front yard is level and has a big back yard that even comes with a garden prepped area! Just ready for those green thumbs to grow those veggies you love. Home is being sold as-is. Roof will need to be replaced.
Key facts
- Level front yard
- Big back yard
- Single level living
Tags
Neighborhood map
What this means for you Summary
Snapshot
- This is a 3-bed/2.0-bath single-family listed at $199k.
Deal economics
- At list price, monthly cash flow is $112 ($1k/yr) — positive.
- The deal already cash-flows at list — no discount required.
- To meet the 1% rule (rent ≥ 1% of price), the offer needs to be $167k (16.3% below list).
- Recommended offer: $167k (16.3% below list) — sets the bar for 1% rule.
Location & tenants
- Location reads 67/100 on livability (#102 in TN) — a middle-class / working-renter tenant base. Strengths: cost of living A+, housing A+, crime B; Watch: schools F, amenities F, commute F.
- Sullivan County (suburban): math 17% / reading 24% proficiency, ranked #109 of 139 in TN (top 78%) — low school quality limits family demand, transient renter base, plan for 1-2y turnover.
- Market conditions: 141 active listings in the ZIP; 453 units permitted in Sullivan County in 2024 (6 in 5+ unit buildings).
Forward outlook
- Local home prices are declining (-3.0%/yr); year-one equity from $1k of loan paydown is wiped out by about $6k of value loss. Plan a longer hold.
- Sullivan County population projected to shrink 5% by 2050 — rents likely to lag national; underwrite the cash flow, not the appreciation.
Negotiation context
- It's been on market 199 days — a 12% lower offer ($175k) is reasonable based on typical stale-listing flexibility.
- 3 sale attempts since 5y ago; this cycle's ask has dropped $15k (7%) from the opening price — seller is motivated, your offer sets the floor, not the list.
Questions for the listing agent
- It's been on market 199 days. Have you received any prior offers? Is the seller open to a 16% concession, seller financing, or rate buy-down credit?
- Built in 1967 — when were the roof, HVAC, electrical panel, plumbing, and water heater last replaced?
- Why hasn't it sold? Are there any deal-killer items the seller is aware of (foundation, flood, title, zoning, code violations)?
- Is there a deadline driving the sale (1031 exchange, divorce, estate, relocation)? That informs how much negotiation room exists.
- Schools are F-rated, which usually means shorter tenancies and higher turnover. Who's the typical renter profile here, and what's been the actual vacancy rate?
- The area grade is low — what's the realistic commute time and amenity access for the typical tenant pool here? Any planned neighborhood developments (good or bad) we should know about?
- What's the average days-on-market for RENTAL listings here right now (not sales)? A rising rental-DOM trend means longer vacancies and softer asking-rent achievability than the comps imply.
- What's the recent tenant-quality profile in this submarket — average credit score on applications, eviction rate, late-payment / NSF rate, and stable-employment percentage? A property-management company in the area should have these aggregated.
- How much new for-sale + rental construction is in the pipeline within 1–3 miles? Heavy new supply typically softens prices + rents 12–24 months out; constrained supply supports both.
Investment metrics
- 1% rule
- 0.84% ✗
- Cap rate
- 6.97%
- Cash-on-cash
- 2.42%
- DSCR
- 1.11
- GRM
- 10.0
CMA / ARV
- ARV (median comp)
- $249,935
- List price
- $199,000
- Delta
- -20.38%
- Verdict
- UNDERPRICED
- Comps
- 20 within 1.0 mi
Show comp detail 8 sales within ~0.75 mi
| Address | Dist | Beds/Ba | Sqft | Sold | Price | $/sf | Match |
|---|---|---|---|---|---|---|---|
| 309 Sammons Pvt Dr | 0.20mi | 3/2.0 | 1,584 (+1%) | 3mo | $215,000 | $136 | 87 |
| 4091 Highway 126 | 0.44mi | 3/1.0 | 1,608 (+2%) | 1mo | $243,000 | $151 | 71 |
| 129 Ellis Rd | 0.40mi | 3/2.0 | 1,553 (-1%) | 18mo | $291,500 | $188 | 64 |
| 360 Highway 75 | 0.56mi | 3/1.5 | 1,666 (+6%) | 1mo | $298,000 | $179 | 61 |
| 205 Clear Branch Cir | 0.60mi | 3/2.0 | 1,646 (+4%) | 12mo | $275,000 | $167 | 54 |
| 180 Neeley Pl | 0.38mi | 3/1.0 | 1,450 (-8%) | 20mo | $269,900 | $186 | 48 |
| 155 Old Stage Coach Rd | 0.70mi | 3/2.0 | 1,800 (+14%) | 0mo | $250,000 | $139 | 43 |
| 300 Barr Rd | 0.74mi | 2/2.0 (-1) | 1,680 (+7%) | 21mo | $410,000 | $244 | 32 |
Match score weights: distance 35% · size 25% · config 20% · recency 20%. Top-matched comps best support the ARV.
Projected returns pro-forma
-3.0% appreciation · 3.0% rent growth · sell at horizon
- IRR
- -12.5%
- Equity multiple
- 0.55×
- Total profit
- $-25,171
- Equity at exit
- $29,672
- IRR
- -3.5%
- Equity multiple
- 0.77×
- Total profit
- $-13,030
- Equity at exit
- $17,206
Cash invested: $55,720 (down + closing). Projections, not guarantees.
Landlord ↔ Tenant lean methodology
- Overall (STATE)
- 87 Strongly Landlord-Friendly
- State Tennessee
- 87 Strongly Landlord-Friendly · R+13
- County
- — inherits STATE
- City
- — inherits STATE
ZIP-level market 37617
- Home prices YoY
- -17.9%
- Active inventory
- 141
- Price-to-rent
- 10.0×
Monthly cashflow live
- Estimated rent
- $1,666 medium interval (Pro) →
- Mortgage (P&I)
- −$1,044
- Tax from tax record
- −$78 /mo · $932/yr
- Insurance
- −$83
- HOA
- −$0
- Vacancy / Maint / Mgmt
- −$350
- Net cashflow
- $112
Break-even live
UW: 25.0% down · 7.5% · 30yr · 1.5% tax · 5.0% vac · 8.0% maint · 8.0% mgmt
Financing live
Cash to close
- Down payment
- $49,750
- Closing costs
- $5,970
- Reserves months
- —
- Total cash needed
- —
Loan-product check · same deal, 3 products live
Conventional
25% down · 7.5% · 30yr
- Down + closing
- —
- Monthly P&I
- —
- Monthly cashflow
- —
- DSCR
- —
- Eligible?
- —
Personal DTI + credit; lowest rate.
DSCR
20% down · 8.5% · 30yr
- Down + closing
- —
- Monthly P&I
- —
- Monthly cashflow
- —
- DSCR
- —
- Eligible?
- —
No personal income docs; deal must DSCR.
Hard money
10% down · 12.0% · 12mo
- Down + closing
- —
- Monthly P&I
- —
- Monthly cashflow
- —
- DSCR
- —
- Eligible?
- —
Short-term bridge; refi at stabilization.
Listing history 10 events
-
2026-06-02days on market $199,000 Active 199 DOM
-
2026-06-01days on market $199,000 Active 198 DOM
-
2026-05-31days on market $199,000 Active 197 DOM
-
2026-05-30days on market $199,000 Active 196 DOM
-
2026-01-15historical
-
2026-01-15$214,000
-
2025-11-15$199,000 Active 647-char remark
Show marketing remark (647 chars)
FSBO. This home has amazing single level living with 3 bedrooms and 1 1/2 bath. It has a spacious living room, kitchen with new stainless steal touchless faucet and has connecting add-on Den for an extra bedroom or home office with new hardwood waterproof flooring. Stepping out onto the big front deck gives beautiful views of the country setting but still close to what you need. Perfect for those nice Spring and Summer evenings. The front yard is level and has a big back yard that even comes with a garden prepped area! Just ready for those green thumbs to grow those veggies you love. Home is being sold as-is. Roof will need to be replaced.
-
2025-08-11price $214,000
-
2022-02-08soldstatus $178,250
-
2021-09-11$180,000
ⓘ Source: listings_history table (triggers on properties + properties_extension) + one-shot
backfill from property_details.listing_events for pre-trigger history.
Tax reassessment forecast TN · Resets to sale price
- Current annual tax
- $932 · $78/mo
- Projected year-2 tax
- $1,413 · $118/mo
- Expected delta
- +$481/yr (+$40/mo · 51.6%)
ⓘ Screening estimate from a state-policy table — verify with the county assessor before closing.
Climate risk First Street
- Flood 1/10 Low FEMA zone X (unshaded) · 0% chance over 30 yrs
- Wildfire 4/10 Moderate
- Heat 4/10 Moderate 7 d/yr ≥98°F today · 20 d/yr by 30 yrs out
- Wind 2/10 Low
- Air quality 2/10 Low 2 unhealthy d/yr today · 2 by 30 yrs out
Nearby sold comps map
Loading sold comps map…
Walkable amenities ~0.75 mi
Loading nearby amenities…
Taxation est. · year 1
- Rental income
- $19,998
- − Mortgage interest
- −$11,147
- − Property taxes
- −$932
- − Insurance
- −$995
- − Repairs & maintenance
- −$1,600
- − Management
- −$1,600
- − Depreciation
- −$5,789
- Taxable loss
- −$2,065
- Est. tax savings @ 24.0%
- +$496
- After-tax cash flow
- $1,844/yr
For passive investors: Depreciation is non-cash, so a rental often shows a tax loss while cash-flowing — sheltering income. Rental losses are passive: they offset passive income freely, and up to $25,000/yr can offset ordinary (W-2) income if you actively participate and your MAGI is under $100k (phasing out to $0 by $150k); unused losses carry forward. On sale, claimed depreciation is recaptured at up to 25%, and gains may owe capital-gains tax (a 1031 exchange can defer both). Figures are a year-1 estimate at your 24.0% rate — not tax advice; consult a CPA.
Schools (NCES district)
- District
- Sullivan County
- NCES district ID
- 4703990
- Math proficiency
- 17% ▼ -15.00%
- Reading proficiency
- 24% ▼ -10.00%
- Median HH income
- $43,263
- Composite
- 17.66/100
- National rank
- #9030
- State rank
- #109 of 139 in TN
Livability — Blountville
- Score
- 67/100
- State rank
- #102
- US rank
- #10547
Category grades
Schools grade is shown separately in the Schools card above.
Census & demographics
- Census place
- Blountville, TN
- Population (ZIP)
- 14,200
Population outlook (Sullivan County) Hauer SSP2
- Today (2025)
- 157,030 people
- By 2030
- 156,415 · -0.4%
- By 2040
- 153,778 · -2.1%
- By 2050
- 149,018 · -5.1%
- By 2075
- 138,068 · -12.1%
- By 2100
- 119,927 · -23.6%
Race, ethnicity, and origin ACS 2023
- Neighborhood character
- Predominantly White (96%)
- Race & ethnicity
- White 96% Two or more races 2%
- Common ancestry
- Slovak 5% Serbian 3% Italian 2%
- Foreign-born
- 1% · Vietnam
- Languages at home
- 97% English-only · Vietnamese 1% Spanish 1% German/W. Germanic 1%
Political lean MEDSL · Sullivan
- 2024 margin
- Solid R (+55.0) · D 22.0% · R 77.0% · Other 1.0%
- 2008→2024 swing
- -13.6pp toward R · 2008: -41.3pp · 2024: -55.0pp
- All cycles
- 2024: R+55.0 2020: R+51.9 2016: R+56.2 2012: R+47.2 2008: R+41.3
Not yet ingested
- Civics
- —
Market trends
- HPI YoY
- ▼ -63.76%
- Current HPI
- 292.3386
- Rent YoY
- —
- Metro
- —
- State GDP YoY
- ▲ 2.78%
- F500 in state
- 22
Industry mix (Fortune 500 HQ in TN)
| Industry | F500 HQs | Revenue |
|---|---|---|
| Healthcare | 3 | $91B |
|
||
| Retail | 3 | $72B |
|
||
| Transportation / Logistics | 1 | $88B |
|
||
| Paper / Packaging | 1 | $19B |
|
||
| Insurance | 1 | $13B |
|
||
| Energy | 1 | $12B |
|
||
Price history
+18.9% since first listed6 events — show timeline
- 2026-01-15 Listing Removed — REALTRACS as Distributed by MLS Grid
- 2026-01-15 Listed $214,000 REALTRACS as Distributed by MLS Grid
- 2025-11-15 Listed $199,000 ForSaleByOwner.com
- 2025-08-11 Price Changed $214,000 Memphis Area Association of Realtors(R) MLS
- 2022-02-08 Sold (MLS) $178,250 TVRMLS
- 2021-09-11 Listed $180,000 TVRMLS
Property tax history
+5.8%/yrLatest (2025): $932 · +30.5% YoY. Source: county tax records.
Cash-flow waterfall
monthlySold comps — $/sqft
last 12 mo · ≤1 miLoading sold comps…