 🏷️ Likely Rental
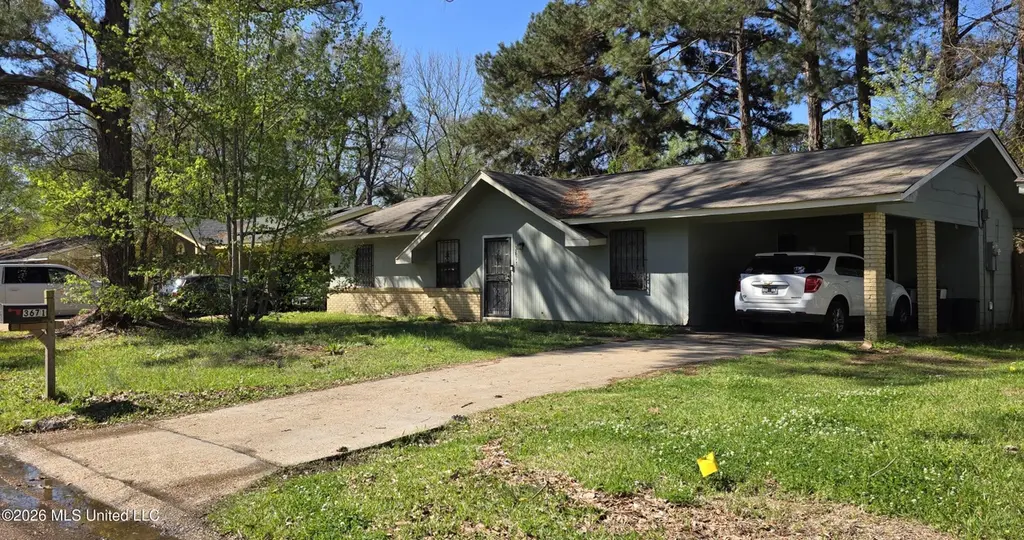
3671 James Monroe Dr · Jackson, MS
Flood risk 7/10 · Major
- FEMA flood zone
- X (shaded)
- Chance of flooding over 30 yrs
- 0.95%
- Est. flood insurance / yr
- $507 – $1,088
Fire risk 2/10 · Minimal
- Est. fire insurance / yr
- $1,241 – $2,305
Heat risk 7/10 · Major
- Hot days now (above 107°F)
- 7 days/yr
- Hot days in 30 yrs
- 21 days/yr
Wind risk 8/10 · Major
- Chance of severe wind over 30 yrs
- 80.0%
Air-quality risk 1/10 · Minimal
- Unhealthy air days now
- 0 days/yr
- Unhealthy air days in 30 yrs
- 0 days/yr
Risk factors via First Street. Map © Google.
Why this score? — see what drove the A- grade
The composite is a weighted blend of 9 inputs, each scored 0–100. Each bar is that input's sub-score; the figure is the points it added to the 100-point composite (weight × sub-score).
- Cash flow +30.0/30.0
- ARV discount +15.0/15.0
- 1% rule +10.0/10.0
- DSCR +10.0/10.0
- Appreciation +10.0/10.0
- Livability +3.4/5.0
- Rent growth +2.5/5.0
- Condition / age +2.5/5.0
- Schools +1.1/10.0
$60,000
🖨 Deal sheet 📄 Offer letter ✓ Due diligence
Listing remarks MLS
Tenant occupied. Currently leased for $875. Available investment property to add or start your real estate portfolio. SOLD AS-IS, WHERE IS with NO seller repairs, warranties and/or guarantees. ***The buyer's inspection is for their awareness only.**** MANDATORY 48HR SHOWING NOTIFICATION to coordinate appointment with tenant(s). *****ANY offers submitted without a copy of EMD, POF letter or loan approval letter will not be reviewed by the seller. ****NO assignments & NO wholesaler buyer offers will be accepted.
Key facts
- 7,840 sq ft lot
- Parking
- Built 1973
Neighborhood map
What this means for you Summary
Snapshot
- This is a 3-bed/2.0-bath single-family listed at $60k.
Deal economics
- At list price, monthly cash flow is $452 ($5k/yr) — positive.
- The deal already cash-flows at list — no discount required.
- Meets the 1% rule at list price ($1k rent vs $60k).
- Recommended offer: $55k (9.0% below list) — sets the bar for market timing.
- Cap rate 16.7% vs local median 9.9% in Jackson — top-decile yield for the area; either an underpriced asset or a hidden risk that comps aren't pricing in. Stress-test before assuming the spread holds.
Location & tenants
- Location reads 68/100 on livability (#66 in MS) — a middle-class / working-renter tenant base. Strengths: commute A+, cost of living A+, housing A+; Watch: schools F, amenities F, employment F.
- Jackson Public School District (urban): math 9% / reading 18% proficiency, ranked #112 of 130 in MS (top 86%) — low school quality limits family demand, transient renter base, plan for 1-2y turnover; 88% free/reduced lunch — lower-income household profile, screen leases tightly.
- Market conditions: 81 active listings in the ZIP; lower-income renter base — watch delinquency; 167 units permitted in Hinds County in 2024 (0 in 5+ unit buildings).
- At $1,175/mo this rent would consume 48% of the median local household income ($30k/yr) (locally 1138% of renters already pay >50% of income on rent) — very limited rent-growth headroom before tenants either downsize or default.
Forward outlook
- In year one you build about $6k of equity ($415 loan paydown + $6k appreciation (10.0% local appreciation)).
- Hinds County population projected to shrink 6% by 2050 — rents likely to lag national; underwrite the cash flow, not the appreciation.
- At projected returns (10.0% appreciation + 3.0% rent growth), your $17k cash investment doubles in ~2 years — after that, you're playing with house money.
- By year 6, paydown + projected appreciation supports a ~$38k cash-out refi (75% LTV) — recoverable capital for the next deal without selling this one.
Negotiation context
- It's been on market 96 days — a 9% lower offer ($55k) is reasonable based on typical stale-listing flexibility.
- 5 sale attempts since 19y ago; this cycle's ask has dropped $4k (7%) from the opening price — seller is motivated, your offer sets the floor, not the list.
Risks & watch-outs
- Watch-outs: flood insurance adds $66/mo.
- Climate carrying-cost: major flood risk; severe wind risk, 80% chance of damaging wind over 30y; extreme-heat days projected 7→21/yr by 2055 (HVAC capex compounding) — expect insurance premiums to compound above CPI over the hold.
Questions for the listing agent
- It's been on market 96 days. Have you received any prior offers? Is the seller open to a 9% concession, seller financing, or rate buy-down credit?
- Built in 1973 — when were the roof, HVAC, electrical panel, plumbing, and water heater last replaced?
- What's the actual annual flood-insurance premium (NFIP or private), and is the property in a SFHA with mandatory coverage?
- Why hasn't it sold? Are there any deal-killer items the seller is aware of (foundation, flood, title, zoning, code violations)?
- Is there a deadline driving the sale (1031 exchange, divorce, estate, relocation)? That informs how much negotiation room exists.
- Schools are F-rated, which usually means shorter tenancies and higher turnover. Who's the typical renter profile here, and what's been the actual vacancy rate?
- What's the average days-on-market for RENTAL listings here right now (not sales)? A rising rental-DOM trend means longer vacancies and softer asking-rent achievability than the comps imply.
- What's the recent tenant-quality profile in this submarket — average credit score on applications, eviction rate, late-payment / NSF rate, and stable-employment percentage? A property-management company in the area should have these aggregated.
- How much new for-sale + rental construction is in the pipeline within 1–3 miles? Heavy new supply typically softens prices + rents 12–24 months out; constrained supply supports both.
Investment metrics
- 1% rule
- 1.96% ✓
- Cap rate
- 16.66%
- Cash-on-cash
- 37.02%
- DSCR
- 2.65
- GRM
- 4.3
CMA / ARV
- ARV (median comp)
- $75,036
- List price
- $60,000
- Delta
- -20.04%
- Verdict
- UNDERPRICED
- Comps
- 20 within 1.0 mi
Show comp detail 4 sales within ~0.75 mi
| Address | Dist | Beds/Ba | Sqft | Sold | Price | $/sf | Match |
|---|---|---|---|---|---|---|---|
| 375 James Garfield Cir | 0.19mi | 3/1.5 | 1,076 (+9%) | 1mo | $89,900 | $84 | 74 |
| 6505 Lyndon B. Johnson Drive Dr | 0.10mi | 3/1.5 | 1,036 (+5%) | 15mo | $87,000 | $84 | 73 |
| 6603 Lyndon B Johnson Dr | 0.31mi | 3/1.0 | 1,039 (+5%) | 3mo | $89,900 | $87 | 71 |
| 6634 Lyndon B Johnson Dr | 0.39mi | 3/2.0 | 1,120 (+13%) | 6mo | $107,000 | $96 | 54 |
Match score weights: distance 35% · size 25% · config 20% · recency 20%. Top-matched comps best support the ARV.
Projected returns pro-forma
10.0% appreciation · 3.0% rent growth · sell at horizon
- IRR
- 48.9%
- Equity multiple
- 4.66×
- Total profit
- $61,510
- Equity at exit
- $54,053
- IRR
- 42.7%
- Equity multiple
- 10.44×
- Total profit
- $158,619
- Equity at exit
- $116,567
Cash invested: $16,800 (down + closing). Projections, not guarantees.
Landlord ↔ Tenant lean methodology
- Overall (STATE)
- 90 Strongly Landlord-Friendly
- State Mississippi
- 90 Strongly Landlord-Friendly · R+11
- County
- — inherits STATE
- City
- — inherits STATE
ZIP-level market 39213
- Home prices YoY
- 7.0%
- Active inventory
- 81
- Price-to-rent
- 4.3×
Monthly cashflow live
- Estimated rent
- $1,175 medium interval (Pro) →
- Mortgage (P&I)
- −$315
- Tax from tax record
- −$71 /mo · $847/yr
- Insurance
- −$25
- Flood insurance flood zone
- −$66 /mo · $798/yr
- HOA
- −$0
- Vacancy / Maint / Mgmt
- −$247
- Net cashflow
- $452
Break-even live
UW: 25.0% down · 7.5% · 30yr · 1.5% tax · 5.0% vac · 8.0% maint · 8.0% mgmt
Financing live
Cash to close
- Down payment
- $15,000
- Closing costs
- $1,800
- Reserves months
- —
- Total cash needed
- —
Loan-product check · same deal, 3 products live
Conventional
25% down · 7.5% · 30yr
- Down + closing
- —
- Monthly P&I
- —
- Monthly cashflow
- —
- DSCR
- —
- Eligible?
- —
Personal DTI + credit; lowest rate.
DSCR
20% down · 8.5% · 30yr
- Down + closing
- —
- Monthly P&I
- —
- Monthly cashflow
- —
- DSCR
- —
- Eligible?
- —
No personal income docs; deal must DSCR.
Hard money
10% down · 12.0% · 12mo
- Down + closing
- —
- Monthly P&I
- —
- Monthly cashflow
- —
- DSCR
- —
- Eligible?
- —
Short-term bridge; refi at stabilization.
Listing history 34 events
-
2026-06-18days on market $60,000 Active 96 DOM
-
2026-06-17days on market $60,000 Active 95 DOM
-
2026-06-16days on market $60,000 Active 94 DOM
-
2026-06-15days on market $60,000 Active 93 DOM
-
2026-06-14days on market $60,000 Active 91 DOM
-
2026-06-13days on market $60,000 Active 90 DOM
-
2026-06-10days on market $60,000 Active 88 DOM
-
2026-06-09days on market $60,000 Active 87 DOM
-
2026-06-08days on market $60,000 Active 86 DOM
-
2026-06-07pricedays on market $60,000 Active 85 DOM
-
2026-06-05days on market $64,500 Active 82 DOM
-
2026-06-03days on market $64,500 Active 81 DOM
-
2026-06-02days on market $64,500 Active 80 DOM
-
2026-06-01days on market $64,500 Active 79 DOM
-
2026-05-31days on market $64,500 Active 78 DOM
-
2026-05-30days on market $64,500 Active 77 DOM
-
2026-03-14$64,500 Active 521-char remark
Show marketing remark (521 chars)
Tenant occupied. Currently leased for $875. Available investment property to add or start your real estate portfolio. SOLD AS-IS, WHERE IS with NO seller repairs, warranties and/or guarantees. ***The buyer's inspection is for their awareness only.**** MANDATORY 48HR SHOWING NOTIFICATION to coordinate appointment with tenant(s). *****ANY offers submitted without a copy of EMD, POF letter or loan approval letter will not be reviewed by the seller. ****NO assignments & NO wholesaler buyer offers will be accepted.
-
2024-07-05historical $875
-
2024-05-18price $875
-
2024-03-28price $975
-
2024-03-23price $1,050
-
2024-03-15price $1,100
-
2024-03-14$1,050
-
2023-09-01historical
-
2023-03-25$68,000 Active
-
2021-10-08historical
-
2021-10-02historical
-
2021-01-05soldstatus
-
2020-10-05soldstatus
-
2018-05-22soldstatus
-
2016-11-08soldstatus
-
2010-09-27$55,000
-
2007-10-22$65,000
-
1971-07-16soldstatus
ⓘ Source: listings_history table (triggers on properties + properties_extension) + one-shot
backfill from property_details.listing_events for pre-trigger history.
Tax reassessment forecast MS · Resets to sale price
- Current annual tax
- $847 · $71/mo
- Projected year-2 tax
- $847 · $71/mo
- Expected delta
- $0/yr ($0/mo · 0.0%)
ⓘ Screening estimate from a state-policy table — verify with the county assessor before closing.
Climate risk First Street
- Flood 7/10 Severe FEMA zone X (shaded) · 95% chance over 30 yrs
- Wildfire 2/10 Low
- Heat 7/10 Severe 7 d/yr ≥107°F today · 21 d/yr by 30 yrs out
- Wind 8/10 Severe 80% chance of damaging wind over 30 yrs
- Air quality 1/10 Low 0 unhealthy d/yr today · 0 by 30 yrs out
Nearby sold comps map
Loading sold comps map…
Walkable amenities ~0.75 mi
Loading nearby amenities…
Taxation est. · year 1
- Rental income
- $14,104
- − Mortgage interest
- −$3,361
- − Property taxes
- −$847
- − Insurance
- −$1,098
- − Repairs & maintenance
- −$1,128
- − Management
- −$1,128
- − Depreciation
- −$1,745
- Taxable income
- $4,796
- Est. tax owed @ 24.0%
- −$1,151
- After-tax cash flow
- $4,271/yr
For passive investors: Depreciation is non-cash, so a rental often shows a tax loss while cash-flowing — sheltering income. Rental losses are passive: they offset passive income freely, and up to $25,000/yr can offset ordinary (W-2) income if you actively participate and your MAGI is under $100k (phasing out to $0 by $150k); unused losses carry forward. On sale, claimed depreciation is recaptured at up to 25%, and gains may owe capital-gains tax (a 1031 exchange can defer both). Figures are a year-1 estimate at your 24.0% rate — not tax advice; consult a CPA.
Schools (NCES district)
- District
- Jackson Public School District
- NCES district ID
- 2802190
- Math proficiency
- 9% ▼ -14.00%
- Reading proficiency
- 18% ▼ -7.00%
- Median HH income
- $33,234
- Composite
- 10.89/100
- National rank
- #9755
- State rank
- #112 of 130 in MS
Livability — Jackson
- Score
- 68/100
- State rank
- #66
- US rank
- #9695
Category grades
Schools grade is shown separately in the Schools card above.
Census & demographics
- Census place
- Jackson, MS
- County
- Hinds County · 167,040 people
- City population
- 140,204
- Metro
- Jackson, MS
- Population (ZIP)
- 18,691
- Household income
- $29,541
- Rent vs Own
- Severe rent burden
- 1138.0
Population outlook (Hinds County) Hauer SSP2
- Today (2025)
- 242,528 people
- By 2030
- 241,113 · -0.6%
- By 2040
- 235,557 · -2.9%
- By 2050
- 226,946 · -6.4%
- By 2075
- 199,995 · -17.5%
- By 2100
- 164,165 · -32.3%
Race, ethnicity, and origin ACS 2023
- Neighborhood character
- Predominantly Black (95%)
- Race & ethnicity
- Black 95% White 2% Two or more races 1% Hispanic / Latino 1%
- Foreign-born
- 0% · Canada
- Languages at home
- 98% English-only · Spanish 2%
Political lean MEDSL · Hinds
- 2024 margin
- Solid D (+46.1) · D 72.4% · R 26.3% · Other 1.4%
- 2008→2024 swing
- +7.1pp toward D · 2008: 39.0pp · 2024: 46.1pp
- All cycles
- 2024: D+46.1 2020: D+48.3 2016: D+43.7 2012: D+45.1 2008: D+39.0
Not yet ingested
- Civics
- —
Market trends
- HPI YoY
- ▲ 21.42%
- Current HPI
- 329.1844
- Rent YoY
- —
- Metro
- Jackson, MS
- State GDP YoY
- —
- F500 in state
- 0
Price history
-0.8% since first listed18 events — show timeline
- 2026-03-14 Listed $64,500 MLSU
- 2024-07-05 Rental Removed $875 BUILDIUM
- 2024-05-18 Price Changed $875 BUILDIUM
- 2024-03-28 Price Changed $975 BUILDIUM
- 2024-03-23 Price Changed $1,050 BUILDIUM
- 2024-03-15 Price Changed $1,100 BUILDIUM
- 2024-03-14 Listed for Rent $1,050 BUILDIUM
- 2023-09-01 Listing Removed — MLSU
- 2023-03-25 Listed $68,000 MLSU
- 2021-10-08 Listing Removed — MLSU
- 2021-10-02 Listing Removed — MLSU
- 2021-01-05 Sold (Public Records) — Public Records
- 2020-10-05 Sold (Public Records) — Public Records
- 2018-05-22 Sold (Public Records) — Public Records
- 2016-11-08 Sold (Public Records) — Public Records
- 2010-09-27 Listed $55,000 MLSU
- 2007-10-22 Listed $65,000 MLSU
- 1971-07-16 Sold (Public Records) — Public Records
Property tax history
-2.6%/yrLatest (2025): $847 · +1.4% YoY. Source: county tax records.
Cash-flow waterfall
monthlySold comps — $/sqft
last 12 mo · ≤1 miLoading sold comps…