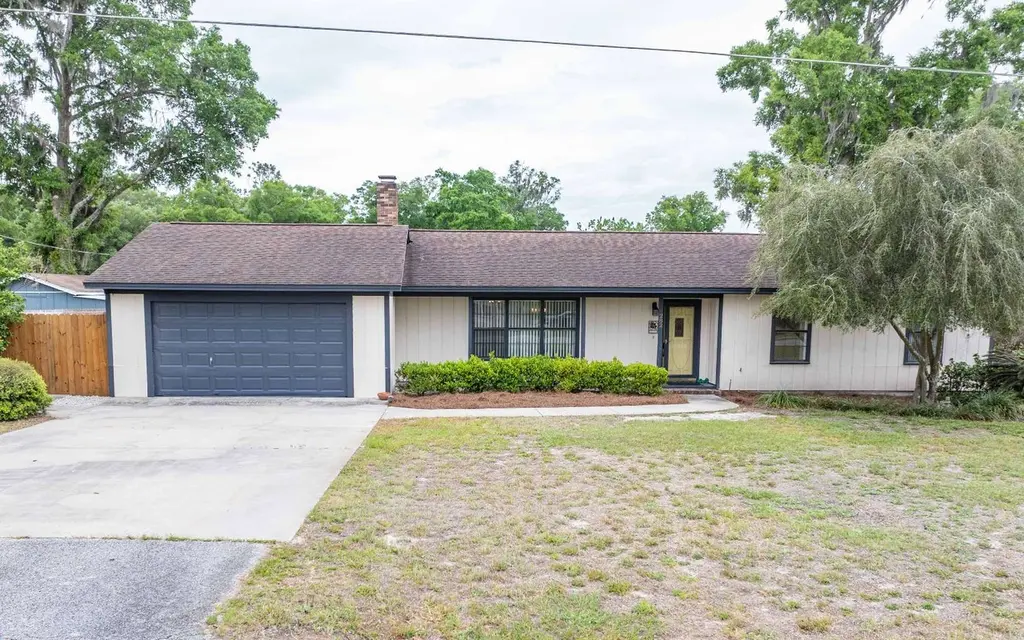
282 SE Mojave Way · Lake City, FL
Flood risk 1/10 · Minimal
- FEMA flood zone
- X (unshaded)
- Chance of flooding over 30 yrs
- 0.0%
- Est. flood insurance / yr
- $507 – $1,088
Fire risk 6/10 · Moderate
- Est. fire insurance / yr
- $947 – $1,759
Heat risk 8/10 · Major
- Hot days now (above 107°F)
- 7 days/yr
- Hot days in 30 yrs
- 20 days/yr
Wind risk 9/10 · Severe
- Chance of severe wind over 30 yrs
- 99.0%
Air-quality risk 5/10 · Moderate
- Unhealthy air days now
- 8 days/yr
- Unhealthy air days in 30 yrs
- 8 days/yr
Risk factors via First Street. Map © Google.
Why this score? — see what drove the D grade
The composite is a weighted blend of 9 inputs, each scored 0–100. Each bar is that input's sub-score; the figure is the points it added to the 100-point composite (weight × sub-score).
- Appreciation +10.0/10.0
- Cash flow +8.0/30.0
- ARV discount +6.7/15.0
- Schools +4.5/10.0
- Livability +3.7/5.0
- Rent growth +2.5/5.0
- Condition / age +2.5/5.0
- 1% rule +2.2/10.0
- DSCR +2.1/10.0
$249,900
🖨 Deal sheet (PDF) 📄 Offer letter ✓ Due diligence
Listing remarks MLS
Charming pool home. Wonderful family home offering a large family room with a wood burning fireplace, dining room, updated kitchen with new appliances, countertops and sink, oversized utility room with extra space for storage, new laminate flooring, screened in back porch, in-ground pool, fenced back yard and freshly painted exterior.
Key facts
- Rv parking
- Detached garage
- 0.45 acre lot
Tags
Property features AI
Exterior
- Parking: Attached or detached 2-car garage
- Home design: Residential property; Single-story
- Construction: Frame construction; Shingle roof
- Exterior features: Screened patio/porch; Chain link and wood fencing; In-ground pool
Interior
- Kitchen: Electric cooktop; Refrigerator
- Flooring: Laminate
- Bathrooms: 2 full bathrooms
- Heating & cooling: Central heating (electric); Central air conditioning
- Interior features: Wood-burning fireplace; Ceiling fan(s)
- Laundry & utility: Washer; Dryer
Neighborhood map
What this means for you Summary
Snapshot
- This is a 3-bed/2.0-bath single-family listed at $250k.
Deal economics
- At list price, monthly cash flow is $-251 ($-3k/yr) — negative.
- To cash-flow at today's rent, offer at most $206k (17.8% below list).
- To meet the 1% rule (rent ≥ 1% of price), the offer needs to be $181k (27.8% below list).
- Recommended offer: $181k (27.8% below list) — sets the bar for 1% rule.
- Cap rate 5.1% vs local median 3.8% in Lake City — top-decile yield for the area; either an underpriced asset or a hidden risk that comps aren't pricing in. Stress-test before assuming the spread holds.
Location & tenants
- Location reads 73/100 on livability (#304 in FL) — a middle-class / working-renter tenant base. Strengths: cost of living A+, housing A+, health & safety A+; Watch: amenities C-, commute F, employment F.
- Columbia (town): math 53% / reading 54% proficiency, ranked #25 of 73 in FL (top 34%) — acceptable for families but not a draw, mixed tenant base, ~2y average lease.
- Zoned schools: Melrose Park Elementary School (math 27% / reading 32%, grade F, #1,896 of 2,144 statewide, top 90%, 398 students, 84% FRL); Columbia High School (math 28% / reading 45%, grade F, #351 of 667 statewide, top 54%, 1,737 students, 50% FRL).
- Zoned-school proficiency averages 33% at this address vs 54% district-wide (-20 pts) — the specific schools serving this property underperform the Columbia average; the district grade overstates school quality for this exact location.
- Market conditions: 146 active listings in the ZIP; 178 units permitted in Columbia County in 2024 (0 in 5+ unit buildings).
- This rent runs 39% of the median local income ($55k/yr) — at the standard rent-burdened threshold; future hikes will face affordability resistance.
Forward outlook
- In year one you build about $27k of equity ($2k loan paydown + $25k appreciation (10.0% local appreciation)).
- Columbia County population projected to shrink 7% by 2050 — rents likely to lag national; underwrite the cash flow, not the appreciation.
- By year 2, paydown + projected appreciation supports a ~$43k cash-out refi (75% LTV) — recoverable capital for the next deal without selling this one.
Negotiation context
- It's been on market 75 days — a 6% lower offer ($235k) is reasonable based on typical stale-listing flexibility.
- Current owner paid $188k; 33% above their basis — modest negotiation headroom, anchor on the comps not their cost.
Risks & watch-outs
- Climate carrying-cost: severe wind risk, 99% chance of damaging wind over 30y; major wildfire risk; extreme-heat days projected 7→20/yr by 2055 (HVAC capex compounding) — expect insurance premiums to compound above CPI over the hold.
Questions for the listing agent
- What do current leases actually rent for vs. the listed asking? Can we see a recent rent roll and the last 12 months of T-12 income?
- It's been on market 75 days. Have you received any prior offers? Is the seller open to a 28% concession, seller financing, or rate buy-down credit?
- Why hasn't it sold? Are there any deal-killer items the seller is aware of (foundation, flood, title, zoning, code violations)?
- Is there a deadline driving the sale (1031 exchange, divorce, estate, relocation)? That informs how much negotiation room exists.
- Schools are B-rated — typically a magnet for longer-tenancy family renters. What's the average tenant stay here, and is there a school-zone premium baked into asking?
- The area grade is low — what's the realistic commute time and amenity access for the typical tenant pool here? Any planned neighborhood developments (good or bad) we should know about?
- What's the average days-on-market for RENTAL listings here right now (not sales)? A rising rental-DOM trend means longer vacancies and softer asking-rent achievability than the comps imply.
- What's the recent tenant-quality profile in this submarket — average credit score on applications, eviction rate, late-payment / NSF rate, and stable-employment percentage? A property-management company in the area should have these aggregated.
- How much new for-sale + rental construction is in the pipeline within 1–3 miles? Heavy new supply typically softens prices + rents 12–24 months out; constrained supply supports both.
Investment metrics
- 1% rule
- 0.72% ✗
- Cap rate
- 5.09%
- Cash-on-cash
- -4.31%
- DSCR
- 0.81
- GRM
- 11.5
CMA / ARV
- ARV (on-the-fly)
- $245,588
- Comps found
- 9
Show comp detail 9 sales within ~0.75 mi
| Address | Dist | Beds/Ba | Sqft | Sold | Price | $/sf | Match |
|---|---|---|---|---|---|---|---|
| 190 SE Cherokee Way | 0.11mi | 3/2.0 | 1,421 (+4%) | 18mo | $300,000 | $211 | 74 |
| 242 SE Jonathan Way | 0.20mi | 3/2.0 | 1,416 (+3%) | 22mo | $235,000 | $166 | 67 |
| 145 SE Mohawk Way | 0.17mi | 3/2.0 | 1,453 (+6%) | 19mo | $220,000 | $151 | 67 |
| 264 SE Forest Ter | 0.29mi | 3/2.0 | 1,540 (+12%) | 3mo | $155,000 | $101 | 63 |
| 299 SE Forest Ter | 0.32mi | 3/2.0 | 1,508 (+10%) | 7mo | $270,000 | $179 | 63 |
| 257 SE Forest Ter | 0.29mi | 3/2.0 | 1,508 (+10%) | 11mo | $273,000 | $181 | 61 |
| 237 SE Polk Ln | 0.39mi | 3/2.0 | 1,232 (-10%) | 10mo | $221,000 | $179 | 57 |
| 156 SE Polk Ln | 0.46mi | 3/2.0 | 1,211 (-12%) | 3mo | $221,000 | $182 | 56 |
| 308 SE Gregory Gln | 0.56mi | 3/2.0 | 1,262 (-8%) | 16mo | $270,000 | $214 | 47 |
Match score weights: distance 35% · size 25% · config 20% · recency 20%. Top-matched comps best support the ARV.
Projected returns pro-forma
10.0% appreciation · 3.0% rent growth · sell at horizon
- IRR
- 21.2%
- Equity multiple
- 2.72×
- Total profit
- $120,102
- Equity at exit
- $225,130
- IRR
- 19.2%
- Equity multiple
- 6.23×
- Total profit
- $366,253
- Equity at exit
- $485,501
Cash invested: $69,972 (down + closing). Projections, not guarantees.
Landlord ↔ Tenant lean methodology
- Overall (STATE)
- 87 Strongly Landlord-Friendly
- State Florida
- 87 Strongly Landlord-Friendly · R+3
- County
- — inherits STATE
- City
- — inherits STATE
ZIP-level market 32025
- Home prices YoY
- 6.8%
- Active inventory
- 146
- Price-to-rent
- 11.5×
Monthly cashflow live
- Estimated rent
- $1,805 medium interval (Pro) →
- Mortgage (P&I)
- −$1,311
- Tax from tax record
- −$263 /mo · $3,152/yr
- Insurance
- −$104
- HOA
- −$0
- Vacancy / Maint / Mgmt
- −$379
- Net cashflow
- $-251
Break-even live
Sensitivity live
| Price | -10% $-110 | -5% $-180 | +0% $-251 | +5% $-322 | +10% $-393 |
|---|---|---|---|---|---|
| Rent | -10% $-394 | -5% $-322 | +0% $-251 | +5% $-180 | +10% $-109 |
| Rate | -1.0pp $-125 | -0.5pp $-188 | base $-251 | +0.5pp $-316 | +1.0pp $-382 |
UW: 25.0% down · 7.5% · 30yr · 1.5% tax · 5.0% vac · 8.0% maint · 8.0% mgmt
Financing live
Cash to close
- Down payment
- $62,475
- Closing costs
- $7,497
- Reserves months
- —
- Total cash needed
- —
Loan-product check · same deal, 3 products live
Conventional
25% down · 7.5% · 30yr
- Down + closing
- —
- Monthly P&I
- —
- Monthly cashflow
- —
- DSCR
- —
- Eligible?
- —
Personal DTI + credit; lowest rate.
DSCR
20% down · 8.5% · 30yr
- Down + closing
- —
- Monthly P&I
- —
- Monthly cashflow
- —
- DSCR
- —
- Eligible?
- —
No personal income docs; deal must DSCR.
Hard money
10% down · 12.0% · 12mo
- Down + closing
- —
- Monthly P&I
- —
- Monthly cashflow
- —
- DSCR
- —
- Eligible?
- —
Short-term bridge; refi at stabilization.
Listing history 21 events
-
2026-06-21statusdays on market $249,900 Active 75 DOM
-
2026-06-19days on market $249,900 Active Under Contract 73 DOM
-
2026-06-18days on market $249,900 Active Under Contract 72 DOM
-
2026-06-17days on market $249,900 Active Under Contract 71 DOM
-
2026-06-16days on market $249,900 Active Under Contract 70 DOM
-
2026-06-15days on market $249,900 Active Under Contract 69 DOM
-
2026-06-14days on market $249,900 Active Under Contract 67 DOM
-
2026-06-12statusdays on market $249,900 Active Under Contract 66 DOM
-
2026-06-09days on market $249,900 Active 63 DOM
-
2026-06-08days on market $249,900 Active 62 DOM
-
2026-06-07days on market $249,900 Active 61 DOM
-
2026-06-05days on market $249,900 Active 58 DOM
-
2026-06-03days on market $249,900 Active 57 DOM
-
2026-06-02days on market $249,900 Active 56 DOM
-
2026-06-01days on market $249,900 Active 55 DOM
-
2026-05-31days on market $249,900 Active 54 DOM
-
2026-05-30days on market $249,900 Active 53 DOM
-
2026-05-08price $259,900
-
2026-04-07$270,000 Active
-
2021-04-06soldstatus $187,571
-
2021-02-18soldstatus $189,000 336-char remark
Show marketing remark (336 chars)
Charming pool home. Wonderful family home offering a large family room with a wood burning fireplace, dining room, updated kitchen with new appliances, countertops and sink, oversized utility room with extra space for storage, new laminate flooring, screened in back porch, in-ground pool, fenced back yard and freshly painted exterior.
ⓘ Source: listings_history table (triggers on properties + properties_extension) + one-shot
backfill from property_details.listing_events for pre-trigger history.
Tax reassessment forecast FL · Resets to sale price
- Current annual tax
- $3,152 · $263/mo
- Projected year-2 tax
- $3,152 · $263/mo
- Expected delta
- $0/yr ($0/mo · 0.0%)
ⓘ Screening estimate from a state-policy table — verify with the county assessor before closing.
Climate risk First Street
- Flood 1/10 Low FEMA zone X (unshaded) · 0% chance over 30 yrs
- Wildfire 6/10 Major
- Heat 8/10 Severe 7 d/yr ≥107°F today · 20 d/yr by 30 yrs out
- Wind 9/10 Extreme 99% chance of damaging wind over 30 yrs
- Air quality 5/10 Major 8 unhealthy d/yr today · 8 by 30 yrs out
Nearby sold comps map
Loading sold comps map…
Walkable amenities ~0.75 mi
Loading nearby amenities…
Taxation est. · year 1
- Rental income
- $21,663
- − Mortgage interest
- −$13,998
- − Property taxes
- −$3,152
- − Insurance
- −$1,250
- − Repairs & maintenance
- −$1,733
- − Management
- −$1,733
- − Depreciation
- −$7,270
- Taxable loss
- −$7,473
- Est. tax savings @ 24.0%
- +$1,794
- After-tax cash flow
- $-1,221/yr
For passive investors: Depreciation is non-cash, so a rental often shows a tax loss while cash-flowing — sheltering income. Rental losses are passive: they offset passive income freely, and up to $25,000/yr can offset ordinary (W-2) income if you actively participate and your MAGI is under $100k (phasing out to $0 by $150k); unused losses carry forward. On sale, claimed depreciation is recaptured at up to 25%, and gains may owe capital-gains tax (a 1031 exchange can defer both). Figures are a year-1 estimate at your 24.0% rate — not tax advice; consult a CPA.
Schools (NCES district)
- District
- Columbia
- NCES district ID
- 1200360
- Math proficiency
- 53% ▼ -10.00%
- Reading proficiency
- 54% ▼ -3.00%
- Median HH income
- $40,053
- Composite
- 44.74/100
- National rank
- #2750
- State rank
- #25 of 73 in FL
Livability — Lake City
- Score
- 73/100
- State rank
- #304
- US rank
- #5154
Category grades
Schools grade is shown separately in the Schools card above.
Census & demographics
- County
- Columbia County · 40,507 people
- City population
- 40,507
- Metro
- Lake City, FL
- Population (ZIP)
- 22,948
- Household income
- $55,004
- Rent vs Own
- Severe rent burden
- 754.0
Population outlook (Columbia County) Hauer SSP2
- Today (2025)
- 68,129 people
- By 2030
- 67,501 · -0.9%
- By 2040
- 65,465 · -3.9%
- By 2050
- 63,058 · -7.4%
- By 2075
- 56,291 · -17.4%
- By 2100
- 45,243 · -33.6%
Race, ethnicity, and origin ACS 2023
- Neighborhood character
- Predominantly White (67%)
- Race & ethnicity
- White 67% Black 20% Hispanic / Latino 8% Two or more races 7%
- Hispanic origin (detail)
- Mexican 1% Puerto Rican 3% Cuban 1%
- Common ancestry
- Serbian 2% Lithuanian 2% Romanian 2%
- Foreign-born
- 3% · Canada
- Languages at home
- 91% English-only · Spanish 6% French/Haitian/Cajun 2%
Political lean MEDSL · Columbia
- 2024 margin
- Solid R (+50.2) · D 24.6% · R 74.7%
- 2008→2024 swing
- -16.4pp toward R · 2008: -33.8pp · 2024: -50.2pp
- All cycles
- 2024: R+50.2 2020: R+45.2 2016: R+44.5 2012: R+36.7 2008: R+33.8
Not yet ingested
- Civics
- —
Market trends
- HPI YoY
- ▲ 17.57%
- Current HPI
- 276.7253
- Rent YoY
- —
- Metro
- Lake City, FL
- State GDP YoY
- ▲ 3.28%
- F500 in state
- 36
Industry mix (Fortune 500 HQ in FL)
| Industry | F500 HQs | Revenue |
|---|---|---|
| Industrial Technology | 2 | $29B |
|
||
| Insurance | 2 | $17B |
|
||
| Retail | 1 | $60B |
|
||
| Technology Distribution | 1 | $58B |
|
||
| Homebuilding | 1 | $35B |
|
||
| Technology Manufacturing | 1 | $35B |
|
||
Price history
+37.5% since first listed4 events — show timeline
- 2026-05-08 Price Changed $259,900 NFMLS
- 2026-04-07 Listed $270,000 NFMLS
- 2021-04-06 Sold (Public Records) $187,571 Public Records
- 2021-02-18 Sold (MLS) $189,000 NFMLS
Property tax history
+10.7%/yrLatest (2025): $3,152 · +0.6% YoY. Source: county tax records.
Cash-flow waterfall
monthlySold comps — $/sqft
last 12 mo · ≤1 miLoading sold comps…