 Multi-family
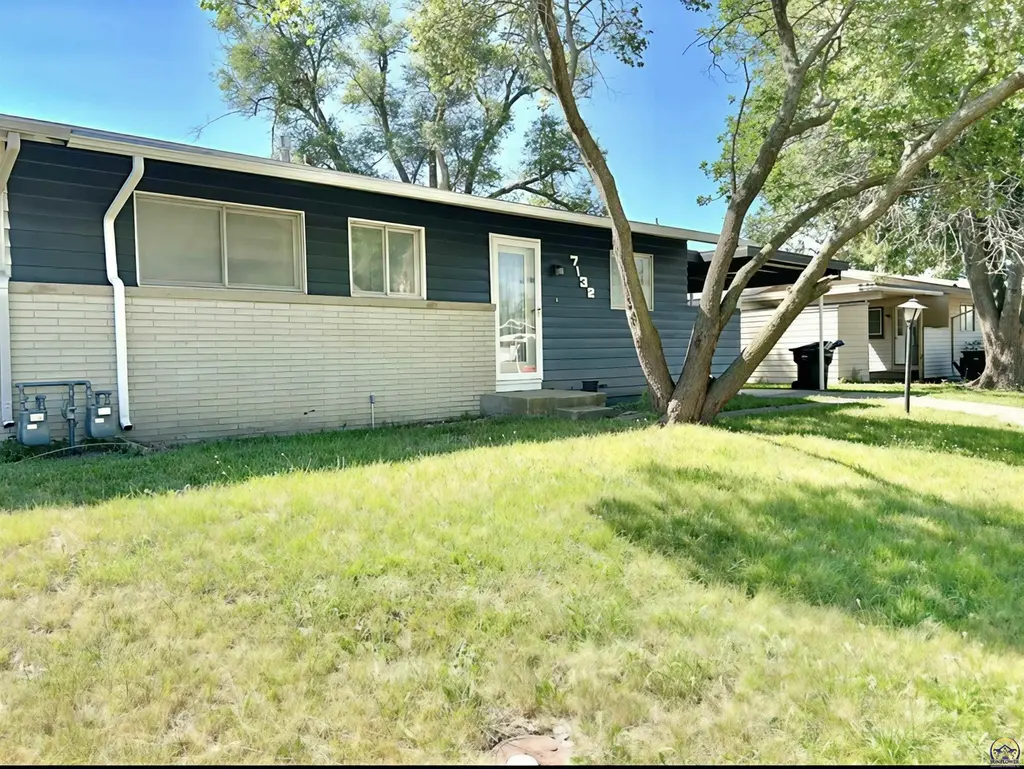
7132 SW Lario Ln · Topeka, KS
Flood risk 1/10 · Minimal
- FEMA flood zone
- X (unshaded)
- Chance of flooding over 30 yrs
- 0.0%
- Est. flood insurance / yr
- $507 – $1,088
Fire risk 3/10 · Minor
- Est. fire insurance / yr
- $1,154 – $2,142
Heat risk 5/10 · Moderate
- Hot days now (above 107°F)
- 7 days/yr
- Hot days in 30 yrs
- 17 days/yr
Wind risk 2/10 · Minimal
- Chance of severe wind over 30 yrs
- —
Air-quality risk 3/10 · Minor
- Unhealthy air days now
- 3 days/yr
- Unhealthy air days in 30 yrs
- 4 days/yr
Risk factors via First Street. Map © Google.
Why this score? — see what drove the B grade
The composite is a weighted blend of 9 inputs, each scored 0–100. Each bar is that input's sub-score; the figure is the points it added to the 100-point composite (weight × sub-score).
- Cash flow +30.0/30.0
- 1% rule +10.0/10.0
- DSCR +10.0/10.0
- ARV discount +7.5/15.0
- Schools +3.5/10.0
- Livability +3.5/5.0
- Appreciation +3.3/10.0
- Rent growth +2.5/5.0
- Condition / age +2.5/5.0
$93,500
🖨 Deal sheet (PDF) 📄 Offer letter ✓ Due diligence
Multi-family units
County records classify this as Multi-Family (2-4 Unit). Listing-text estimate: 1 unit. estimate disagrees with records
Listing remarks MLS
Nice 2 bedroom Ranch. Eat in kitchen, large living room. Located close to shopping and dining. Nice level fenced yard. This is a homepath property.
Key facts
- Kitchen countertop
- Carport
- Large level lot
Tags
Property features AI
Finance
- Other: Property taxes listed (not included as financial detail)
Exterior
- Parking: Carport
- Utilities: Public water; Public sewer
- Home design: Residential half-duplex; Single-story (above grade finished area 924)
- Construction: Frame construction
- Exterior features: Public water; Public sewer; Lot in Montara subdivision
Interior
- Kitchen: Electric range; Refrigerator
- Flooring: Vinyl
- Bathrooms: 1 full bathroom
- Heating & cooling: Central air
- Interior features: Electric range; Refrigerator; Vinyl flooring; Central air conditioning
- Laundry & utility: Laundry on main level
Neighborhood map
What this means for you Summary
Snapshot
- This is a 2-bed/1.0-bath multifamily listed at $94k.
Deal economics
- At list price, monthly cash flow is $1k ($17k/yr) — positive.
- The deal already cash-flows at list — no discount required.
- Meets the 1% rule at list price ($3k rent vs $94k).
- Recommended offer: $88k (6.0% below list) — sets the bar for market timing.
- Cap rate 24.0% vs local median 4.3% in Topeka — top-decile yield for the area; either an underpriced asset or a hidden risk that comps aren't pricing in. Stress-test before assuming the spread holds.
Location & tenants
- Location reads 69/100 on livability (#195 in KS) — a middle-class / working-renter tenant base. Strengths: cost of living A+, housing A+, health & safety A+; Watch: employment C-, crime F, commute F.
- Auburn Washburn (rural): math 34% / reading 42% proficiency, ranked #29 of 169 in KS (top 17%) — families likely to look elsewhere, expect single-tenant / working-renter base with shorter leases.
- Zoned schools: Pauline Central Primary (math 22% / reading 27%, grade F, #540 of 684 statewide, top 82%, 410 students, 74% FRL); Washburn Rural Middle School (math 28% / reading 31%, grade F, #72 of 219 statewide, top 38%, 943 students, 36% FRL); Washburn Rural High (math 25% / reading 30%, grade F, #83 of 327 statewide, top 25%, 1,884 students, 31% FRL) — zoned schools average 47% FRL vs 24% district-wide (23 pts higher); higher-poverty schools than district average — tighter screening recommended.
- Market conditions: 6 active listings in the ZIP; 219 units permitted in Shawnee County in 2024 (25 in 5+ unit buildings).
Forward outlook
- Local home prices are declining (-3.0%/yr); year-one equity from $646 of loan paydown is wiped out by about $3k of value loss. Plan a longer hold.
- Shawnee County population projected to shrink 7% by 2050 — rents likely to lag national; underwrite the cash flow, not the appreciation.
- At projected returns (-3.0% appreciation + 3.0% rent growth), your $26k cash investment doubles in ~2 years — after that, you're playing with house money.
Negotiation context
- It's been on market 78 days — a 6% lower offer ($88k) is reasonable based on typical stale-listing flexibility.
- 4 sale attempts since 12y ago; this cycle's ask has dropped $6k (6%) from the opening price — seller is motivated, your offer sets the floor, not the list.
- Current owner paid $26k; list at $94k implies a 260% gain — meaningful room to come down on a strong offer.
Risks & watch-outs
- Climate carrying-cost: extreme-heat days projected 7→17/yr by 2055 (HVAC capex compounding) — expect insurance premiums to compound above CPI over the hold.
Questions for the listing agent
- It's been on market 78 days. Have you received any prior offers? Is the seller open to a 6% concession, seller financing, or rate buy-down credit?
- Built in 1962 — when were the roof, HVAC, electrical panel, plumbing, and water heater last replaced?
- Why hasn't it sold? Are there any deal-killer items the seller is aware of (foundation, flood, title, zoning, code violations)?
- Is there a deadline driving the sale (1031 exchange, divorce, estate, relocation)? That informs how much negotiation room exists.
- Schools are D-rated, which usually means shorter tenancies and higher turnover. Who's the typical renter profile here, and what's been the actual vacancy rate?
- Crime grade is F in this area — have there been break-ins, vandalism, or insurance claims at this property in the last 3 years? What carrier currently insures it and at what premium?
- What's the average days-on-market for RENTAL listings here right now (not sales)? A rising rental-DOM trend means longer vacancies and softer asking-rent achievability than the comps imply.
- What's the recent tenant-quality profile in this submarket — average credit score on applications, eviction rate, late-payment / NSF rate, and stable-employment percentage? A property-management company in the area should have these aggregated.
- How much new apartment / multifamily construction is in the pipeline within 1–3 miles? Heavy new supply (>2% of stock underway) typically softens rents 12–24 months out; light construction supports rent growth.
Investment metrics
- 1% rule
- 2.70% ✓
- Cap rate
- 24.02%
- Cash-on-cash
- 63.32%
- DSCR
- 3.82
- GRM
- 3.1
CMA / ARV
No comps found within radius.
Projected returns pro-forma
-3.0% appreciation · 3.0% rent growth · sell at horizon
- IRR
- 62.3%
- Equity multiple
- 3.78×
- Total profit
- $72,851
- Equity at exit
- $13,941
- IRR
- 66.9%
- Equity multiple
- 7.75×
- Total profit
- $176,805
- Equity at exit
- $8,084
Cash invested: $26,180 (down + closing). Projections, not guarantees.
Landlord ↔ Tenant lean methodology
- Overall (STATE)
- 83 Strongly Landlord-Friendly
- State Kansas
- 83 Strongly Landlord-Friendly · R+10
- County
- — inherits STATE
- City
- — inherits STATE
ZIP-level market 66619
- Home prices YoY
- -1.4%
- Active inventory
- 6
- Price-to-rent
- 6.2×
Monthly cashflow live
- Estimated rent
- $2,526 medium interval (Pro) →
- Mortgage (P&I)
- −$490
- Tax from tax record
- −$85 /mo · $1,018/yr
- Insurance
- −$39
- HOA
- −$0
- Vacancy / Maint / Mgmt
- −$530
- Net cashflow
- $1,381
Break-even live
Sensitivity live
| Price | -10% $1,434 | -5% $1,408 | +0% $1,381 | +5% $1,355 | +10% $1,328 |
|---|---|---|---|---|---|
| Rent | -10% $1,182 | -5% $1,282 | +0% $1,381 | +5% $1,481 | +10% $1,581 |
| Rate | -1.0pp $1,429 | -0.5pp $1,405 | base $1,381 | +0.5pp $1,357 | +1.0pp $1,333 |
2-unit breakdown (identical units grouped — click to expand)
| Units | Beds | Baths | Est. rent |
|---|---|---|---|
| 2× units | 2 | 1 | $2,526 |
| #1 | 2 | 1 | $1,263 |
| #2 | 2 | 1 | $1,263 |
| Total (2 units) | $2,526 | ||
UW: 25.0% down · 7.5% · 30yr · 1.5% tax · 5.0% vac · 8.0% maint · 8.0% mgmt
Financing live
Cash to close
- Down payment
- $23,375
- Closing costs
- $2,805
- Reserves months
- —
- Total cash needed
- —
Loan-product check · same deal, 3 products live
Conventional
25% down · 7.5% · 30yr
- Down + closing
- —
- Monthly P&I
- —
- Monthly cashflow
- —
- DSCR
- —
- Eligible?
- —
Personal DTI + credit; lowest rate.
DSCR
20% down · 8.5% · 30yr
- Down + closing
- —
- Monthly P&I
- —
- Monthly cashflow
- —
- DSCR
- —
- Eligible?
- —
No personal income docs; deal must DSCR.
Hard money
10% down · 12.0% · 12mo
- Down + closing
- —
- Monthly P&I
- —
- Monthly cashflow
- —
- DSCR
- —
- Eligible?
- —
Short-term bridge; refi at stabilization.
Listing history 32 events
-
2026-06-21days on market $93,500 Active 78 DOM
-
2026-06-19days on market $93,500 Active 76 DOM
-
2026-06-18days on market $93,500 Active 75 DOM
-
2026-06-17days on market $93,500 Active 74 DOM
-
2026-06-16days on market $93,500 Active 73 DOM
-
2026-06-15days on market $93,500 Active 72 DOM
-
2026-06-14days on market $93,500 Active 70 DOM
-
2026-06-13pricedays on market $93,500 Active 69 DOM
-
2026-06-10days on market $94,500 Active 67 DOM
-
2026-06-09days on market $94,500 Active 66 DOM
-
2026-06-08days on market $94,500 Active 65 DOM
-
2026-06-07days on market $94,500 Active 64 DOM
-
2026-06-03days on market $94,500 Active 60 DOM
-
2026-06-02days on market $94,500 Active 59 DOM
-
2026-06-01days on market $94,500 Active 58 DOM
-
2026-06-01price $94,500 Active 57 DOM
-
2026-05-31days on market $95,500 Active 57 DOM
-
2026-05-30days on market $95,500 Active 56 DOM
-
2026-05-22price $95,500
-
2026-05-15price $96,500
-
2026-05-08price $97,500
-
2026-04-30price $98,500
-
2026-04-05$99,500 Active
-
2025-07-31historical $1,050
-
2025-07-26$1,050
-
2025-07-02price $94,900
-
2024-04-25historical $900
-
2024-04-16$900
-
2022-06-25price $715
-
2014-07-17soldstatus 147-char remark
Show marketing remark (147 chars)
Nice 2 bedroom Ranch. Eat in kitchen, large living room. Located close to shopping and dining. Nice level fenced yard. This is a homepath property.
-
2014-05-21$36,000 147-char remark
Show marketing remark (147 chars)
Nice 2 bedroom Ranch. Eat in kitchen, large living room. Located close to shopping and dining. Nice level fenced yard. This is a homepath property.
-
1995-04-01soldstatus $26,000
ⓘ Source: listings_history table (triggers on properties + properties_extension) + one-shot
backfill from property_details.listing_events for pre-trigger history.
Tax reassessment forecast KS · Resets to sale price
- Current annual tax
- $1,018 · $85/mo
- Projected year-2 tax
- $1,318 · $110/mo
- Expected delta
- +$300/yr (+$25/mo · 29.5%)
ⓘ Screening estimate from a state-policy table — verify with the county assessor before closing.
Climate risk First Street
- Flood 1/10 Low FEMA zone X (unshaded) · 0% chance over 30 yrs
- Wildfire 3/10 Moderate
- Heat 5/10 Major 7 d/yr ≥107°F today · 17 d/yr by 30 yrs out
- Wind 2/10 Low
- Air quality 3/10 Moderate 3 unhealthy d/yr today · 4 by 30 yrs out
Nearby sold comps map
Loading sold comps map…
Walkable amenities ~0.75 mi
Loading nearby amenities…
Taxation est. · year 1
- Rental income
- $30,312
- − Mortgage interest
- −$5,237
- − Property taxes
- −$1,018
- − Insurance
- −$468
- − Repairs & maintenance
- −$2,425
- − Management
- −$2,425
- − Depreciation
- −$2,720
- Taxable income
- $16,019
- Est. tax owed @ 24.0%
- −$3,845
- After-tax cash flow
- $12,732/yr
For passive investors: Depreciation is non-cash, so a rental often shows a tax loss while cash-flowing — sheltering income. Rental losses are passive: they offset passive income freely, and up to $25,000/yr can offset ordinary (W-2) income if you actively participate and your MAGI is under $100k (phasing out to $0 by $150k); unused losses carry forward. On sale, claimed depreciation is recaptured at up to 25%, and gains may owe capital-gains tax (a 1031 exchange can defer both). Figures are a year-1 estimate at your 24.0% rate — not tax advice; consult a CPA.
Schools (NCES district)
- District
- Auburn Washburn
- NCES district ID
- 2003200
- Math proficiency
- 34% ▼ -8.00%
- Reading proficiency
- 42% ▼ -5.00%
- Median HH income
- $71,903
- Composite
- 34.91/100
- National rank
- #5073
- State rank
- #29 of 169 in KS
Livability — Topeka
- Score
- 69/100
- State rank
- #195
- US rank
- #8848
Category grades
Schools grade is shown separately in the Schools card above.
Census & demographics
- City population
- 118,130
- Population (ZIP)
- 3,069
Population outlook (Shawnee County) Hauer SSP2
- Today (2025)
- 179,277 people
- By 2030
- 177,762 · -0.8%
- By 2040
- 172,341 · -3.9%
- By 2050
- 166,330 · -7.2%
- By 2075
- 152,417 · -15.0%
- By 2100
- 134,782 · -24.8%
Race, ethnicity, and origin ACS 2023
- Neighborhood character
- Diverse neighborhood (Simpson 0.57)
- Race & ethnicity
- White 59% Black 27% Hispanic / Latino 8% Two or more races 6%
- Hispanic origin (detail)
- Mexican 8%
- Common ancestry
- Romanian 4% Serbian 1%
- Languages at home
- 99% English-only · Spanish 1%
Political lean MEDSL · Shawnee
- 2024 margin
- Toss-up / Even · D 49.3% · R 48.8% · Other 2.0%
- 2008→2024 swing
- +0.8pp no change · 2008: -0.3pp · 2024: 0.5pp
- All cycles
- 2024: D+0.5 2020: D+3.0 2016: R+2.8 2012: R+1.7 2008: R+0.3
Not yet ingested
- Civics
- —
Market trends
- HPI YoY
- ▼ -3.31%
- Current HPI
- 233.9724
- Rent YoY
- —
- Metro
- —
- State GDP YoY
- —
- F500 in state
- 0
Price history
+267.3% since first listed14 events — show timeline
- 2026-05-22 Price Changed $95,500 Sunflower MLS as distributed by MLS GRID
- 2026-05-15 Price Changed $96,500 Sunflower MLS as distributed by MLS GRID
- 2026-05-08 Price Changed $97,500 Sunflower MLS as distributed by MLS GRID
- 2026-04-30 Price Changed $98,500 Sunflower MLS as distributed by MLS GRID
- 2026-04-05 Listed $99,500 Sunflower MLS as distributed by MLS GRID
- 2025-07-31 Rental Removed $1,050 TENANTTURNER2
- 2025-07-26 Listed for Rent $1,050 TENANTTURNER2
- 2025-07-02 Price Changed $94,900 Sunflower MLS as distributed by MLS GRID
- 2024-04-25 Rental Removed $900 APPFOLIO
- 2024-04-16 Listed for Rent $900 APPFOLIO
- 2022-06-25 Price Changed $715 RENT.
- 2014-07-17 Sold (MLS) — Sunflower MLS as distributed by MLS GRID
- 2014-05-21 Listed $36,000 Sunflower MLS as distributed by MLS GRID
- 1995-04-01 Sold (Public Records) $26,000 Public Records
Property tax history
+4.0%/yrLatest (2025): $1,018 · +8.3% YoY. Source: county tax records.
Cash-flow waterfall
monthlySold comps — $/sqft
last 12 mo · ≤1 miLoading sold comps…