 Duplex
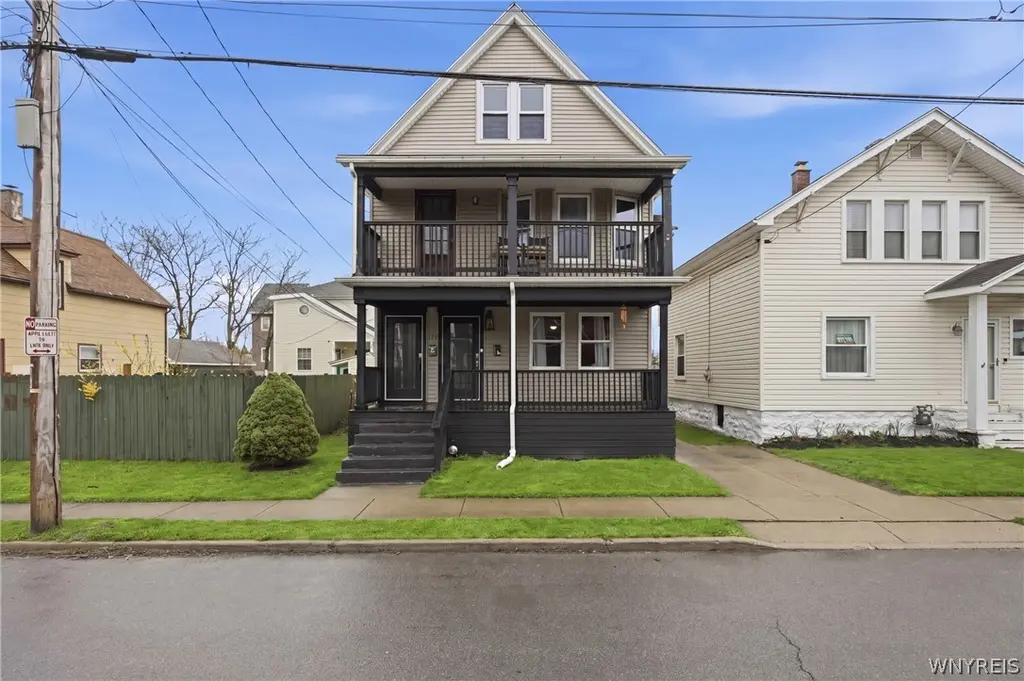
105 Edson St · West Seneca, NY
Flood risk 1/10 · Minimal
- FEMA flood zone
- X (unshaded)
- Chance of flooding over 30 yrs
- 0.0%
- Est. flood insurance / yr
- $473 – $860
Fire risk 1/10 · Minimal
- Est. fire insurance / yr
- $691 – $1,283
Heat risk 3/10 · Minor
- Hot days now (above 92°F)
- 7 days/yr
- Hot days in 30 yrs
- 16 days/yr
Wind risk 1/10 · Minimal
- Chance of severe wind over 30 yrs
- —
Air-quality risk 3/10 · Minor
- Unhealthy air days now
- 2 days/yr
- Unhealthy air days in 30 yrs
- 3 days/yr
Risk factors via First Street. Map © Google.
Why this score? — see what drove the A- grade
The composite is a weighted blend of 9 inputs, each scored 0–100. Each bar is that input's sub-score; the figure is the points it added to the 100-point composite (weight × sub-score).
- Cash flow +28.2/30.0
- ARV discount +12.1/15.0
- DSCR +10.0/10.0
- Appreciation +10.0/10.0
- 1% rule +8.1/10.0
- Rent growth +5.0/5.0
- Schools +4.5/10.0
- Livability +4.0/5.0
- Condition / age +2.5/5.0
$199,999
🖨 Deal sheet 📄 Offer letter ✓ Due diligence
Multi-family units
County records classify this as Multi-Family (2-4 Unit). Listing-text estimate: 2 units. confirmed
Listing remarks MLS
WEST SENECA 3/2 DOUBLE. VINYL SIDED W/ NEWER ROOF. SEPARATE UTILITIES, UPPER 2 BEDROOM UNIT VACANT, WAS RENTED FOR $1100MO PLUS GAS/ELECTRIC. UPPER UNIT FEATURES FORMAL LIVING/DINING ROOMS. LOWER 3 BEDROOM UNIT HAS HAD SAME TENANT FOR 14YRS. RENTS ONLY $750. ALOT OF ROOM TO INCREASE. LOWER UNIT HAS FORMAL LIVING AND DINING ROOM. FULL BASEMENT/ATTIC. FULLY FENCED YARD.
Key facts
- 3,745 sq ft lot
- Built 1917
- Listed 2 days
Property features AI
Finance
- Financial info: Two-unit property with separate gas and electric meters for each unit; Operating expense details: see remarks
Exterior
- Parking: Concrete parking surface
- Utilities: Public water connected; Sewer connected
- Home design: Two-story property; Resale condition
- Construction: Vinyl siding
- Exterior features: Rectangular residential lot; City street frontage; Lot dimensions approximately 35 x 107
Interior
- Kitchen: Gas water heater
- Bedrooms: One unit with 2 bedrooms; One unit with 3 bedrooms
- Flooring: Laminate; Varies by room
- Bathrooms: Two full bathrooms (one in each unit)
- Heating & cooling: Gas forced air heating
- Interior features: Full basement; Varied flooring
Neighborhood map
What this means for you Summary
Snapshot
- This is a 2 × 2-bed/1.0-bath units multifamily listed at $200k.
Deal economics
- At list price, monthly cash flow is $635 ($8k/yr) — positive. Per door: $317/mo.
- The deal already cash-flows at list — no discount required.
- Meets the 1% rule at list price ($3k rent vs $200k).
- Cap rate 10.1% vs local median 3.7% in West Seneca — top-decile yield for the area; either an underpriced asset or a hidden risk that comps aren't pricing in. Stress-test before assuming the spread holds.
Location & tenants
- Location reads 79/100 on livability (#130 in NY, #2,089 nationally) — a middle-class / working-renter tenant base. Strengths: housing A+, health & safety A+, crime A-; Watch: amenities D, commute F.
- West Seneca Central School District (suburban): math 49% / reading 55% proficiency, ranked #336 of 590 in NY (top 57%) — acceptable for families but not a draw, mixed tenant base, ~2y average lease.
- Market conditions: Rents rising fast (+12.7%/yr); 94 active listings in the ZIP; 1,244 units permitted in Erie County in 2024 (563 in 5+ unit buildings).
- At $2,624/mo this rent would consume 58% of the median local household income ($54k/yr) (locally 959% of renters already pay >50% of income on rent) — very limited rent-growth headroom before tenants either downsize or default.
Forward outlook
- In year one you build about $21k of equity ($1k loan paydown + $20k appreciation (10.0% local appreciation)).
- At projected returns (10.0% appreciation + 8.0% rent growth), your $56k cash investment doubles in ~2 years — after that, you're playing with house money.
- By year 2, paydown + projected appreciation supports a ~$34k cash-out refi (75% LTV) — recoverable capital for the next deal without selling this one.
Negotiation context
- Only 2 days on market — expect competitive offers; lowballing is unlikely to land.
- 4 sale attempts since 13y ago with the ask held roughly flat each time — persistent listings suggest the price (not the market) is what's stuck; bring a comps-based counter.
Risks & watch-outs
- Watch-outs: built in 1917 — expect roof / HVAC / electrical / plumbing capex.
Questions for the listing agent
- Can we see the unit-by-unit rent roll, current vacancy, and any below-market leases? What's the average tenancy length?
- What capital expenditures (roof, boiler, parking lot, exteriors) have been made in the last 5 years, and what's planned in the next 2?
- Built in 1917 — when were the roof, HVAC, electrical panel, plumbing, and water heater last replaced?
- Is there a deadline driving the sale (1031 exchange, divorce, estate, relocation)? That informs how much negotiation room exists.
- Schools are B-rated — typically a magnet for longer-tenancy family renters. What's the average tenant stay here, and is there a school-zone premium baked into asking?
- What's the average days-on-market for RENTAL listings here right now (not sales)? A rising rental-DOM trend means longer vacancies and softer asking-rent achievability than the comps imply.
- What's the recent tenant-quality profile in this submarket — average credit score on applications, eviction rate, late-payment / NSF rate, and stable-employment percentage? A property-management company in the area should have these aggregated.
- How much new apartment / multifamily construction is in the pipeline within 1–3 miles? Heavy new supply (>2% of stock underway) typically softens rents 12–24 months out; light construction supports rent growth.
Investment metrics
- 1% rule
- 1.31% ✓
- Cap rate
- 10.10%
- Cash-on-cash
- 13.60%
- DSCR
- 1.61
- GRM
- 6.4
CMA / ARV
- ARV (on-the-fly)
- $222,578
- Comps found
- 12
Show comp detail 12 sales within ~0.75 mi
| Address | Dist | Beds/Ba | Sqft | Sold | Price | $/sf | Match |
|---|---|---|---|---|---|---|---|
| 154 Chamberlin Dr | 0.20mi | 5/2.0 | 2,182 (+7%) | 2mo | $242,400 | $111 | 77 |
| 71 Buffum St | 0.28mi | 5/2.0 | 2,136 (+5%) | 6mo | $160,000 | $75 | 74 |
| 30 Chamberlin Dr | 0.32mi | 5/2.0 | 2,208 (+8%) | 5mo | $239,800 | $109 | 68 |
| 146 Chamberlin Dr | 0.20mi | 4/2.0 (-1) | 2,187 (+7%) | 8mo | $290,000 | $133 | 68 |
| 18 Stephenson Ave | 0.46mi | 6/2.0 (+1) | 1,978 (-3%) | 2mo | $226,000 | $114 | 66 |
| 46 Kirkwood Dr | 0.39mi | 4/2.0 (-1) | 2,128 (+4%) | 5mo | $198,700 | $93 | 66 |
| 96 Wildwood Pl | 0.25mi | 6/2.0 (+1) | 2,288 (+12%) | 8mo | $90,000 | $39 | 57 |
| 48 Ryan St | 0.69mi | 4/2.0 (-1) | 2,084 (+2%) | 8mo | $213,000 | $102 | 53 |
| 69 Red Jacket Pkwy | 0.75mi | 6/2.0 (+1) | 2,032 (-0%) | 10mo | $229,000 | $113 | 51 |
| 389 Cumberland Ave | 0.66mi | 5/2.0 | 2,328 (+14%) | 5mo | $280,000 | $120 | 42 |
| 132 Ryan St | 0.67mi | 6/3.0 (+1) | 2,230 (+9%) | 7mo | $205,000 | $92 | 38 |
| 110 Weyand Ave | 0.57mi | 6/2.0 (+1) | 2,344 (+15%) | 10mo | $235,000 | $100 | 36 |
Match score weights: distance 35% · size 25% · config 20% · recency 20%. Top-matched comps best support the ARV.
Projected returns pro-forma
10.0% appreciation · 8.0% rent growth · sell at horizon
- IRR
- 36.8%
- Equity multiple
- 3.92×
- Total profit
- $163,290
- Equity at exit
- $180,175
- IRR
- 33.6%
- Equity multiple
- 9.64×
- Total profit
- $483,575
- Equity at exit
- $388,554
Cash invested: $56,000 (down + closing). Projections, not guarantees.
Landlord ↔ Tenant lean methodology
- Overall (STATE)
- 15 Strongly Tenant-Friendly
- State New York
- 15 Strongly Tenant-Friendly · D+10
- County
- — inherits STATE
- City
- — inherits STATE
ZIP-level market 14210
- Home prices YoY
- 13.8%
- Rents YoY
- 12.7%
- Active inventory
- 94
- Price-to-rent
- 12.7×
Monthly cashflow live
- Estimated rent
- $2,624 high interval (Pro) →
- Mortgage (P&I)
- −$1,049
- Tax from tax record
- −$306 /mo · $3,673/yr
- Insurance
- −$83
- HOA
- −$0
- Vacancy / Maint / Mgmt
- −$551
- Net cashflow
- $635
Break-even live
2-unit breakdown (identical units grouped — click to expand)
| Units | Beds | Baths | Est. rent |
|---|---|---|---|
| 2× units | 2 | 1 | $2,624 |
| #1 | 2 | 1 | $1,312 |
| #2 | 2 | 1 | $1,312 |
| Total (2 units) | $2,624 | ||
UW: 25.0% down · 7.5% · 30yr · 1.5% tax · 5.0% vac · 8.0% maint · 8.0% mgmt
Financing live
Cash to close
- Down payment
- $50,000
- Closing costs
- $6,000
- Reserves months
- —
- Total cash needed
- —
Loan-product check · same deal, 3 products live
Conventional
25% down · 7.5% · 30yr
- Down + closing
- —
- Monthly P&I
- —
- Monthly cashflow
- —
- DSCR
- —
- Eligible?
- —
Personal DTI + credit; lowest rate.
DSCR
20% down · 8.5% · 30yr
- Down + closing
- —
- Monthly P&I
- —
- Monthly cashflow
- —
- DSCR
- —
- Eligible?
- —
No personal income docs; deal must DSCR.
Hard money
10% down · 12.0% · 12mo
- Down + closing
- —
- Monthly P&I
- —
- Monthly cashflow
- —
- DSCR
- —
- Eligible?
- —
Short-term bridge; refi at stabilization.
Listing history 10 events
-
2026-04-29status Pending
-
2026-04-27$199,999 Active
-
2024-12-31soldstatus $175,000 Closed 370-char remark
Show marketing remark (370 chars)
WEST SENECA 3/2 DOUBLE. VINYL SIDED W/ NEWER ROOF. SEPARATE UTILITIES, UPPER 2 BEDROOM UNIT VACANT, WAS RENTED FOR $1100MO PLUS GAS/ELECTRIC. UPPER UNIT FEATURES FORMAL LIVING/DINING ROOMS. LOWER 3 BEDROOM UNIT HAS HAD SAME TENANT FOR 14YRS. RENTS ONLY $750. ALOT OF ROOM TO INCREASE. LOWER UNIT HAS FORMAL LIVING AND DINING ROOM. FULL BASEMENT/ATTIC. FULLY FENCED YARD.
-
2024-11-04status Pending 370-char remark
Show marketing remark (370 chars)
WEST SENECA 3/2 DOUBLE. VINYL SIDED W/ NEWER ROOF. SEPARATE UTILITIES, UPPER 2 BEDROOM UNIT VACANT, WAS RENTED FOR $1100MO PLUS GAS/ELECTRIC. UPPER UNIT FEATURES FORMAL LIVING/DINING ROOMS. LOWER 3 BEDROOM UNIT HAS HAD SAME TENANT FOR 14YRS. RENTS ONLY $750. ALOT OF ROOM TO INCREASE. LOWER UNIT HAS FORMAL LIVING AND DINING ROOM. FULL BASEMENT/ATTIC. FULLY FENCED YARD.
-
2024-10-07price $179,900 370-char remark
Show marketing remark (370 chars)
WEST SENECA 3/2 DOUBLE. VINYL SIDED W/ NEWER ROOF. SEPARATE UTILITIES, UPPER 2 BEDROOM UNIT VACANT, WAS RENTED FOR $1100MO PLUS GAS/ELECTRIC. UPPER UNIT FEATURES FORMAL LIVING/DINING ROOMS. LOWER 3 BEDROOM UNIT HAS HAD SAME TENANT FOR 14YRS. RENTS ONLY $750. ALOT OF ROOM TO INCREASE. LOWER UNIT HAS FORMAL LIVING AND DINING ROOM. FULL BASEMENT/ATTIC. FULLY FENCED YARD.
-
2024-09-21$199,900 Active 370-char remark
Show marketing remark (370 chars)
WEST SENECA 3/2 DOUBLE. VINYL SIDED W/ NEWER ROOF. SEPARATE UTILITIES, UPPER 2 BEDROOM UNIT VACANT, WAS RENTED FOR $1100MO PLUS GAS/ELECTRIC. UPPER UNIT FEATURES FORMAL LIVING/DINING ROOMS. LOWER 3 BEDROOM UNIT HAS HAD SAME TENANT FOR 14YRS. RENTS ONLY $750. ALOT OF ROOM TO INCREASE. LOWER UNIT HAS FORMAL LIVING AND DINING ROOM. FULL BASEMENT/ATTIC. FULLY FENCED YARD.
-
2014-05-20historical
-
2014-02-22$49,900
-
2013-04-15$52,900
-
1993-09-10soldstatus $58,000
ⓘ Source: listings_history table (triggers on properties + properties_extension) + one-shot
backfill from property_details.listing_events for pre-trigger history.
Tax reassessment forecast NY · Partial reset (capped growth)
- Current annual tax
- $3,673 · $306/mo
- Projected year-2 tax
- $3,673 · $306/mo
- Expected delta
- $0/yr ($0/mo · 0.0%)
ⓘ Screening estimate from a state-policy table — verify with the county assessor before closing.
Climate risk First Street
- Flood 1/10 Low FEMA zone X (unshaded) · 0% chance over 30 yrs
- Wildfire 1/10 Low
- Heat 3/10 Moderate 7 d/yr ≥92°F today · 16 d/yr by 30 yrs out
- Wind 1/10 Low
- Air quality 3/10 Moderate 2 unhealthy d/yr today · 3 by 30 yrs out
Nearby sold comps map
Loading sold comps map…
Walkable amenities ~0.75 mi
Loading nearby amenities…
Taxation est. · year 1
- Rental income
- $31,488
- − Mortgage interest
- −$11,203
- − Property taxes
- −$3,673
- − Insurance
- −$1,000
- − Repairs & maintenance
- −$2,519
- − Management
- −$2,519
- − Depreciation
- −$5,818
- Taxable income
- $4,755
- Est. tax owed @ 24.0%
- −$1,141
- After-tax cash flow
- $6,475/yr
For passive investors: Depreciation is non-cash, so a rental often shows a tax loss while cash-flowing — sheltering income. Rental losses are passive: they offset passive income freely, and up to $25,000/yr can offset ordinary (W-2) income if you actively participate and your MAGI is under $100k (phasing out to $0 by $150k); unused losses carry forward. On sale, claimed depreciation is recaptured at up to 25%, and gains may owe capital-gains tax (a 1031 exchange can defer both). Figures are a year-1 estimate at your 24.0% rate — not tax advice; consult a CPA.
Schools (NCES district)
- District
- West Seneca Central School District
- NCES district ID
- 3630780
- Math proficiency
- 49% ▼ -15.00%
- Reading proficiency
- 55% ▼ -4.00%
- Median HH income
- $54,231
- Composite
- 44.83/100
- National rank
- #2735
- State rank
- #336 of 590 in NY
Livability — West Seneca
- Score
- 79/100
- State rank
- #130
- US rank
- #2089
Category grades
Schools grade is shown separately in the Schools card above.
Census & demographics
- Census place
- West Seneca, NY
- County
- Erie County · 714,559 people
- City population
- 41,101
- Metro
- Buffalo-Cheektowaga, NY
- Population (ZIP)
- 15,563
- Household income
- $54,197
- Rent vs Own
- Severe rent burden
- 959.0
Population outlook (Erie County) Hauer SSP2
- Today (2025)
- 933,037 people
- By 2030
- 935,181 · +0.2%
- By 2040
- 928,531 · -0.5%
- By 2050
- 905,725 · -2.9%
- By 2075
- 834,037 · -10.6%
- By 2100
- 708,033 · -24.1%
Race, ethnicity, and origin ACS 2023
- Neighborhood character
- Predominantly White (79%)
- Race & ethnicity
- White 79% Two or more races 8% Black 8% Hispanic / Latino 7% Asian 1%
- Hispanic origin (detail)
- Puerto Rican 6%
- Common ancestry
- Romanian 21% Lithuanian 2% Serbian 1%
- Foreign-born
- 2% · Canada, China
- Languages at home
- 95% English-only · Spanish 2% Arabic 1% Other Indo-European 1%
Political lean MEDSL · Erie
- 2024 margin
- Lean D (+9.7) · D 54.8% · R 45.2%
- 2008→2024 swing
- -7.9pp toward R · 2008: 17.5pp · 2024: 9.7pp
- All cycles
- 2024: D+9.7 2020: D+14.7 2016: D+4.8 2012: D+15.6 2008: D+17.5
Not yet ingested
- Civics
- —
Market trends
- HPI YoY
- ▲ 52.34%
- Current HPI
- 431.7951
- Rent YoY
- ▲ 12.67%
- Metro
- Buffalo-Cheektowaga, NY
- State GDP YoY
- ▲ 2.60%
- F500 in state
- 92
Industry mix (Fortune 500 HQ in NY)
| Industry | F500 HQs | Revenue |
|---|---|---|
| Financial Services | 10 | $950B |
|
||
| Consumer Goods | 9 | $162B |
|
||
| Insurance | 4 | $225B |
|
||
| Telecommunications | 2 | $144B |
|
||
| Pharmaceuticals | 2 | $112B |
|
||
| Media / Entertainment | 2 | $69B |
|
||
Price history
+244.8% since first listed10 events — show timeline
- 2026-04-29 Pending — WNYREIS
- 2026-04-27 Listed $199,999 WNYREIS
- 2024-12-31 Sold (MLS) $175,000 WNYREIS
- 2024-11-04 Pending — WNYREIS
- 2024-10-07 Price Changed $179,900 WNYREIS
- 2024-09-21 Listed $199,900 WNYREIS
- 2014-05-20 Listing Removed — WNYREIS
- 2014-02-22 Listed $49,900 WNYREIS
- 2013-04-15 Listed $52,900 WNYREIS
- 1993-09-10 Sold (Public Records) $58,000 Public Records
Property tax history
+1.6%/yrLatest (2025): $3,673 · +0.7% YoY. Source: county tax records.
Cash-flow waterfall
monthlySold comps — $/sqft
last 12 mo · ≤1 miLoading sold comps…